
| REPORT ATTRIBUTE | DETAILS |
|---|---|
| Historical Period | 2019-2022 |
| Base Year | 2023 |
| Forecast Period | 2024-2032 |
| Deflaker Market Size 2024 | USD 787.7 million |
| Deflaker Market, CAGR | 4.9% |
| Deflaker Market Size 2032 | USD 1,154.95 million |
Market Overview:
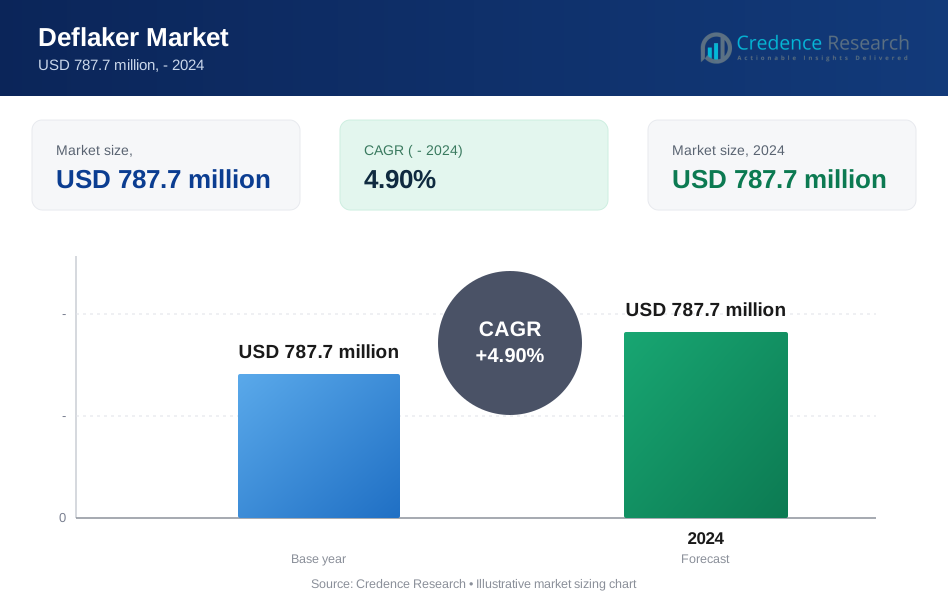
The Deflaker Market is projected to experience steady growth, with a market size of USD 787.7 million in 2024, anticipated to expand to USD 1,154.95 million by 2032, reflecting a Compound Annual Growth Rate (CAGR) of 4.9% during the forecast period.
Deflakers, used in the pulp and paper industry to improve fiber processing efficiency and quality, have garnered increasing attention due to their ability to enhance productivity while reducing energy consumption. As industries increasingly prioritize efficiency and sustainability, the demand for deflakers is expected to maintain an upward trajectory across global markets.
Key market drivers contributing to the growth of the deflaker market include the rising demand for high-quality pulp and paper products, driven by expanding packaging needs, especially in emerging economies. Heightened awareness regarding waste reduction, recycling, and energy-efficient processing has encouraged pulp and paper manufacturers to adopt advanced deflaking technologies. The industry’s focus on reducing production costs and minimizing environmental impact through efficient resource use and optimized production workflows further propels the market's growth. Additionally, technological advancements, such as the development of automated and energy-saving deflakers, continue to offer lucrative opportunities for market expansion.
Regional analysis highlights that North America and Europe are mature markets characterized by the presence of key industry players and established pulp and paper sectors, driving significant adoption of deflaker solutions. However, Asia-Pacific is poised to witness the highest growth due to rapid industrialization, increasing consumer demand for packaging materials, and rising investments in advanced production facilities. Countries such as China and India are spearheading the growth, fueled by robust demand for paper-based products and evolving regulatory frameworks aimed at improving production efficiency. Meanwhile, Latin America and the Middle East & Africa are expected to register moderate growth, spurred by the gradual modernization of their paper and pulp industries.
Market Drivers:
Technological Advancements:
The deflaker market is significantly driven by technological advancements that enhance the efficiency of fiber processing. Companies are increasingly investing in innovative technologies to improve deflaking processes, which are crucial for the production of high-quality pulp. For instance, recent studies indicate that the integration of advanced mechanical and chemical methods can increase fiber yield by up to 30% while reducing energy consumption by 15%. This shift towards more efficient technologies is not only beneficial for production costs but also aligns with the growing emphasis on sustainability within the industry.
Growing Demand for Sustainable Practices:
Another key driver in the deflaker market is the increasing demand for sustainable practices across various sectors. As environmental regulations tighten, manufacturers are compelled to adopt greener technologies. For instance, A survey conducted by industry experts revealed that over 60% of paper manufacturers are prioritizing sustainability in their operations, leading to a surge in demand for eco-friendly deflakers. This trend is further supported by government initiatives aimed at promoting sustainable manufacturing processes, which have seen a rise in funding for research and development in this area.
Expansion of the Paper Industry:
The expansion of the global paper industry also plays a pivotal role in driving the deflaker market. With an expected annual growth rate of 3.5%, the paper industry is witnessing increased production capacities, particularly in emerging markets such as Asia-Pacific. This growth necessitates more efficient deflaking processes to meet rising production demands. For instance, companies like Valmet have reported a significant uptick in orders for their advanced deflaking systems, which are designed to handle larger volumes while maintaining product quality.
Competitive Market Landscape:
Lastly, the competitive landscape of the deflaker market propels innovation and efficiency improvements. Key players are continuously striving to differentiate themselves through superior technology and customer service. A report highlighted that companies investing in R&D are achieving up to 25% higher market share compared to their competitors who do not prioritize innovation. This competitive drive fosters an environment where advancements in deflaking technology are rapidly adopted, ensuring that manufacturers can meet both quality and sustainability standards effectively.
Market Trends:
Increasing Adoption of Recycled Materials:
A prominent trend in the deflaker market is the growing adoption of recycled materials in pulp and paper production. As industries strive for sustainability, the use of recycled fibers has surged. For instance, a report from the Paper Industry Technical Association highlights that 50% of the raw materials used in paper production in Europe now consist of recycled fibers. This shift not only reduces waste but also lowers production costs, as recycled materials are often less expensive than virgin fibers. Companies are increasingly investing in deflakers that can efficiently process these recycled materials, enhancing their operational capabilities.
Enhanced Focus on Energy Efficiency:
Energy efficiency is becoming a critical consideration for manufacturers within the deflaker market. Recent surveys indicate that over 70% of paper manufacturers are implementing energy-saving technologies to reduce operational costs and minimize their environmental footprint. For example, Valmet has introduced advanced deflaker systems that utilize up to 20% less energy compared to traditional models. This focus on energy efficiency is not only driven by regulatory requirements but also by the need for companies to maintain competitiveness in a market where energy prices continue to rise.
Integration of Smart Technologies:
The integration of smart technologies into deflaking processes is another significant trend reshaping the market. The rise of Industry 4.0 has prompted manufacturers to adopt smart sensors and automation solutions to optimize production processes. For instance, according to industry reports, companies are now utilizing IoT-enabled devices to monitor and control deflaking operations in real-time. This technological advancement allows for better quality control and increased efficiency, as manufacturers can quickly adjust processes based on data analytics.
Regulatory Influences and Compliance:
Regulatory influences are increasingly shaping the deflaker market as governments worldwide impose stricter environmental standards. Recent government surveys indicate that compliance with these regulations is a top priority for over 65% of paper producers. In response, many companies are upgrading their equipment to meet these standards, which often include emissions reductions and waste management protocols. For instance, companies like Andritz have developed deflakers designed specifically to comply with new environmental regulations, ensuring that manufacturers can operate sustainably while maintaining compliance with local laws.
Market Challenges Analysis:
High Capital Investment:
The Deflaker Market faces challenges primarily due to the significant capital investment necessary for the installation and maintenance of deflaker systems. Small and medium-sized enterprises (SMEs), a major segment within the pulp and paper industry, often struggle to allocate sufficient funds for such high-cost equipment upgrades. This challenge is further exacerbated by fluctuating raw material prices and rising operational costs, making it difficult for smaller market players to achieve profitability while incorporating advanced deflaker solutions into their processes.
Stringent Environmental Regulations:
Compliance with strict environmental regulations presents another key restraint for the market. Governmental authorities, such as the U.S. Environmental Protection Agency (EPA) and European Union (EU) Environmental Standards, impose stringent guidelines aimed at reducing energy consumption, waste management, and emissions control in the pulp and paper industry. While these regulations drive demand for efficient deflaker technologies, they also introduce compliance costs and require significant operational changes, which may pose a burden for many companies, especially in regions with highly regulated industrial sectors.
Limited Availability of Skilled Labor:
The market also grapples with the challenge of a limited availability of skilled labor capable of operating and maintaining advanced deflaker systems. Efficient utilization of these systems demands specialized training and expertise, which may not be readily available in some regions. Furthermore, reliance on legacy equipment in various areas compounds this issue, as the transition to modern deflaker systems often involves both financial and operational obstacles. To mitigate these challenges, market players must prioritize innovation to lower costs, simplify system operation, and align with evolving regulatory requirements. Additionally, collaboration with regulatory bodies and investment in workforce training initiatives are crucial for overcoming these barriers.
Market Segmentation Analysis:
By Type, the market is categorized into batch-type and continuous-type deflakers. Batch-type deflakers are favored for operations requiring precise control, whereas continuous-type deflakers offer higher efficiency for large-scale, uninterrupted processes. Continuous systems dominate market share due to their operational cost advantages, productivity enhancements, and suitability for high-demand applications in the pulp and paper industry.
By Technology, deflakers are divided into manual, semi-automated, and fully automated systems. While manual systems maintain a modest market presence due to lower costs, the adoption of semi-automated and fully automated systems is growing rapidly. Automation enables precise control, operational efficiency, and reduced labor requirements, which are critical for modern production environments. The increasing focus on industrial automation, cost reduction, and minimizing human errors drives growth within these advanced categories.
By End User, the market is segmented into pulp and paper, packaging, recycling, and others, including specialty paper manufacturers. The pulp and paper segment remains the primary end-user, driven by the rising demand for quality fiber processing and efficient production. The packaging segment is expanding due to increased demand for sustainable packaging solutions, while the recycling segment benefits from growing regulatory and environmental pressures for circular economy initiatives and waste management. As industry needs evolve, each end-user segment represents a distinct opportunity for further market development and technological advancements in deflaker systems.
Segmentations:
By Power:
- Below 90 kW
- 90 kW-400 kW
- 400 kW-800 kW
- Above 800 kW
By Application:
- Stock Preparation
- Broke Handling Processes
By Region:
- North America
- U.S.
- Canada
- Mexico
- Europe
- Germany
- France
- U.K.
- Italy
- Spain
- Rest of Europe
- Asia Pacific
- China
- Japan
- India
- South Korea
- South-east Asia
- Rest of Asia Pacific
- Latin America
- Brazil
- Argentina
- Rest of Latin America
- Middle East & Africa
- GCC Countries
- South Africa
- Rest of the Middle East and Africa
Regional Analysis:
North America holds a substantial market share, accounting for approximately 25% of the global market. The region's dominance is fueled by established pulp and paper industries, extensive adoption of advanced deflaker technologies, and a strong focus on operational efficiency. The presence of key market players and continuous investments in automation and sustainable production practices further bolster market growth. Moreover, regulatory requirements from agencies such as the U.S. Environmental Protection Agency (EPA) have prompted manufacturers to adopt energy-efficient deflaking solutions, enhancing productivity and sustainability.
Europe captures nearly 22% of the global market share, driven by stringent environmental regulations and a strong emphasis on waste reduction and energy efficiency. The European Union’s (EU) directives on sustainable industrial practices and the circular economy encourage the adoption of modern deflakers. The market's growth is particularly strong in countries like Germany, Sweden, and Finland, where the pulp and paper industry is well-established. Increasing demand for packaging and specialty papers, coupled with advances in automation, further propel the market.
Asia-Pacific is the fastest-growing region, with a market share of approximately 35%, reflecting the rapid expansion of its pulp and paper industry. Countries such as China, India, and Japan are spearheading this growth due to increased demand for packaging materials, industrial development, and significant investments in state-of-the-art production facilities. Rising environmental awareness and regulatory measures to enhance energy efficiency also play a critical role. This region presents lucrative growth opportunities, supported by cost-effective labor, growing consumer markets, and evolving industry standards.
Latin America holds a moderate market share of around 10%, driven by a gradual modernization of the pulp and paper industry. Brazil and Chile are key contributors, with increasing investments in technology and infrastructure to improve production efficiency. Despite challenges such as economic fluctuations, the region’s focus on improving manufacturing capabilities positions it as a growth market for deflakers.
The Middle East & Africa with a market share of about 8%, shows potential for growth as industrialization progresses. Limited current adoption rates are being addressed through modernization initiatives and regulatory incentives. Growth in the packaging sector, coupled with a growing focus on sustainability, offers long-term opportunities for market expansion in this region.
Key Player Analysis:
- Voith
- Andritz AG
- Parason
- PAPCEL
- AFT
- Shandong Xuridong Machinery
- Hergen
- Overmade
- Valmet
- Metso
Competitive Analysis:
The Deflaker Market is highly competitive, driven by the presence of established players and emerging entrants focused on innovative solutions and efficiency improvements. Major companies, including Voith, Andritz AG, Parason, and Valmet, dominate the market by offering advanced technologies and comprehensive solutions that cater to a wide range of industrial needs. These players continuously invest in research and development to improve deflaker performance, energy efficiency, and automation capabilities. Competition centers around providing cost-effective, reliable, and environmentally friendly solutions to meet stringent industry standards and customer expectations. New entrants and regional players seek to differentiate themselves through specialized solutions tailored to local market demands, emphasizing cost-effectiveness and operational flexibility. As market dynamics evolve, competitive pressure is expected to intensify, encouraging continuous innovation, strategic partnerships, and expansion into emerging markets to capture new growth opportunities and address evolving industry challenges.
Recent Developments:
- In 2023, Voith launched the "EcoDeflake" series, featuring energy-efficient deflakers designed to reduce operational costs and environmental impact.
- In 2022, Andritz AG introduced the "PrimeDeflaker," incorporating advanced automation for improved fiber processing and reduced maintenance requirements.
- In 2024, Parason unveiled a deflaker model with enhanced rotor design, aiming to increase throughput and fiber quality in pulp processing.
- In 2023, Valmet developed a deflaker system integrated with IoT capabilities, enabling real-time monitoring and predictive maintenance to optimize performance.
Market Concentration & Characteristics:
The Deflaker Market is characterized by moderate to high market concentration, with a mix of well-established global players and regional companies. Leading firms, including Voith, Andritz AG, Parason, and Valmet, hold significant market shares due to their extensive product portfolios, technological expertise, and established customer bases. The market's concentration results from the high costs and technical expertise required to develop advanced deflaker systems, creating a barrier for new entrants. Competitive differentiation revolves around innovation in energy efficiency, automation, and performance reliability. Market players continuously invest in research and development to address evolving customer demands and regulatory requirements for efficiency and sustainability. The market also exhibits consolidation trends, as key players pursue mergers, acquisitions, and strategic partnerships to expand their product offerings, geographical reach, and technological capabilities. These dynamic fosters continuous improvement and competition while shaping market characteristics and growth trajectories.
Report Coverage:
The research report offers an in-depth analysis based on Power, Application, and Region. It details leading market players, providing an overview of their business, product offerings, investments, revenue streams, and key applications. Additionally, the report includes insights into the competitive environment, SWOT analysis, current market trends, as well as the primary drivers and constraints. Furthermore, it discusses various factors that have driven market expansion in recent years. The report also explores market dynamics, regulatory scenarios, and technological advancements that are shaping the industry. It assesses the impact of external factors and global economic changes on market growth. Lastly, it provides strategic recommendations for new entrants and established companies to navigate the complexities of the market.
Future Outlook:
- The Deflaker Market is poised for significant growth, driven by rising demand for high-quality pulp and paper products and efficient fiber processing solutions.
- Increasing emphasis on sustainable and energy-efficient production processes is expected to spur innovation and the adoption of advanced deflaker systems.
- Technological advancements, including automation, IoT integration, and data-driven optimization, will enhance operational efficiency and reduce production costs, creating opportunities for market expansion.
- Regulatory pressure to reduce emissions, waste, and energy consumption will continue to drive manufacturers toward adopting environmentally friendly deflaker solutions.
- Emerging economies, particularly in Asia-Pacific, will lead market growth, supported by industrialization, expanding packaging needs, and investments in modern manufacturing infrastructure.
- Strategic partnerships, mergers, and acquisitions among key players will shape market dynamics, enhance competitiveness, and broaden product portfolios.
- The integration of predictive maintenance and real-time monitoring capabilities will further increase market adoption and operational reliability.
- Rising raw material and operational costs may present challenges, prompting players to focus on cost-effective, high-performance systems.
- Small and medium-sized enterprises will seek cost-effective solutions, driving demand for versatile and user-friendly deflaker technologies.
- Regional market growth will be influenced by varying degrees of industrialization, regulatory frameworks, and economic conditions, creating unique opportunities and challenges.
Request a Free Sample
Fill in your details and we'll send you a free sample report.
- Sample data tables & charts
- Research methodology
Need a Custom Version of This Report?
Tailor the scope, geography, or segments to your exact requirements.
- Custom geography or segment scope
- Direct access to our analyst team
Frequently Asked Questions
What is the current size of the Deflaker Market?
What factors are driving the growth of the Deflaker Market?
What are some challenges faced by the Deflaker Market?
Who are the major players in the Deflaker Market?
Which segment is leading the market share?
Table of Content
Chapter 1. Report Introduction
- 1.1 Report Description & Purpose
- 1.1.1 Report Title & Market Definition
- 1.1.2 Unique Selling Propositions (USP) & Key Differentiators
- 1.1.3 Value Proposition for Stakeholders
- 1.2 Research Objectives
- 1.2.1 Market Sizing Objectives (Volume & Revenue)
- 1.2.2 Segmentation Objectives
- 1.2.3 Competitive Intelligence Objectives
- 1.2.4 Forecast & Scenario Objectives
- 1.3 Report Scope
- 1.3.1 Deflaker Scope – Types & Subtypes Covered
- 1.3.2 Geographic Scope – Regions & Countries Covered
- 1.3.3 Historical Period, Base Year & Forecast Period (the historical period; forecast to 2024)
- 1.3.4 Inclusions & Exclusions
- 1.4 HS Code & Classification Framework
- 1.5 Currency, Units & Pricing Basis
- 1.6 Target Stakeholders
- 1.7 Limitations & Assumptions
Chapter 2. Executive Summary
- 2.1 Global Deflaker Market Snapshot
- 2.1.1 Market Size – Historical (the historical period) & Forecast (2024) (base year: USD 787.7 million → 2024: USD 787.7 million)
- 2.1.2 Volume & Revenue – Global Totals
- 2.1.3 Key Market Highlights – Top Five Facts
- 2.2 Deflaker Market Segmentation Snapshot
- 2.2.1 Market Split by Region – vs. 2024
- 2.3 Competitive Snapshot
- 2.3.1 Top 10 Players by Revenue Share –
- 2.3.2 Top 10 Players by Volume Share –
- 2.3.3 Recent Strategic Developments (18-Month Summary)
- 2.4 Key Investment Highlights & Strategic Conclusions
Chapter 3. Deflaker Market Dynamics & Industry Analysis
- 3.1 Market Overview & Context
- 3.1.1 Deflaker Market Position in the Broader Automotive Value Chain
- 3.1.2 OEM vs. Replacement Market Dynamics
- 3.1.3 Market Maturity & Development Stage by Region
- 3.2 Deflaker Market Drivers
- 3.3 Deflaker Market Restraints & Challenges
- 3.4 Deflaker Market Opportunities
- 3.5 Porter's Five Forces Analysis
- 3.5.1 Threat of New Entrants
- 3.5.2 Bargaining Power of Suppliers
- 3.5.3 Bargaining Power of Buyers
- 3.5.4 Threat of Substitutes
- 3.5.5 Competitive Rivalry – Intensity Assessment
- 3.6 Deflaker Value Chain Analysis
- 3.6.1 Upstream – Raw Material/Input Suppliers
- 3.6.1.1 Raw Material/Input 1
- 3.6.1.2 Raw Material/Input 2
- 3.6.1.3 Raw Material/Input 3
- 3.6.2 Midstream – Production/Manufacturing/Service Delivery
- 3.6.2.1 Production/Process Overview
- 3.6.2.2 Key Facility Locations & Capacity by Manufacturer
- 3.6.3 Downstream – Distribution & End Consumer
- 3.6.3.1 Primary Channel – B2B/OEM
- 3.6.3.2 Secondary Channels – Dealer, Retail, Online, Direct
- 3.6.4 Value Chain Profitability Analysis
- 3.6.1 Upstream – Raw Material/Input Suppliers
- 3.7 PESTEL Analysis
- 3.7.1 Political Factors
- 3.7.2 Economic Factors
- 3.7.3 Social Factors
- 3.7.4 Technological Factors
- 3.7.5 Environmental Factors
- 3.7.6 Legal Factors
- 3.8 Deflaker Supply Chain Analysis
- 3.8.1 Raw Material/Input Supply Risk Assessment
- 3.8.2 Manufacturing Concentration Risk (Geographic Exposure)
- 3.8.3 Trade Disruption Impact Analysis
- 3.9 Regulatory & Policy Landscape
Note: The regulatory and policy landscape section covers regulations based on their applicability to the market, Deflaker category, geography, and scope of the study. Only regulatory frameworks with a material impact on operations, compliance, trade, sustainability, or market access are analyzed in detail.
Chapter 4. Key Investment Pockets & Opportunity Analysis
- 4.1 Deflaker Market Attractiveness Analysis
- 4.1.1 By Region – Investment Attractiveness Matrix (Volume × CAGR)
- 4.2 Absolute Revenue Growth Opportunity
- 4.2.1 By Region – Absolute USD Growth Through 2024
- 4.3 Incremental Volume Opportunity
- 4.3.1 By Region – Incremental Volume Through 2024
- 4.3.2 Segment – Incremental Volume
- 4.4 Emerging Submarket Opportunity Deep Dive (Subject to Applicability)
- 4.5 Emerging Market Opportunity Scorecards
- 4.5.1 United States
- 4.5.2 Europe
- 4.5.3 Asia
- 4.5.4 Middle East & Africa
Note: Emerging Market Opportunity Scorecards will be included based on relevance and strategic importance. Regions listed are indicative and may vary depending on data availability and market dynamics.
Chapter 5. Deflaker Import-Export Analysis & Trade Flows
- 5.1 Global Trade Overview
- 5.1.1 Global Export Value by Country (the historical period)
- 5.1.2 Global Export Volume by Country (the historical period)
- 5.1.3 Global Import Value by Country (the historical period)
- 5.1.4 Global Import Volume by Country (the historical period)
- 5.1.5 Net Trade Balance by Country (the historical period)
- 5.2 Export Analysis – Segment
- 5.2.1 Type 1 (HS Code)
- 5.2.2 Type 2 (HS Code)
- 5.2.3 Type 3 (HS Code)
- 5.2.4 Type 4 (HS Code)
- 5.2.5 Type 5 (HS Code)
- 5.3 Import Analysis – Segment
- 5.3.1 Type 1 (HS Code)
- 5.3.2 Type 2 (HS Code)
- 5.3.3 Type 3 (HS Code)
- 5.3.4 Type 4 (HS Code)
- 5.3.5 Type 5 (HS Code)
- 5.4 Average Unit Trade Prices
- 5.4.1 Average Export Price – Segment & Country
- 5.4.2 Average Import Price – Segment & Source Country
- 5.4.3 Price Trends (the historical period)
- 5.5 Key Trade Route Analysis
- 5.5.1 Trade Route 1
- 5.5.2 Trade Route 2
- 5.5.3 Trade Route 3
- 5.5.4 Trade Route 4
- 5.5.5 Trade Route 5
- 5.6 Trade Policy Impact Assessment
- 5.6.1 US Anti-Dumping & Section 301 Tariffs
- 5.6.2 EU Customs Union Impact
- 5.6.3 Major Free Trade Agreements
- 5.6.4 USMCA Rules of Origin
Note: Trade policy analysis will be included only where relevant to the Deflaker market.
Chapter 6. Competitive Landscape & Company Benchmarking
- 6.1 Deflaker Market Concentration & Structure
- 6.1.1 Herfindahl-Hirschman Index (HHI) – vs.
- 6.1.2 Tier 1, Tier 2 & Tier 3 Market Structure
- 6.1.3 Global, Regional & Local Player Dynamics
- 6.2 Deflaker Market Share Analysis –
- 6.2.1 Global Revenue Share by Company
- 6.2.2 Global Volume Share by Company
- 6.2.3 Regional Revenue Share
- 6.2.4 Market Share Evolution ( vs. )
- 6.2.5 OEM Segment Share by Company
- 6.2.6 Replacement Segment Share by Company
- 6.3 Production/Delivery Capacity & Facility Analysis
- 6.3.1 Global Installed Capacity
- 6.3.2 Capacity Utilization Rates
- 6.3.3 Production/Output Volume
- 6.3.4 Facility Locations & Capacity Map
- 6.3.5 Planned Capacity Additions
- 6.4 Deflaker Competitive Benchmarking Matrix
- 6.4.1 Revenue, Volume, CAGR & Profitability Comparison
- 6.4.2 Channel Revenue Mix
- 6.4.3 Geographic Revenue Exposure
- 6.4.4 R&D Intensity
- 6.4.5 Sustainability Maturity
- 6.5 Strategic Developments in Deflaker (Last 24 Months)
- 6.5.1 Mergers, Acquisitions & Divestments
- 6.5.2 New Deflaker Launches
- 6.5.3 Facility Expansions
- 6.5.4 Strategic Alliances, Joint Ventures & Partnerships
- 6.5.5 Distribution Expansion & Market Entry
- 6.5.6 Sustainability & ESG Initiatives
- 6.6 Competitive Strategy Mapping
- 6.6.1 Leader, Challenger, Follower & Niche Classification
- 6.6.2 Pricing Strategy Comparison
- 6.6.3 Channel Strategy Matrix
Note: Strategic developments are included based on their materiality and the availability of reliable information.
Chapter 7. Global Deflaker Market – By Distribution Channel
- 7.1 Segment Overview
- 7.1.1 Volume & Revenue Split by Channel ( & 2024)
- 7.1.2 Channel Mix Evolution (2024)
Chapter 8. Regional Market Analysis – Global Overview
- 8.1 Global Regional Overview
- 8.1.1 Regional Volume Share
- 8.1.2 Regional Revenue Share
- 8.1.3 Regional Volume by Region
- 8.1.4 Regional Revenue by Region
- 8.1.5 Regional Forecast Through 2024
- 8.2 Cross-Regional Segment Analysis
- 8.2.1 By Distribution Channel
- 8.2.2 By Brand/Price Tier
Chapter 9. North America Deflaker Market
- 9.1 United States
- 9.2 Canada
- 9.3 Mexico
Chapter 10. Europe Deflaker Market
- 10.1 Germany
- 10.2 France
- 10.3 Italy
- 10.4 United Kingdom
- 10.5 Spain
- 10.6 Poland
- 10.7 Russia
- 10.8 Netherlands
- 10.9 Belgium
- 10.10 Sweden
- 10.11 Denmark
- 10.12 Norway
- 10.13 Rest of Europe
Chapter 11. Asia Pacific Deflaker Market
- 11.1 China
- 11.2 India
- 11.3 Japan
- 11.4 South Korea
- 11.5 Thailand
- 11.6 Indonesia
- 11.7 Vietnam
- 11.8 Malaysia
- 11.9 Australia
- 11.10 Rest of Asia Pacific
Chapter 12. Latin America Deflaker Market
- 12.1 Brazil
- 12.2 Argentina
- 12.3 Colombia
- 12.4 Chile
- 12.5 Rest of Latin America
Chapter 13. Middle East Deflaker Market
- 13.1 Saudi Arabia
- 13.2 United Arab Emirates
- 13.3 Turkey
- 13.4 Israel
- 13.5 Iran
- 13.6 Rest of the Middle East
Chapter 14. Africa Deflaker Market
- 14.1 South Africa
- 14.2 Egypt
- 14.3 Nigeria
- 14.4 Morocco
- 14.5 Rest of Africa
Chapter 15. Deflaker Company Profiles
- 15.1 [Company 01]
- 15.1.1 Company Overview
- 15.1.2 Key Management Personnel
- 15.1.3 Products & Services Portfolio
- 15.1.4 Financial Performance
- 15.1.5 Key Market Focus & Geographic Presence
- 15.1.6 Recent Developments & Strategic Initiatives
Note: The company profile list is preliminary and may change based on research findings, market developments, data availability, and client requirements.
Chapter 16. Appendices
- Appendix A – List of Abbreviations & Acronyms
- Appendix B – Industry Classification Code Reference – Full Series
- Appendix C – Production & Capacity Data Tables
- Appendix D – End-Use & Demand Base Tables
- Appendix E – Consumption & Replacement Rate Assumptions
- Appendix F – ASP Reference Tables
- Appendix G – Manufacturing & Facility Database
- Appendix H – Import-Export Data Tables
- Appendix I – Regulatory Summary Tables
- Appendix J – Primary Research Participant List (Anonymized)
- Appendix K – Primary Research Questionnaire Framework
- Appendix L – Data Sources & Bibliography
- Appendix M – Market Size Divergence & Source Comparison
Chapter 17. Research Methodology
- 17.1 Research Framework & Philosophy
- 17.2 Secondary Research – Sources, Hierarchy & Data Extraction
- 17.3 Data Modeling – Bottom-Up & Top-Down Market Sizing
- 17.4 Primary Research – Stakeholder Framework, LOI & Sample Sizes
- 17.5 Forecast Methodology – Regression, Scenario & Sensitivity Analysis
- 17.6 Quality Control – Four-Layer Validation Framework
- 17.7 Limitations & Standard Assumptions
- 17.8 Disclaimer
