
Market Overview
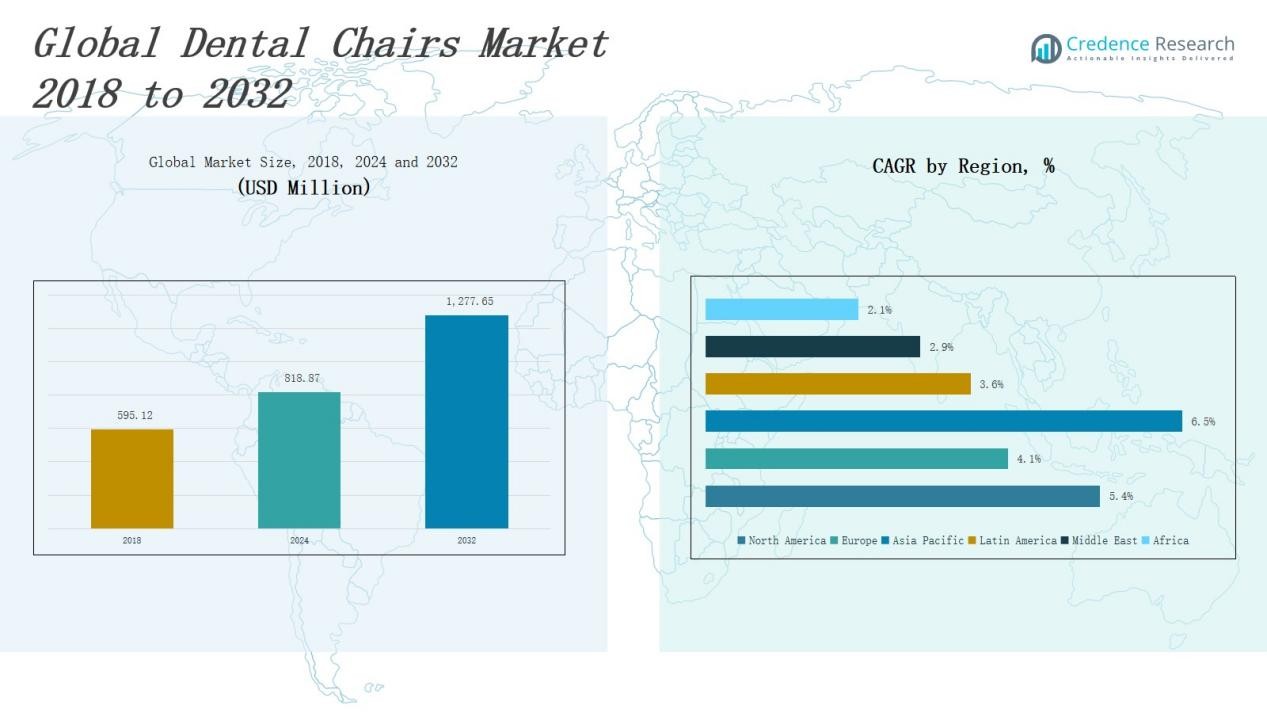
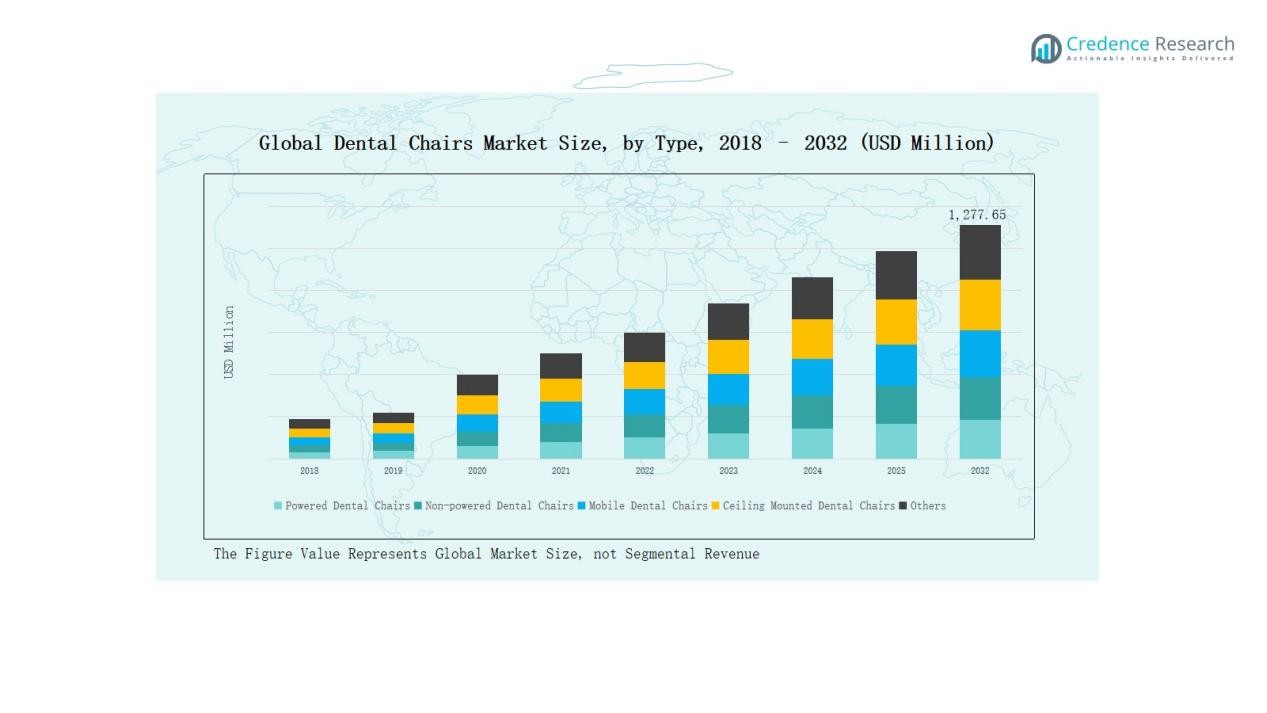
Dental Chairs Market size was valued at USD 595.12 million in 2018 to USD 818.87 million in 2024 and is anticipated to reach USD 1,277.65 million by 2032, at a CAGR of 5.32% during the forecast period.
| REPORT ATTRIBUTE | DETAILS |
|---|---|
| Historical Period | 2020-2024 |
| Base Year | 2024 |
| Forecast Period | 2025-2032 |
| Dental Chairs Market Size 2024 | USD 818.87 Million |
| Dental Chairs Market, CAGR | 5.32% |
| Dental Chairs Market Size 2032 | USD 1,277.65 Million |
The dental chairs market is shaped by leading players such as Dentsply Sirona Inc., A-dec Inc., Planmeca Oy, Midmark Corporation, DentalEZ, XO CARE A/S, Institut Straumann AG, Danaher Corporation, Koninklijke Philips N.V., Craftmaster Contour Equipment Inc., and Summit Dental Systems, LLC. These companies maintain strong competitive positions through innovation in powered dental chairs, integration of digital technologies, and global distribution networks. While regional manufacturers focus on cost-effective solutions for emerging economies, global leaders emphasize ergonomics, patient comfort, and advanced functionalities. Geographically, North America emerged as the leading region in 2024 with a 37% market share, driven by advanced healthcare infrastructure, high oral care awareness, and widespread adoption of technologically advanced dental chairs across clinics and hospitals.
Market Insights
- The Dental Chairs Market grew from USD 595.12 million in 2018 to USD 818.87 million in 2024, projected at USD 1,277.65 million by 2032.
- Powered dental chairs led with 58% share in 2024, driven by digital integration, advanced ergonomics, and widespread adoption in modern dental practices.
- By application, surgery dominated with 46% share in 2024, supported by rising demand for implantology and restorative procedures across developed and emerging markets.
- Dental clinics held 62% share in 2024, fueled by expanding independent practices, multi-chair specialty centers, and growing focus on patient comfort and efficiency.
- North America led with 37% share in 2024, followed by Asia Pacific at 26%, highlighting advanced infrastructure and rising adoption of powered dental chairs.
Market Segment Insights
By Type
Powered dental chairs dominated the market with nearly 58% share in 2024, driven by rising adoption in modern dental practices. Their advanced ergonomics, automated adjustments, and integration with digital diagnostic tools enhance patient comfort and treatment efficiency. Non-powered dental chairs accounted for 22% share, serving cost-sensitive clinics in developing regions. Mobile dental chairs held around 8%, primarily supporting outreach programs and portable dental units. Ceiling-mounted chairs and other specialized formats collectively represented the remaining 12%, driven by demand in high-volume surgical environments.
- For instance, A-dec’s 500 Series dental chair integrates pressure-mapped cushioning and dynamic movement that automatically adjusts to patient posture, improving ergonomics during long procedures.
By Application
The surgery segment led with 46% share in 2024, reflecting the growing need for advanced chairs in complex dental procedures such as implantology and restorative treatments. Examination applications accounted for 28%, supported by routine check-ups and preventive dental care demand. Orthodontics contributed 18%, fueled by rising cases of malocclusion and adoption of aesthetic braces among young populations. The remaining 8% share came from other applications, including cosmetic dentistry, where comfort and adjustability remain key drivers.
- For instance, Dentsply Sirona's higher-end, digitally connected treatment centers are equipped with integrated implantology functions, allowing clinicians to perform complex surgical procedures.
By End User
Dental clinics dominated the market with 62% share in 2024, supported by the global rise in independent practices and multi-chair specialty centers. Hospitals followed with 27% share, driven by growing integration of dental departments in multi-specialty healthcare institutions. The remaining 11% share came from other end users such as academic institutes, military facilities, and mobile dental units, where the focus is on training, outreach, and community oral health programs.
- For instance, Cleveland Clinic operates a dedicated Dental Medicine department that provides advanced maxillofacial prosthodontics and oral surgery services, enabling comprehensive patient care within its broader healthcare system.
Key Growth Drivers
Rising Demand for Advanced Dental Care
The growing prevalence of oral diseases and rising awareness of preventive dental care are fueling demand for advanced dental chairs. Patients seek greater comfort during procedures, and clinics respond with chairs featuring improved ergonomics, hygiene standards, and digital integration. Urbanization and rising disposable incomes further accelerate adoption, particularly in developing markets where dental care accessibility is improving. These factors collectively support steady growth and widespread acceptance of technologically advanced dental chairs across diverse regions.
Technological Advancements in Dental Equipment
Continuous innovations in dental chairs, including integration of electric controls, memory functions, and diagnostic compatibility, significantly drive market growth. Features such as patient-position memory, real-time imaging integration, and seamless connectivity with dental instruments enhance workflow efficiency for practitioners. Smart upholstery materials and infection control features also support hygiene compliance. These innovations not only improve patient experience but also enhance treatment accuracy, pushing clinics and hospitals to increasingly replace outdated models with modern, fully digital chairs.
- For instance, The Planmeca Compact i5 dental unit and the Planmeca ProX intraoral X-ray unit are separate pieces of equipment that can be used together in a dental operatory for a streamlined workflow, but the X-ray unit is not integrated directly into the chair system.
Expansion of Dental Clinics and Specialty Practices
The rapid expansion of dental clinics and specialty care centers worldwide is a major driver for dental chair demand. Increased private investment in dental infrastructure, coupled with supportive healthcare policies, fuels the establishment of advanced treatment centers. Multi-chair clinics, orthodontic centers, and cosmetic dentistry practices require reliable and efficient dental chairs to serve growing patient volumes. This expansion strengthens market penetration, particularly in emerging economies, where rising healthcare spending and professional training are creating favorable conditions for adoption.
- For instance, Aspen Dental (U.S.), one of the largest dental support organizations, manages more than 1,000 clinics nationwide, each designed with multiple dental chair setups to handle high treatment throughput.
Key Trends & Opportunities
Growing Adoption of Ergonomic and Patient-Centric Designs
A significant trend in the dental chairs market is the shift toward ergonomic, patient-friendly designs. Chairs offering enhanced adjustability, cushioning, and noise reduction improve patient comfort during lengthy treatments. Manufacturers are introducing lightweight, durable materials and customizable features tailored to specific applications such as surgery or orthodontics. This trend provides opportunities for players to differentiate products, targeting clinics that prioritize patient satisfaction and retention. Demand for ergonomic solutions is expected to increase as dental care becomes more specialized and patient-centric.
- For instance, The Anya AY-A4800 is a patient chair. Features like adjustable tilt and armrests are designed to position the patient optimally for the dentist, not to provide ergonomic support for the practitioner during a procedure.
Rising Demand in Emerging Markets
Emerging economies present significant opportunities due to expanding healthcare infrastructure and increasing dental awareness. Countries in Asia-Pacific, Latin America, and Africa are witnessing rising dental treatment volumes driven by urbanization and lifestyle changes. Governments and private investors are actively funding oral health programs, creating demand for cost-effective and durable dental chairs. This shift enables manufacturers to capture untapped markets by offering tailored solutions. Growth in these regions is further supported by the rising number of trained professionals and affordable financing options for dental equipment.
- For nistance, Henry Schein announced in 2023 an extension of its partnership with the Dental Trade Alliance Foundation to supply affordable equipment to training programs in Kenya and South Africa, supporting the rising number of trained professionals.
Key Challenges
High Initial Costs and Maintenance Expenses
One of the primary challenges is the high initial investment required for powered and technologically advanced dental chairs. Smaller clinics and practices in developing markets often face financial constraints, making affordability a barrier. Additionally, ongoing maintenance costs, repair expenses, and the need for regular upgrades increase the total cost of ownership. This creates hesitation among practitioners with limited budgets, slowing market penetration of premium solutions despite their efficiency and long-term benefits.
Limited Access in Rural and Low-Income Regions
Access to dental chairs remains restricted in rural and low-income regions due to poor infrastructure and limited healthcare funding. Many regions continue to rely on basic, non-powered chairs or mobile units, which lack advanced functionality. This gap hampers equitable access to quality dental care and prevents widespread adoption of modern dental chairs. Addressing this challenge requires innovative business models, government-backed programs, and affordable product lines designed specifically for underserved markets.
Intense Market Competition and Pricing Pressure
The dental chairs market faces strong competition from global and regional players, leading to pricing pressure. While established companies invest heavily in advanced features, local manufacturers often compete by offering cost-effective alternatives. This intensifies competition and narrows profit margins, particularly in emerging economies. For global players, balancing innovation with affordability remains critical. Sustaining differentiation through quality, service support, and technological edge is essential to overcome pricing challenges and secure long-term market growth.
Regional Analysis
North America
North America led the dental chairs market with a 37% share in 2024, valued at USD 354.51 million. Strong healthcare infrastructure, advanced dental technologies, and high awareness of oral care drive demand across the U.S., Canada, and Mexico. The region benefits from widespread adoption of powered dental chairs in multi-specialty clinics and hospitals. Favorable insurance coverage and growing demand for cosmetic dentistry further accelerate growth. With a CAGR of 5.4%, the market is projected to reach USD 554.65 million by 2032, maintaining its leadership position globally.
Europe
Europe accounted for a 15% market share in 2024, with a market value of USD 148.31 million. Growth is supported by advanced dental infrastructure, particularly in Germany, France, and the UK, where high dental awareness drives adoption of ergonomic chairs. The region also benefits from strong public healthcare systems that integrate preventive dental care. However, slower population growth and cost sensitivity in Eastern Europe moderate expansion. Europe is forecast to reach USD 210.96 million by 2032, growing at a CAGR of 4.1%, sustaining steady but comparatively modest progress.
Asia Pacific
Asia Pacific captured a 26% share in 2024, valued at USD 247.69 million, and is the fastest-growing regional market with a CAGR of 6.5%. Rising dental awareness, increasing disposable incomes, and rapid expansion of private clinics in China, India, and Southeast Asia are driving adoption. Government initiatives to expand oral healthcare access further boost demand for cost-effective yet advanced dental chairs. With growing investments in healthcare infrastructure, the market is projected to reach USD 421.78 million by 2032, positioning Asia Pacific as a key growth hub in the global landscape.
Latin America
Latin America held a 4% market share in 2024, valued at USD 35.74 million. Brazil dominates the region with its large network of dental professionals and strong demand for cosmetic and preventive treatments. However, economic fluctuations and limited healthcare access in several countries constrain wider adoption. Rising private investments in clinics and outreach programs are gradually improving infrastructure. The market is projected to reach USD 48.92 million by 2032 at a CAGR of 3.6%, indicating steady but moderate growth compared to other regions.
Middle East
The Middle East accounted for a 2% share in 2024, with a market size of USD 19.60 million. GCC countries, particularly Saudi Arabia and the UAE, drive demand due to expanding dental tourism and modern healthcare facilities. Investments in advanced clinics and cosmetic dentistry support growth, while other countries face slower adoption due to cost barriers. The region is expected to reach USD 25.47 million by 2032 at a CAGR of 2.9%, reflecting selective growth in wealthier markets with premium care demand.
Africa
Africa represented a 1% market share in 2024, with a value of USD 13.02 million. The market faces challenges from limited infrastructure, low affordability, and a shortage of trained professionals, which restrict the use of advanced dental chairs. However, countries like South Africa and Egypt are showing gradual improvements, supported by urban expansion and international healthcare aid. With a CAGR of 2.1%, the market is projected to reach USD 15.87 million by 2032, but widespread adoption will remain constrained compared to other regions.
Market Segmentations:
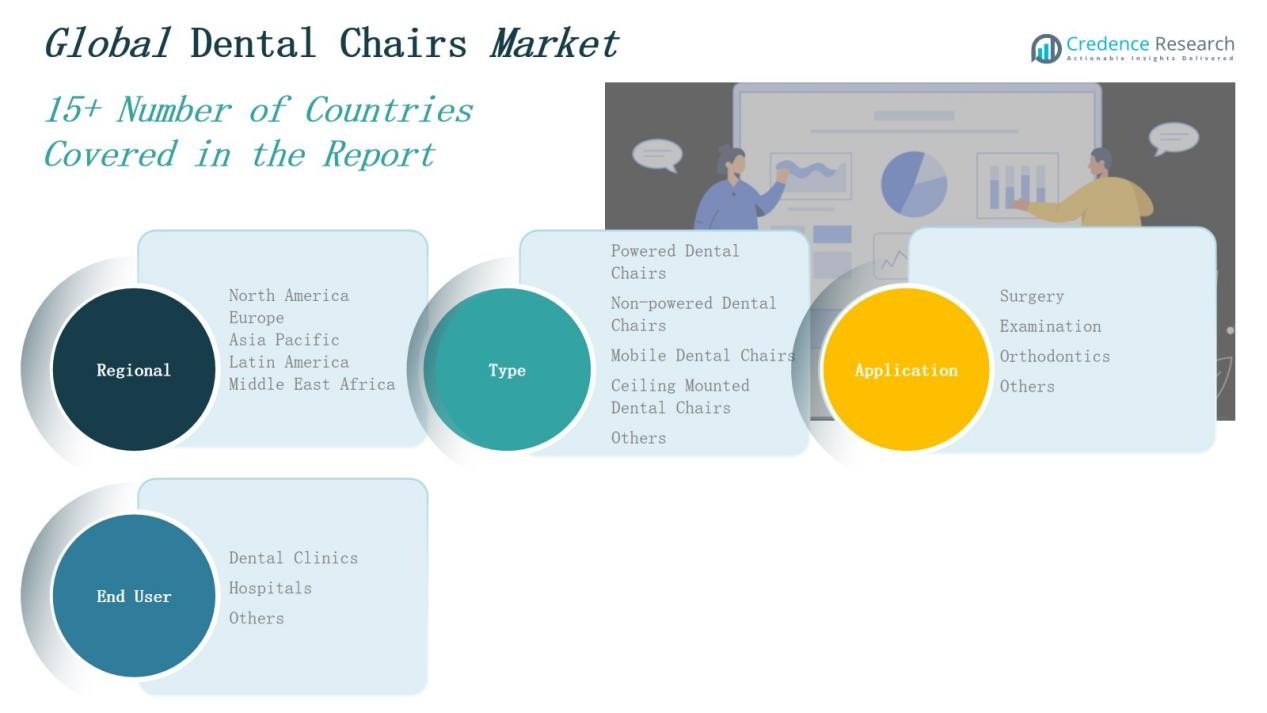
By Type
- Powered Dental Chairs
- Non-powered Dental Chairs
- Mobile Dental Chairs
- Ceiling Mounted Dental Chairs
- Others
By Application
- Surgery
- Examination
- Orthodontics
- Others
By End User
- Dental Clinics
- Hospitals
- Others
By Region
- North America(U.S., Canada, Mexico)
- Europe(UK, France, Germany, Italy, Spain, Russia, Rest of Europe)
- Asia Pacific(China, Japan, South Korea, India, Australia, Southeast Asia, Rest of Asia Pacific)
- Latin America(Brazil, Argentina, Rest of Latin America)
- Middle East(GCC Countries, Israel, Turkey, Rest of Middle East)
- Africa(South Africa, Egypt, Rest of Africa)
Competitive Landscape
The dental chairs market is moderately consolidated, with leading players focusing on product innovation, ergonomic design, and integration of advanced technologies to strengthen their positions. Companies such as Dentsply Sirona, A-dec, Planmeca, and Midmark dominate with broad product portfolios, strong distribution networks, and global reach. These players invest heavily in R&D to introduce powered chairs with digital controls, memory functions, and enhanced patient comfort features, catering to premium healthcare facilities. Regional manufacturers, including DentalEZ, XO CARE, and Summit Dental Systems, compete through cost-effective solutions tailored for small and mid-sized practices. Strategic partnerships, mergers, and acquisitions are shaping competition, as firms seek to expand geographic presence and service capabilities. Moreover, rising demand in emerging economies creates opportunities for local players offering affordable alternatives. Intense pricing pressure, however, pushes companies to differentiate through after-sales service, training support, and integrated treatment solutions. This dynamic competition is driving continuous innovation across the market.
Key Players
- Dentsply Sirona Inc.
- A-dec Inc.
- Planmeca Oy
- Midmark Corporation
- DentalEZ, Inc.
- XO CARE A/S
- Institut Straumann AG
- Danaher Corporation
- Koninklijke Philips N.V.
- Craftmaster Contour Equipment Inc.
- Summit Dental Systems, LLC
Recent Developments
- In June 2023, A-dec, Inc. launched the A-dec 500 Pro and A-dec 300 Pro platforms, the first digitally connected delivery systems designed to help doctors and dental practices with equipment connectivity.
- In April 2023, Henry Schein acquired Biotech Dental S.A.S., a provider of dental implants, dental software, and clear aligners, to improve clinical outcomes through expanded product offerings.
- In June 2023, A-dec also launched its first digitally connected dental chair and delivery system for seamless dental practice operation.
- In March 2024, XO CARE A/S introduced new color options for their dental patient chairs, focusing on customization and aesthetics in dental clinics
Report Coverage
The research report offers an in-depth analysis based on Type, Application, End User and Region. It details leading market players, providing an overview of their business, product offerings, investments, revenue streams, and key applications. Additionally, the report includes insights into the competitive environment, SWOT analysis, current market trends, as well as the primary drivers and constraints. Furthermore, it discusses various factors that have driven market expansion in recent years. The report also explores market dynamics, regulatory scenarios, and technological advancements that are shaping the industry. It assesses the impact of external factors and global economic changes on market growth. Lastly, it provides strategic recommendations for new entrants and established companies to navigate the complexities of the market.
Future Outlook
- Powered dental chairs will see rising adoption as digital dentistry enhances precision and treatment efficiency.
- Patient-centric ergonomic designs will dominate, ensuring comfort and reducing fatigue during long dental care procedures.
- Integration of smart controls, imaging compatibility, and automated adjustments will drive widespread equipment replacement demand.
- Expanding dental infrastructure in emerging economies will create significant opportunities for advanced and affordable chair adoption.
- Growing cosmetic dentistry demand will boost adoption of technologically advanced chairs offering superior precision and aesthetics.
- Mobile dental chairs will expand usage in outreach programs, rural healthcare, and portable treatment settings.
- Hospitals will increasingly invest in multi-chair dental units to support specialized oral healthcare departments.
- Local manufacturers will expand share in developing markets by offering durable and cost-effective dental chairs.
- Mergers, acquisitions, and collaborations among key players will reshape competition and strengthen global market presence.
- Eco-friendly materials and sustainable designs will emerge as critical differentiators in future dental chair innovations.
Request a Free Sample
Fill in your details and we'll send you a free sample report.
- Sample data tables & charts
- Research methodology
Need a Custom Version of This Report?
Tailor the scope, geography, or segments to your exact requirements.
- Custom geography or segment scope
- Direct access to our analyst team
Frequently Asked Questions
What is the current market size for the Dental Chairs Market, and what is its projected size in 2032?
At what Compound Annual Growth Rate is the Dental Chairs Market projected to grow between 2025 and 2032?
Which Dental Chairs Market segment held the largest share in 2024?
What are the primary factors fueling the growth of the Dental Chairs Market?
Who are the leading companies in the Dental Chairs Market?
Which region commanded the largest share of the Dental Chairs Market in 2024?
Table of Content
Chapter 1. Report Introduction
- 1.1 Report Description & Purpose
- 1.1.1 Report Title & Market Definition
- 1.1.2 Unique Selling Propositions (USP) & Key Differentiators
- 1.1.3 Value Proposition for Stakeholders
- 1.2 Research Objectives
- 1.2.1 Market Sizing Objectives (Volume & Revenue) (Volume Where Applicable)
- 1.2.2 Segmentation Objectives
- 1.2.3 Competitive Intelligence Objectives
- 1.2.4 Forecast & Scenario Objectives
- 1.3 Report Scope
- 1.3.1 Dental Chair Scope – Segments & Subsegments Covered
- 1.3.2 Geographic Scope – Regions & Countries Covered
- 1.3.3 Historical Period, Base Year & Forecast Period (2024; forecast to 2032)
- 1.3.4 Inclusions & Exclusions
- 1.4 Industry Classification & Applicable Codes
- 1.5 Currency, Measurement Units & Valuation Basis
- 1.6 Target Stakeholders
- 1.7 Limitations & Assumptions
Chapter 2. Executive Summary
- 2.1 Global Dental Chair Market Snapshot
- 2.1.1 Market Size – Historical (2024) & Forecast (2024-2032) (2024: USD 818.87 million → 2032: USD 1,225.39 million)
- 2.1.2 Volume & Revenue – Global Totals (Volume Where Applicable)
- 2.1.3 Key Market Highlights – Top Five Facts
- 2.2 Dental Chair Market Segmentation Snapshot
- 2.2.1 Market Split by Region – 2024 vs. 2032
- 2.3 Competitive Snapshot
- 2.3.1 Top 10 Players by Revenue Share – 2024
- 2.3.2 Top 10 Players by Volume Share – 2024 (Volume Where Applicable)
- 2.3.3 Recent Strategic Developments (18-Month Summary)
- 2.4 Key Investment Highlights & Strategic Conclusions
Chapter 3. Dental Chair Market Dynamics & Industry Analysis
- 3.1 Market Overview & Context
- 3.1.1 Dental Chair Market Position in the Broader Industry Value Chain
- 3.1.2 Demand Structure & Purchasing Dynamics
- 3.1.3 Market Maturity & Development Stage by Region
- 3.2 Dental Chair Market Drivers
- 3.3 Dental Chair Market Restraints & Challenges
- 3.4 Dental Chair Market Opportunities
- 3.5 Porter's Five Forces Analysis
- 3.5.1 Threat of New Entrants
- 3.5.2 Bargaining Power of Suppliers
- 3.5.3 Bargaining Power of Buyers
- 3.5.4 Threat of Substitutes
- 3.5.5 Competitive Rivalry – Intensity Assessment
- 3.6 Dental Chair Value Chain Analysis
- 3.6.1 Upstream – Key Inputs, Resources & Suppliers
- 3.6.1.1 Key Input/Resource 1
- 3.6.1.2 Key Input/Resource 2
- 3.6.1.3 Key Input/Resource 3
- 3.6.2 Midstream – Core Operations & Value Creation
- 3.6.2.1 Operating Model & Process Overview
- 3.6.2.2 Key Operating Locations & Capabilities by Company
- 3.6.3 Downstream – Market Channels & End Users
- 3.6.3.1 Direct Sales & Customer Engagement Channels
- 3.6.3.2 Indirect Sales, Intermediaries & Partner Channels
- 3.6.4 Value Chain Profitability Analysis
- 3.6.1 Upstream – Key Inputs, Resources & Suppliers
- 3.7 PESTEL Analysis
- 3.7.1 Political Factors
- 3.7.2 Economic Factors
- 3.7.3 Social Factors
- 3.7.4 Technological Factors
- 3.7.5 Environmental Factors
- 3.7.6 Legal Factors
- 3.8 Dental Chair Supply Chain Analysis
- 3.8.1 Critical Input & Resource Availability Risk Assessment
- 3.8.2 Supplier & Operational Concentration Risk (Geographic Exposure)
- 3.8.3 Supply & Service Disruption Impact Analysis
- 3.9 Regulatory & Policy Landscape
Note: The regulatory and policy landscape section covers regulations based on their applicability to the market, Dental Chair category, geography, and scope of the study. Only regulatory frameworks with a material impact on operations, compliance, trade, sustainability, or market access are analyzed in detail.
Chapter 4. Key Investment Pockets & Opportunity Analysis
- 4.1 Dental Chair Market Attractiveness Analysis
- 4.1.1 By Region – Investment Attractiveness Matrix (Market Size × CAGR)
- 4.2 Absolute Revenue Growth Opportunity
- 4.2.1 By Region – Absolute Revenue Growth Through 2032
- 4.3 Incremental Demand Opportunity
- 4.3.1 By Region – Incremental Demand Through 2032
- 4.3.2 Segment – Incremental Demand
- 4.4 Emerging Submarket Opportunity Deep Dive (Subject to Applicability)
- 4.5 Priority Market Opportunity Scorecards
- 4.5.1 United States
- 4.5.2 Europe
- 4.5.3 Asia
- 4.5.4 Middle East & Africa
Note: Priority market opportunity scorecards reflect the geographic scope and strategic relevance of the study. Listed markets are indicative and may be adapted to the industry.
Chapter 5. Dental Chair Cross-Border Trade & Market Access Analysis
- 5.1 International Trade & Cross-Border Activity Overview
- 5.1.1 Global Export Value by Country (2024)
- 5.1.2 Global Export Volume by Country (2024) (Volume Where Applicable)
- 5.1.3 Global Import Value by Country (2024)
- 5.1.4 Global Import Volume by Country (2024) (Volume Where Applicable)
- 5.1.5 Net Trade Balance by Country (2024)
- 5.2 Export Analysis – Segment
- 5.2.1 Category 1 (Applicable Classification Code)
- 5.2.2 Category 2 (Applicable Classification Code)
- 5.2.3 Category 3 (Applicable Classification Code)
- 5.2.4 Category 4 (Applicable Classification Code)
- 5.2.5 Category 5 (Applicable Classification Code)
- 5.3 Import Analysis – Segment
- 5.3.1 Category 1 (Applicable Classification Code)
- 5.3.2 Category 2 (Applicable Classification Code)
- 5.3.3 Category 3 (Applicable Classification Code)
- 5.3.4 Category 4 (Applicable Classification Code)
- 5.3.5 Category 5 (Applicable Classification Code)
- 5.4 Cross-Border Pricing & Transaction Benchmarks
- 5.4.1 Export Pricing – Segment & Country
- 5.4.2 Import Pricing – Segment & Source Country
- 5.4.3 Price Trends (2024)
- 5.5 Key Cross-Border Trade & Delivery Routes
- 5.5.1 Cross-Border Trade/Delivery Route 1
- 5.5.2 Cross-Border Trade/Delivery Route 2
- 5.5.3 Cross-Border Trade/Delivery Route 3
- 5.5.4 Cross-Border Trade/Delivery Route 4
- 5.5.5 Cross-Border Trade/Delivery Route 5
- 5.6 Trade Policy & Market Access Impact Assessment
- 5.6.1 Tariff & Non-Tariff Barriers
- 5.6.2 Regional Trade & Economic Integration Frameworks
- 5.6.3 Bilateral & Multilateral Trade Agreements
- 5.6.4 Cross-Border Operating, Licensing & Localization Requirements
Note: This chapter applies where cross-border trade or delivery is relevant to Dental Chair. Goods, services, and digital offerings are assessed using applicable classifications and transaction measures. Import-export volumes, trade balances, and route analyses are included only where meaningful to the market.
Chapter 6. Competitive Landscape & Company Benchmarking
- 6.1 Dental Chair Market Concentration & Structure
- 6.1.1 Herfindahl-Hirschman Index (HHI) – vs. 2024
- 6.1.2 Leading, Mid-Sized & Emerging Player Structure
- 6.1.3 Global, Regional & Local Player Dynamics
- 6.2 Dental Chair Market Share Analysis – 2024
- 6.2.1 Global Revenue Share by Company
- 6.2.2 Global Volume Share by Company (Volume Where Applicable)
- 6.2.3 Regional Revenue Share
- 6.2.4 Market Share Evolution ( vs. 2024)
- 6.2.5 Company Market Share by Key Segment
- 6.2.6 Company Market Share by Customer Group
- 6.3 Operating Scale, Capacity & Infrastructure Analysis
- 6.3.1 Global Operating Scale & Supply Capacity
- 6.3.2 Resource Utilization & Operating Efficiency
- 6.3.3 Output, Service Delivery & Activity Metrics
- 6.3.4 Operating Footprint & Infrastructure Map
- 6.3.5 Planned Operational & Capacity Expansion
- 6.4 Dental Chair Competitive Benchmarking Matrix
- 6.4.1 Revenue, Growth, Profitability & Operating Metric Comparison
- 6.4.2 Channel Revenue Mix
- 6.4.3 Geographic Revenue Exposure
- 6.4.4 R&D Intensity
- 6.4.5 Sustainability Maturity
- 6.5 Strategic Developments in Dental Chair (Last 24 Months)
- 6.5.1 Mergers, Acquisitions & Divestments
- 6.5.2 New Products, Services & Solutions in Dental Chair
- 6.5.3 Operational & Infrastructure Expansions
- 6.5.4 Strategic Alliances, Joint Ventures & Partnerships
- 6.5.5 Distribution Expansion & Market Entry
- 6.5.6 Sustainability & ESG Initiatives
- 6.6 Competitive Strategy Mapping
- 6.6.1 Leader, Challenger, Follower & Niche Classification
- 6.6.2 Pricing Strategy Comparison
- 6.6.3 Channel Strategy Matrix
Note: Strategic developments are included based on their materiality and the availability of reliable information.
Chapter 7. Global Dental Chair Market – By Sales & Delivery Channel
- 7.1 Segment Overview
- 7.1.1 Volume & Revenue Split by Channel (2024 & 2032) (Volume Where Applicable)
- 7.1.2 Channel Mix Evolution (2024-2032)
Chapter 8. Regional Market Analysis – Global Overview
- 8.1 Global Regional Overview
- 8.1.1 Regional Volume Share (Volume Where Applicable)
- 8.1.2 Regional Revenue Share
- 8.1.3 Regional Volume by Region (Volume Where Applicable)
- 8.1.4 Regional Revenue by Region
- 8.1.5 Regional Forecast Through 2032
- 8.2 Cross-Regional Segment Analysis
- 8.2.1 By Sales & Delivery Channel
- 8.2.2 By Competitive Positioning & Price Tier
Chapter 9. North America Dental Chair Market
- 9.1 United States
- 9.2 Canada
- 9.3 Mexico
Chapter 10. Europe Dental Chair Market
- 10.1 Germany
- 10.2 France
- 10.3 Italy
- 10.4 United Kingdom
- 10.5 Spain
- 10.6 Poland
- 10.7 Russia
- 10.8 Netherlands
- 10.9 Belgium
- 10.10 Sweden
- 10.11 Denmark
- 10.12 Norway
- 10.13 Rest of Europe
Chapter 11. Asia Pacific Dental Chair Market
- 11.1 China
- 11.2 India
- 11.3 Japan
- 11.4 South Korea
- 11.5 Thailand
- 11.6 Indonesia
- 11.7 Vietnam
- 11.8 Malaysia
- 11.9 Australia
- 11.10 Rest of Asia Pacific
Chapter 12. Latin America Dental Chair Market
- 12.1 Brazil
- 12.2 Argentina
- 12.3 Colombia
- 12.4 Chile
- 12.5 Rest of Latin America
Chapter 13. Middle East Dental Chair Market
- 13.1 Saudi Arabia
- 13.2 United Arab Emirates
- 13.3 Turkey
- 13.4 Israel
- 13.5 Iran
- 13.6 Rest of the Middle East
Chapter 14. Africa Dental Chair Market
- 14.1 South Africa
- 14.2 Egypt
- 14.3 Nigeria
- 14.4 Morocco
- 14.5 Rest of Africa
Chapter 15. Dental Chair Company Profiles
- 15.1 [Company 01]
- 15.1.1 Company Overview
- 15.1.2 Key Management Personnel
- 15.1.3 Products & Services Portfolio
- 15.1.4 Financial Performance
- 15.1.5 Key Market Focus & Geographic Presence
- 15.1.6 Recent Developments & Strategic Initiatives
Note: The company profile list is preliminary and may change based on research findings, market developments, data availability, and client requirements.
Chapter 16. Appendices
- Appendix A – List of Abbreviations & Acronyms
- Appendix B – Industry Classification Code Reference – Full Series
- Appendix C – Supply, Output & Operating Capacity Data Tables
- Appendix D – End-Use & Demand Base Tables
- Appendix E – Demand, Adoption & Usage Assumptions
- Appendix F – Pricing & Revenue Metric Reference Tables
- Appendix G – Company Operations & Infrastructure Database
- Appendix H – Cross-Border Trade & Activity Data Tables (Where Applicable)
- Appendix I – Regulatory Summary Tables
- Appendix J – Primary Research Participant List (Anonymized)
- Appendix K – Primary Research Questionnaire Framework
- Appendix L – Data Sources & Bibliography
- Appendix M – Market Size Divergence & Source Comparison
Chapter 17. Research Methodology
- 17.1 Research Framework & Philosophy
- 17.2 Secondary Research – Sources, Hierarchy & Data Extraction
- 17.3 Data Modeling – Bottom-Up & Top-Down Market Sizing
- 17.4 Primary Research – Stakeholder Framework, LOI & Sample Sizes
- 17.5 Forecast Methodology – Regression, Scenario & Sensitivity Analysis
- 17.6 Quality Control – Four-Layer Validation Framework
- 17.7 Limitations & Standard Assumptions
- 17.8 Disclaimer
