Diabetes care devices market shifts toward wearable sensors
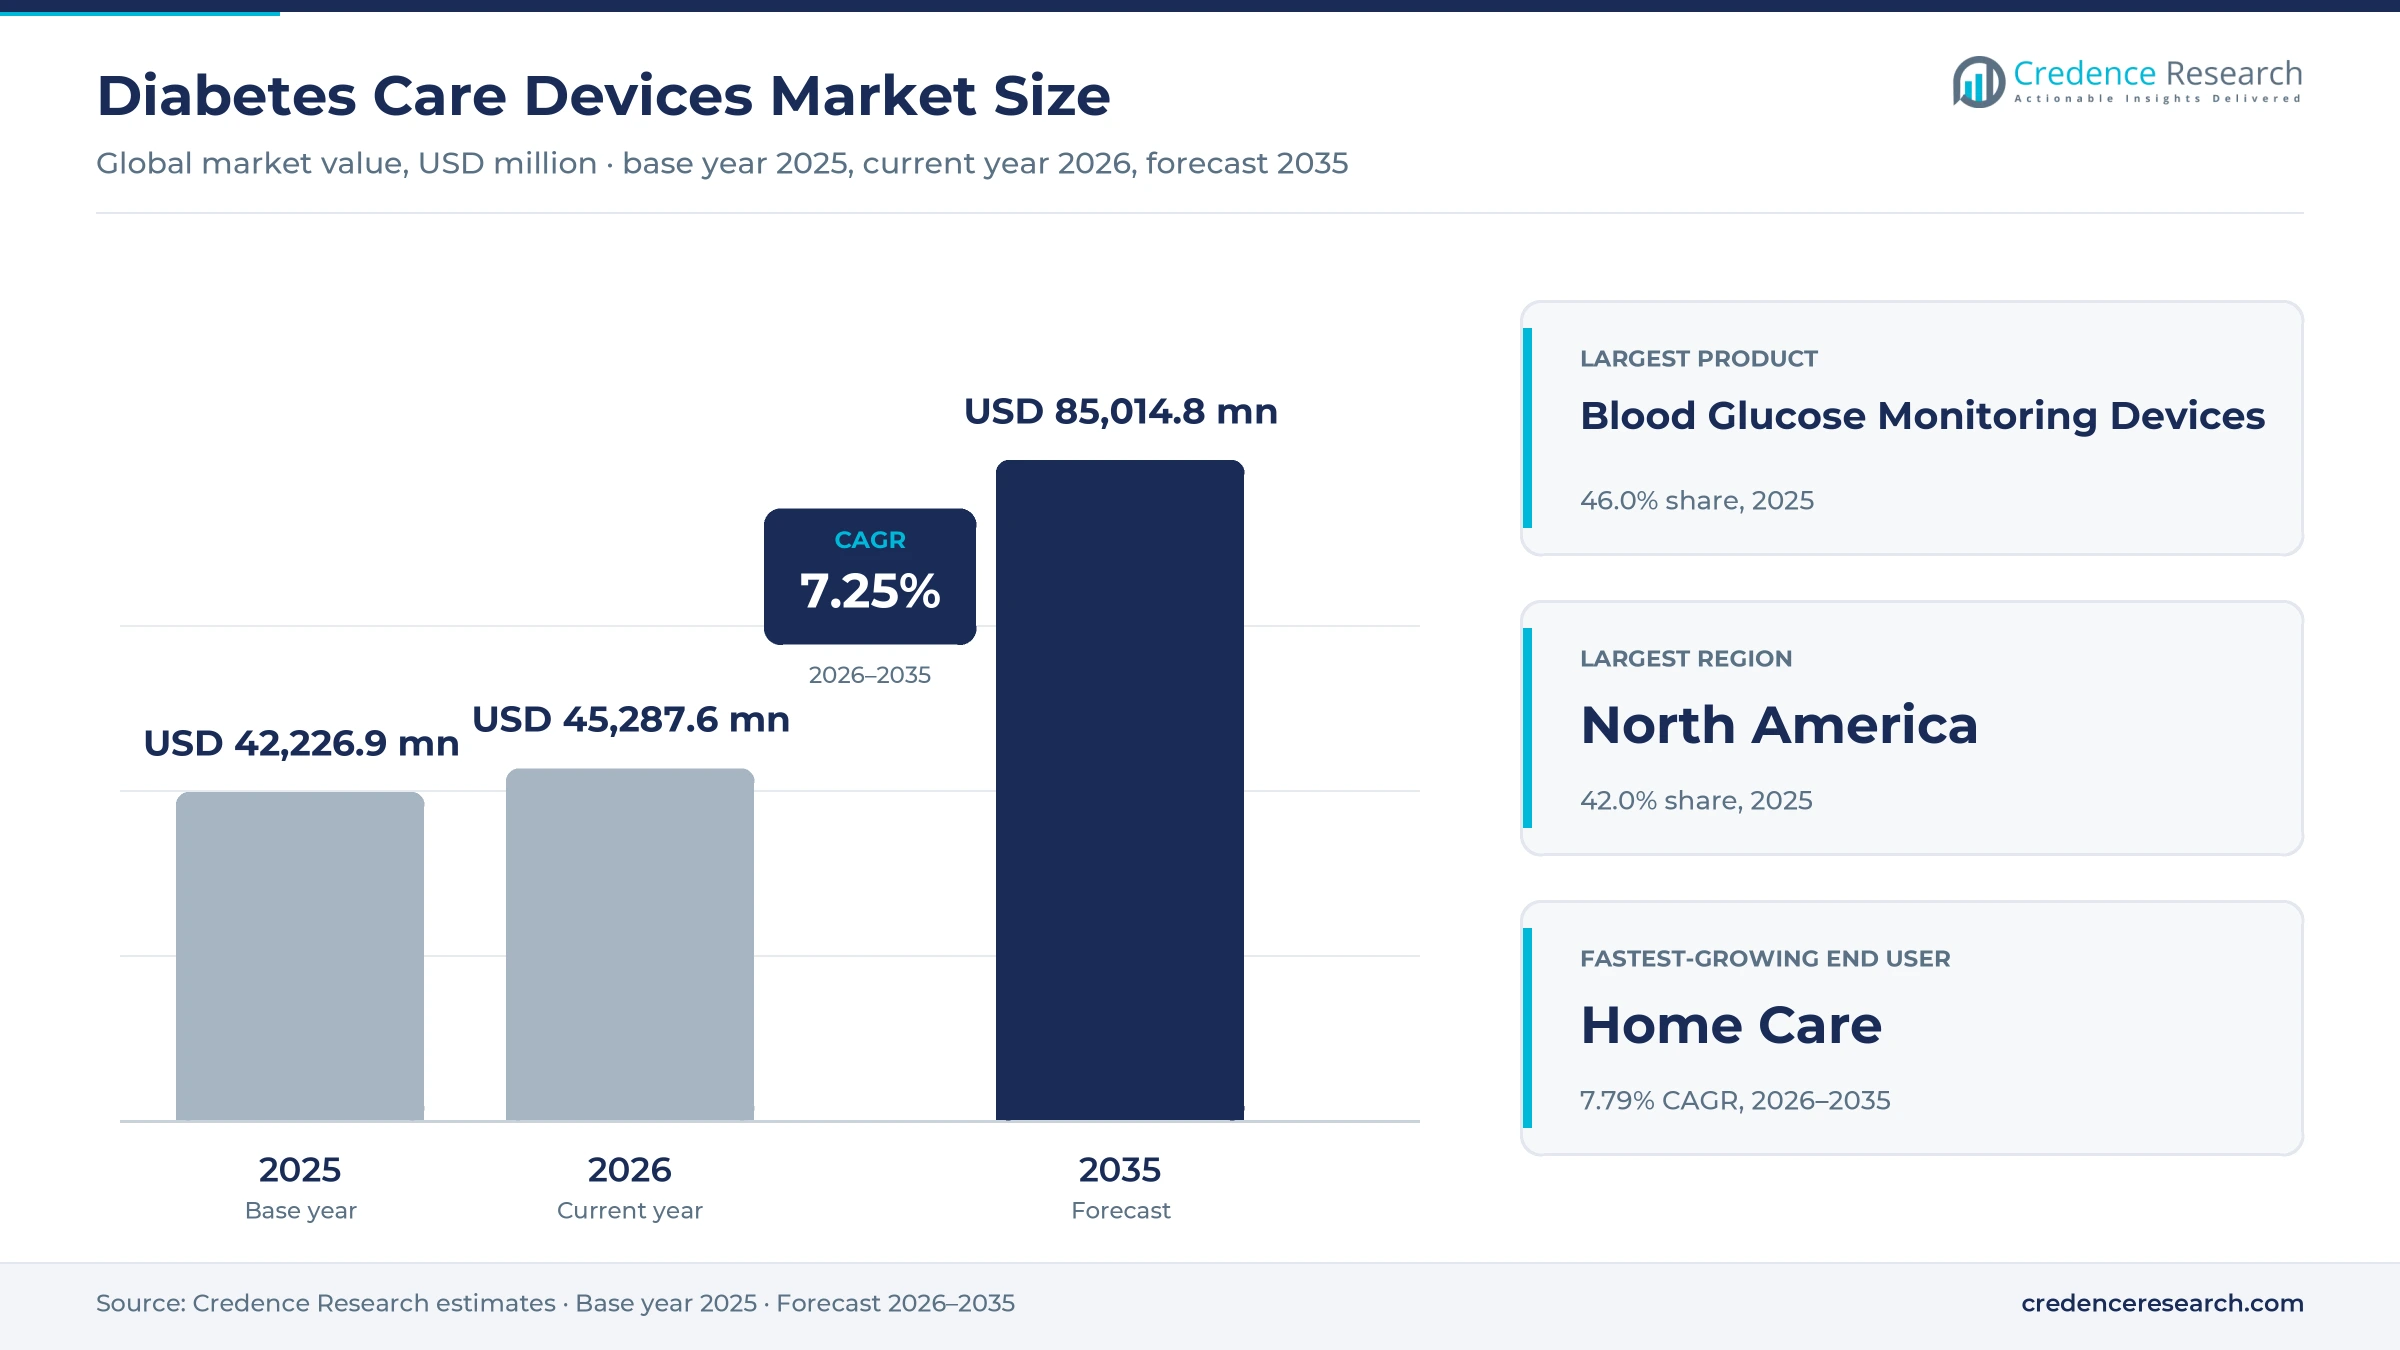
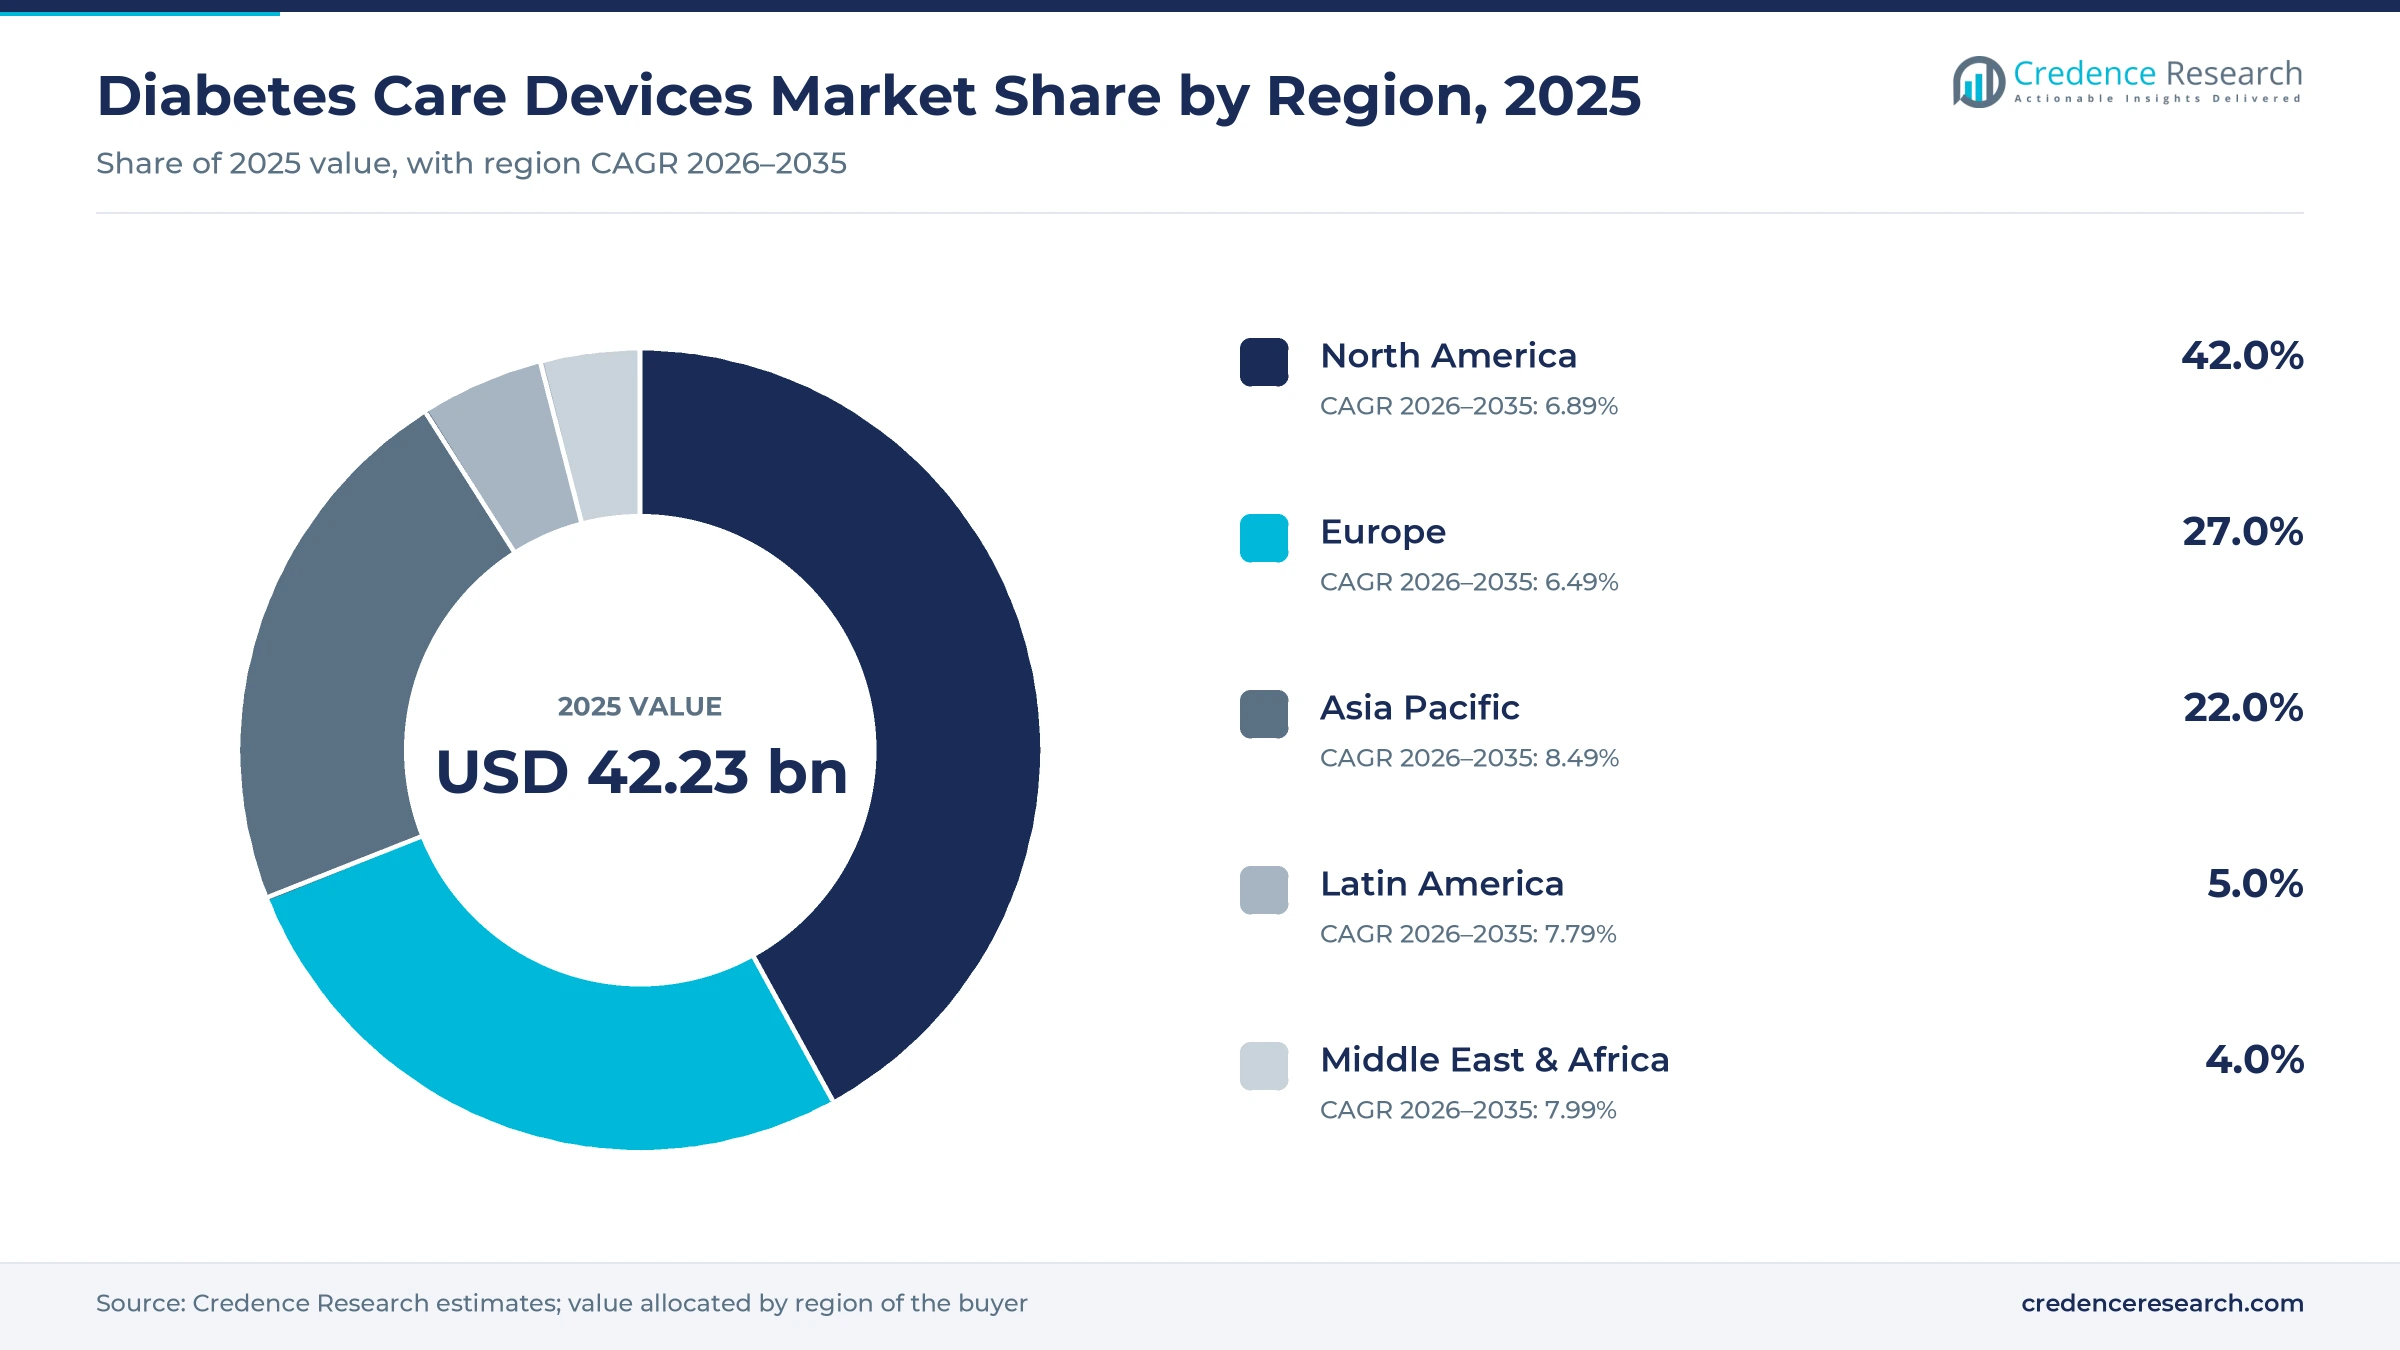
The global diabetes care devices market was valued at USD 42.23 billion in 2025 and is projected to increase from USD 45.29 billion in 2026 to USD 85.01 billion by 2035, registering a CAGR of 7.25% during 2026–2035. Demand comes from a rising number of adults with diabetes, wider use of insulin and a steady move from fingerstick meters to wearable glucose sensors. North America held the largest regional share, 42.0% in 2025, because broad insurance coverage supports continuous glucose monitors and automated insulin pumps. Asia Pacific is the fastest-growing region at 8.49% a year, as China, India and Southeast Asia carry the largest patient populations and expand access to diagnosis. The commercial picture changed in March 2024, when U.S. regulators cleared the first over-the-counter continuous glucose monitor for adults who do not use insulin. As a result, sensor makers can now reach people with type 2 diabetes and prediabetes directly through retail channels.
Which products and care settings does this analysis cover?
The analysis counts blood glucose monitoring devices, including meters and continuous glucose monitors, insulin delivery devices such as pumps and pens, and consumables such as test strips, lancets, pen needles and infusion sets, valued at manufacturer selling prices. Patients buy most products for home use through pharmacies, durable equipment suppliers and online channels, while hospitals and diagnostic centers buy point-of-care meters and testing supplies.
Insulin and other diabetes medicines sit outside the scope of this analysis, as do software apps sold without a device. The value chain runs from sensor and component suppliers through device makers to distributors, pharmacies and payers, which decide coverage and to the clinicians who prescribe each system.
Diabetes Care Devices Market Insights
- The diabetes care devices market grows from USD 42.23 billion in 2025 to USD 85.01 billion by 2035, a 7.25% CAGR as continuous sensors replace fingerstick testing.
- North America held 42.0% of global diabetes device value in 2025, supported by insurance coverage for sensors and automated insulin pumps.
- Blood glucose monitoring devices led product types with 46.0% of 2025 value and grow fastest at 7.76% a year through 2035.
- In March 2024, the FDA cleared Dexcom Stelo as the first over-the-counter continuous glucose monitor, opening retail sales to adults who do not use insulin.
- Dexcom, Abbott, Medtronic and Insulet each won U.S. clearances for new sensors or dosing systems between 2024 and 2025, which intensifies competition in connected care.
Glucose monitoring leads as home use gains ground
Why do glucose monitoring devices lead product spending?
Based on product, the market is categorized into blood glucose monitoring devices, insulin delivery devices and consumables. Blood Glucose Monitoring Devices led with a 46.0% share of 2025 value, because continuous sensors are replaced every one to two weeks and meters remain the entry point for most newly diagnosed patients. This segment also grows fastest at 7.76% a year, as longer-wear sensors and over-the-counter products widen use among people with type 2 diabetes. Consumables such as blood glucose test strips keep large volumes, although sensors take share from them.
How does type 2 diabetes shape device demand?
Based on disease type, the market is categorized into type 1 and type 2 diabetes. The Type 2 segment led with a 62.0% share of 2025 value, because it accounts for most people with diabetes and a large group uses insulin or regular glucose testing. The same segment grows fastest at 7.62% a year, as sensor and pump makers extend labels and coverage to type 2 users. Type 1 patients still use devices more intensively, since nearly all of them depend on insulin from diagnosis.
Why does home care account for most device purchases?
Based on end user, the market is categorized into hospitals, ambulatory surgical centers, diagnostic centers, home care and others. The Home Care segment led with a 58.0% share of 2025 value, because patients test glucose and deliver insulin themselves every day. This segment also grows fastest at 7.79% a year, as connected sensors share data with clinicians remotely. Hospitals remain important buyers of point-of-care meters, which nurses use to manage glucose levels for admitted patients.
| Segment Group | Leading Sub-segment | Share, 2025 | Fastest-growing Sub-segment | CAGR, 2026–2035 |
|---|---|---|---|---|
| By Product | Blood Glucose Monitoring Devices | 46.0% | Blood Glucose Monitoring Devices | 7.76% |
| By Disease Type | Type 2 | 62.0% | Type 2 | 7.62% |
| By End User | Home Care | 58.0% | Home Care | 7.79% |
Request a Free Sample
Fill in your details and we'll send you a free sample report.
- Sample data tables & charts
- Research methodology
Rising diabetes burden and insulin needs lift device use
How does the rising number of adults with diabetes sustain demand?
The growing number of people with diabetes creates the core demand, because every diagnosed patient needs some form of glucose testing. The International Diabetes Federation reported in April 2025 that 589 million adults aged 20 to 79 live with diabetes, a figure projected to reach 853 million by 2050. The same research found that 252 million adults are unaware they have the condition. As a result, screening programs and earlier diagnosis keep adding new meter and sensor users each year.
Why does the large untreated population widen the opportunity?
A large untreated population widens the long-term opportunity, because many people with diabetes still lack medicines and regular monitoring. The World Health Organization reported in November 2024 that almost 450 million adults aged 30 and older, about 59% of adults with diabetes, were untreated in 2022. About 90% of these untreated adults live in low- and middle-income countries. In turn, wider public coverage in these countries would bring large numbers of new users to basic meters and test strips.
How is insulin use among type 2 patients lifting pump demand?
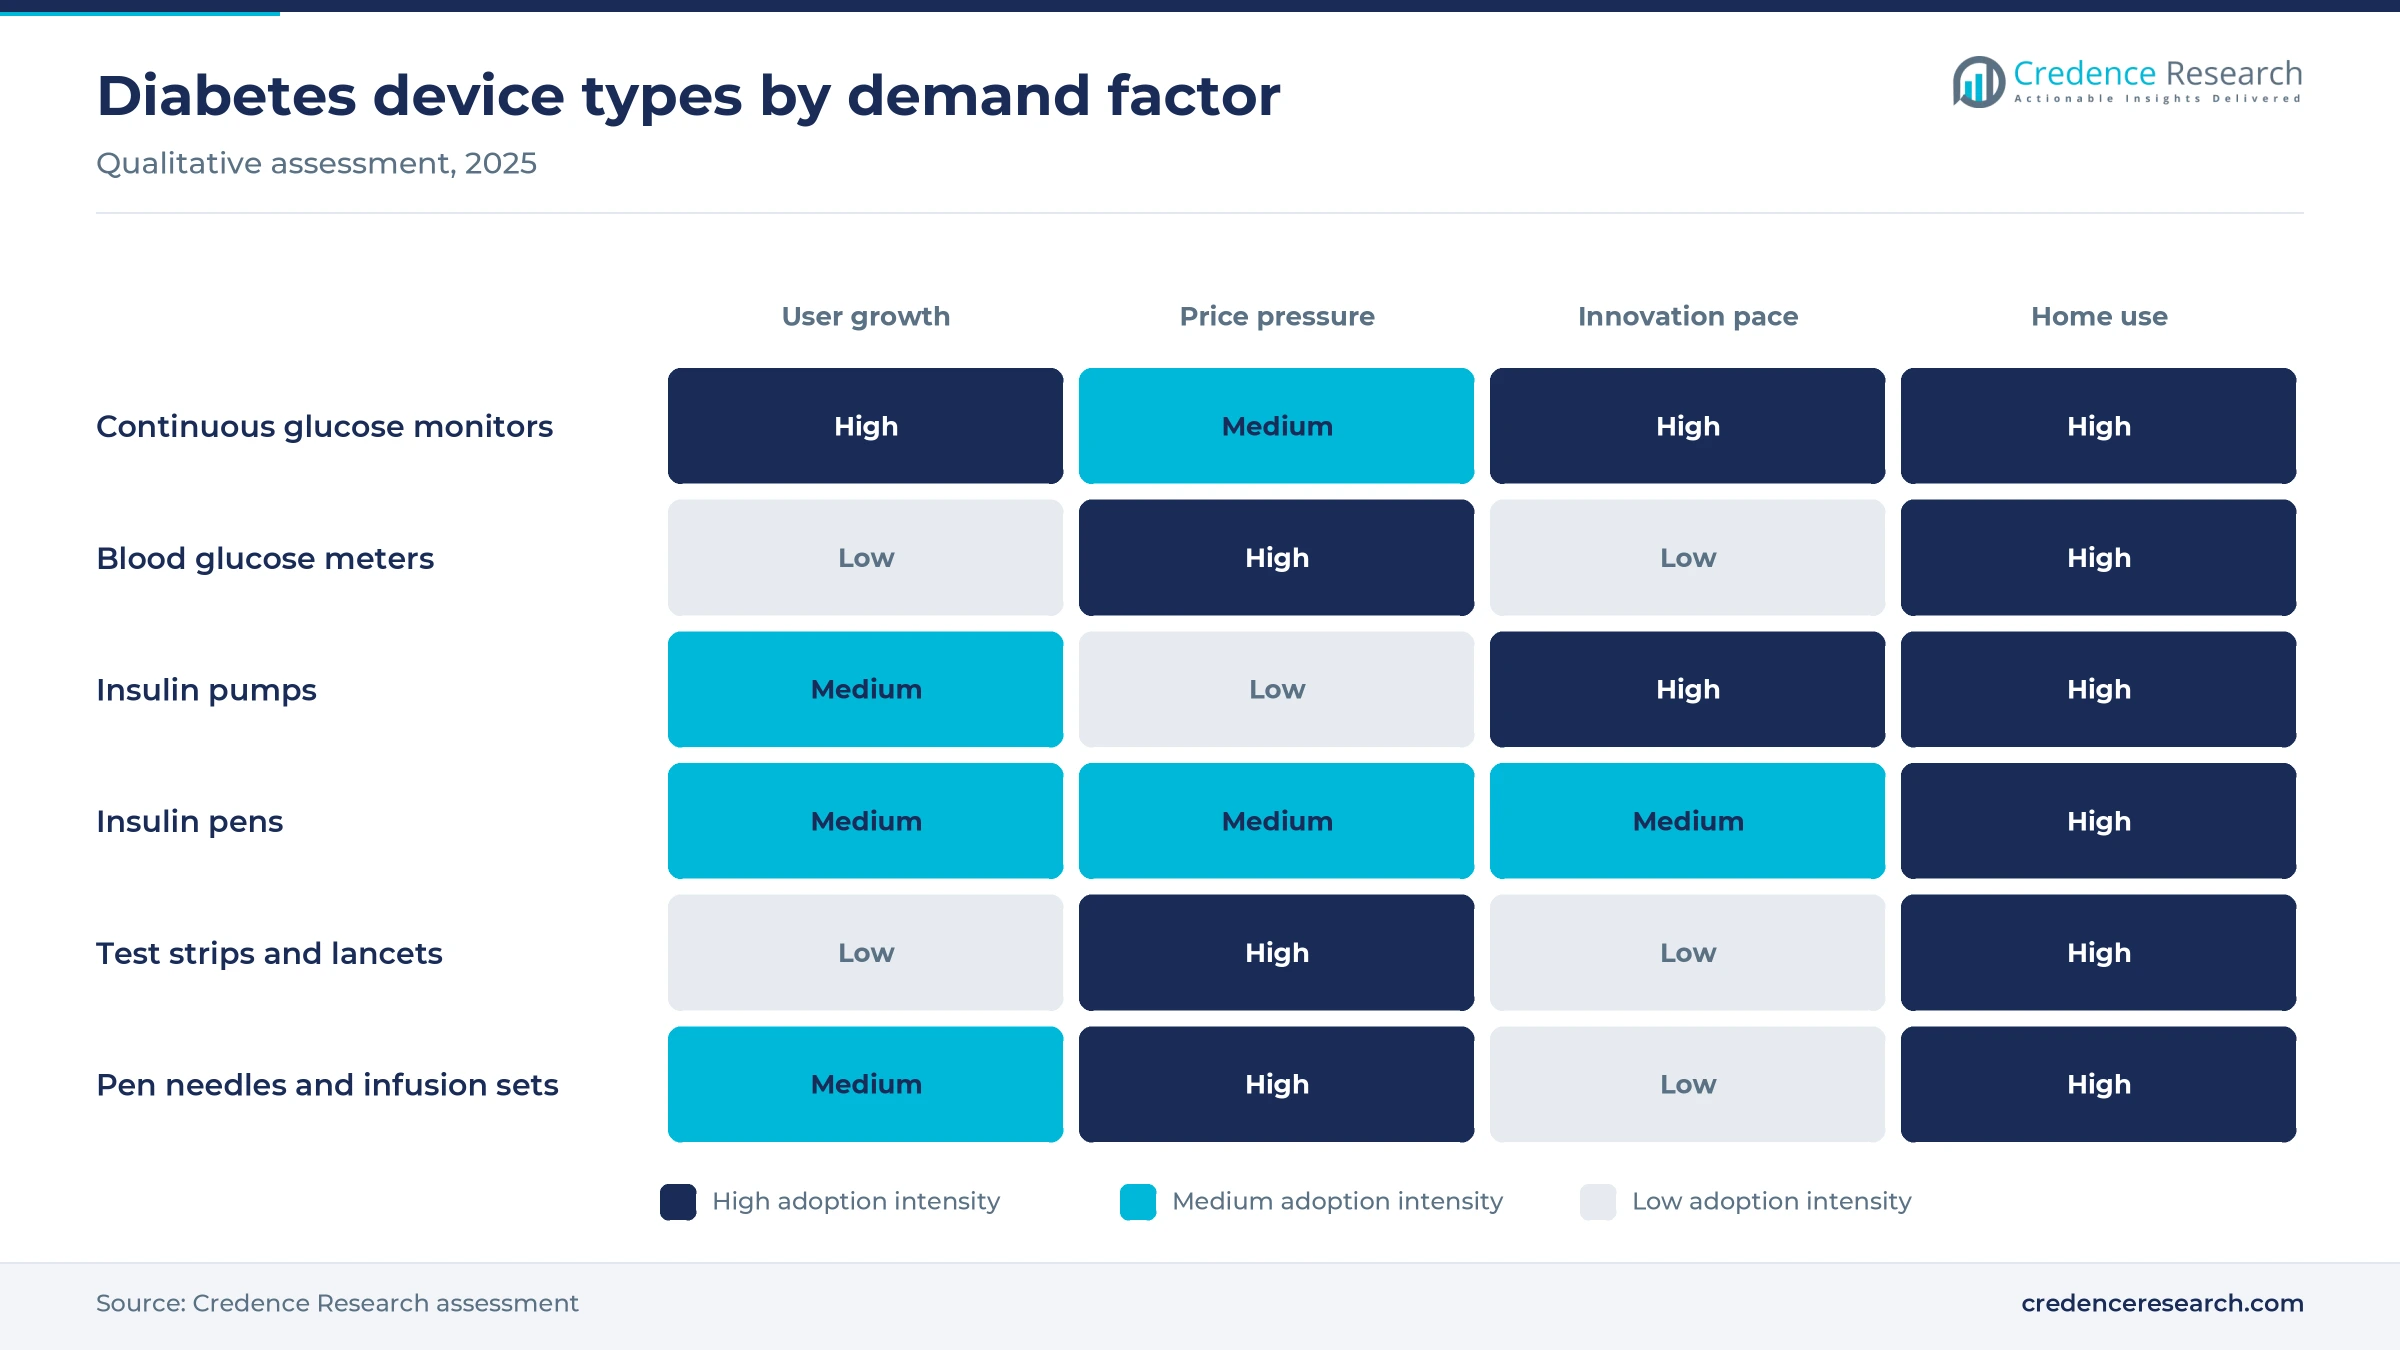
Insulin use among type 2 patients lifts demand for delivery devices, because many people need insulin as the disease progresses. In August 2024, Insulet announced FDA clearance of Omnipod 5 for type 2 diabetes in adults aged 18 and older, and the company estimates that about 6 million people in the United States need insulin for type 2 diabetes. Tubeless patch pumps simplify automated dosing for these users, who often have little pump experience. As a result, pump makers now target a population far larger than type 1 patients alone.
Why does rising diabetes spending support premium devices?
Rising health spending on diabetes supports premium devices, because payers increasingly fund sensors that can reduce emergency visits and complications. The International Diabetes Federation found that diabetes-related health spending surpassed USD 1 trillion in 2024, up from USD 966 billion in 2021. Health systems facing this cost look for tools that improve glucose control between clinic visits. In turn, continuous glucose monitors gain wider coverage, which raises average spending per patient in high-income markets.
Over-the-counter sensors and automated dosing reshape use
How are over-the-counter sensors shifting retail demand?
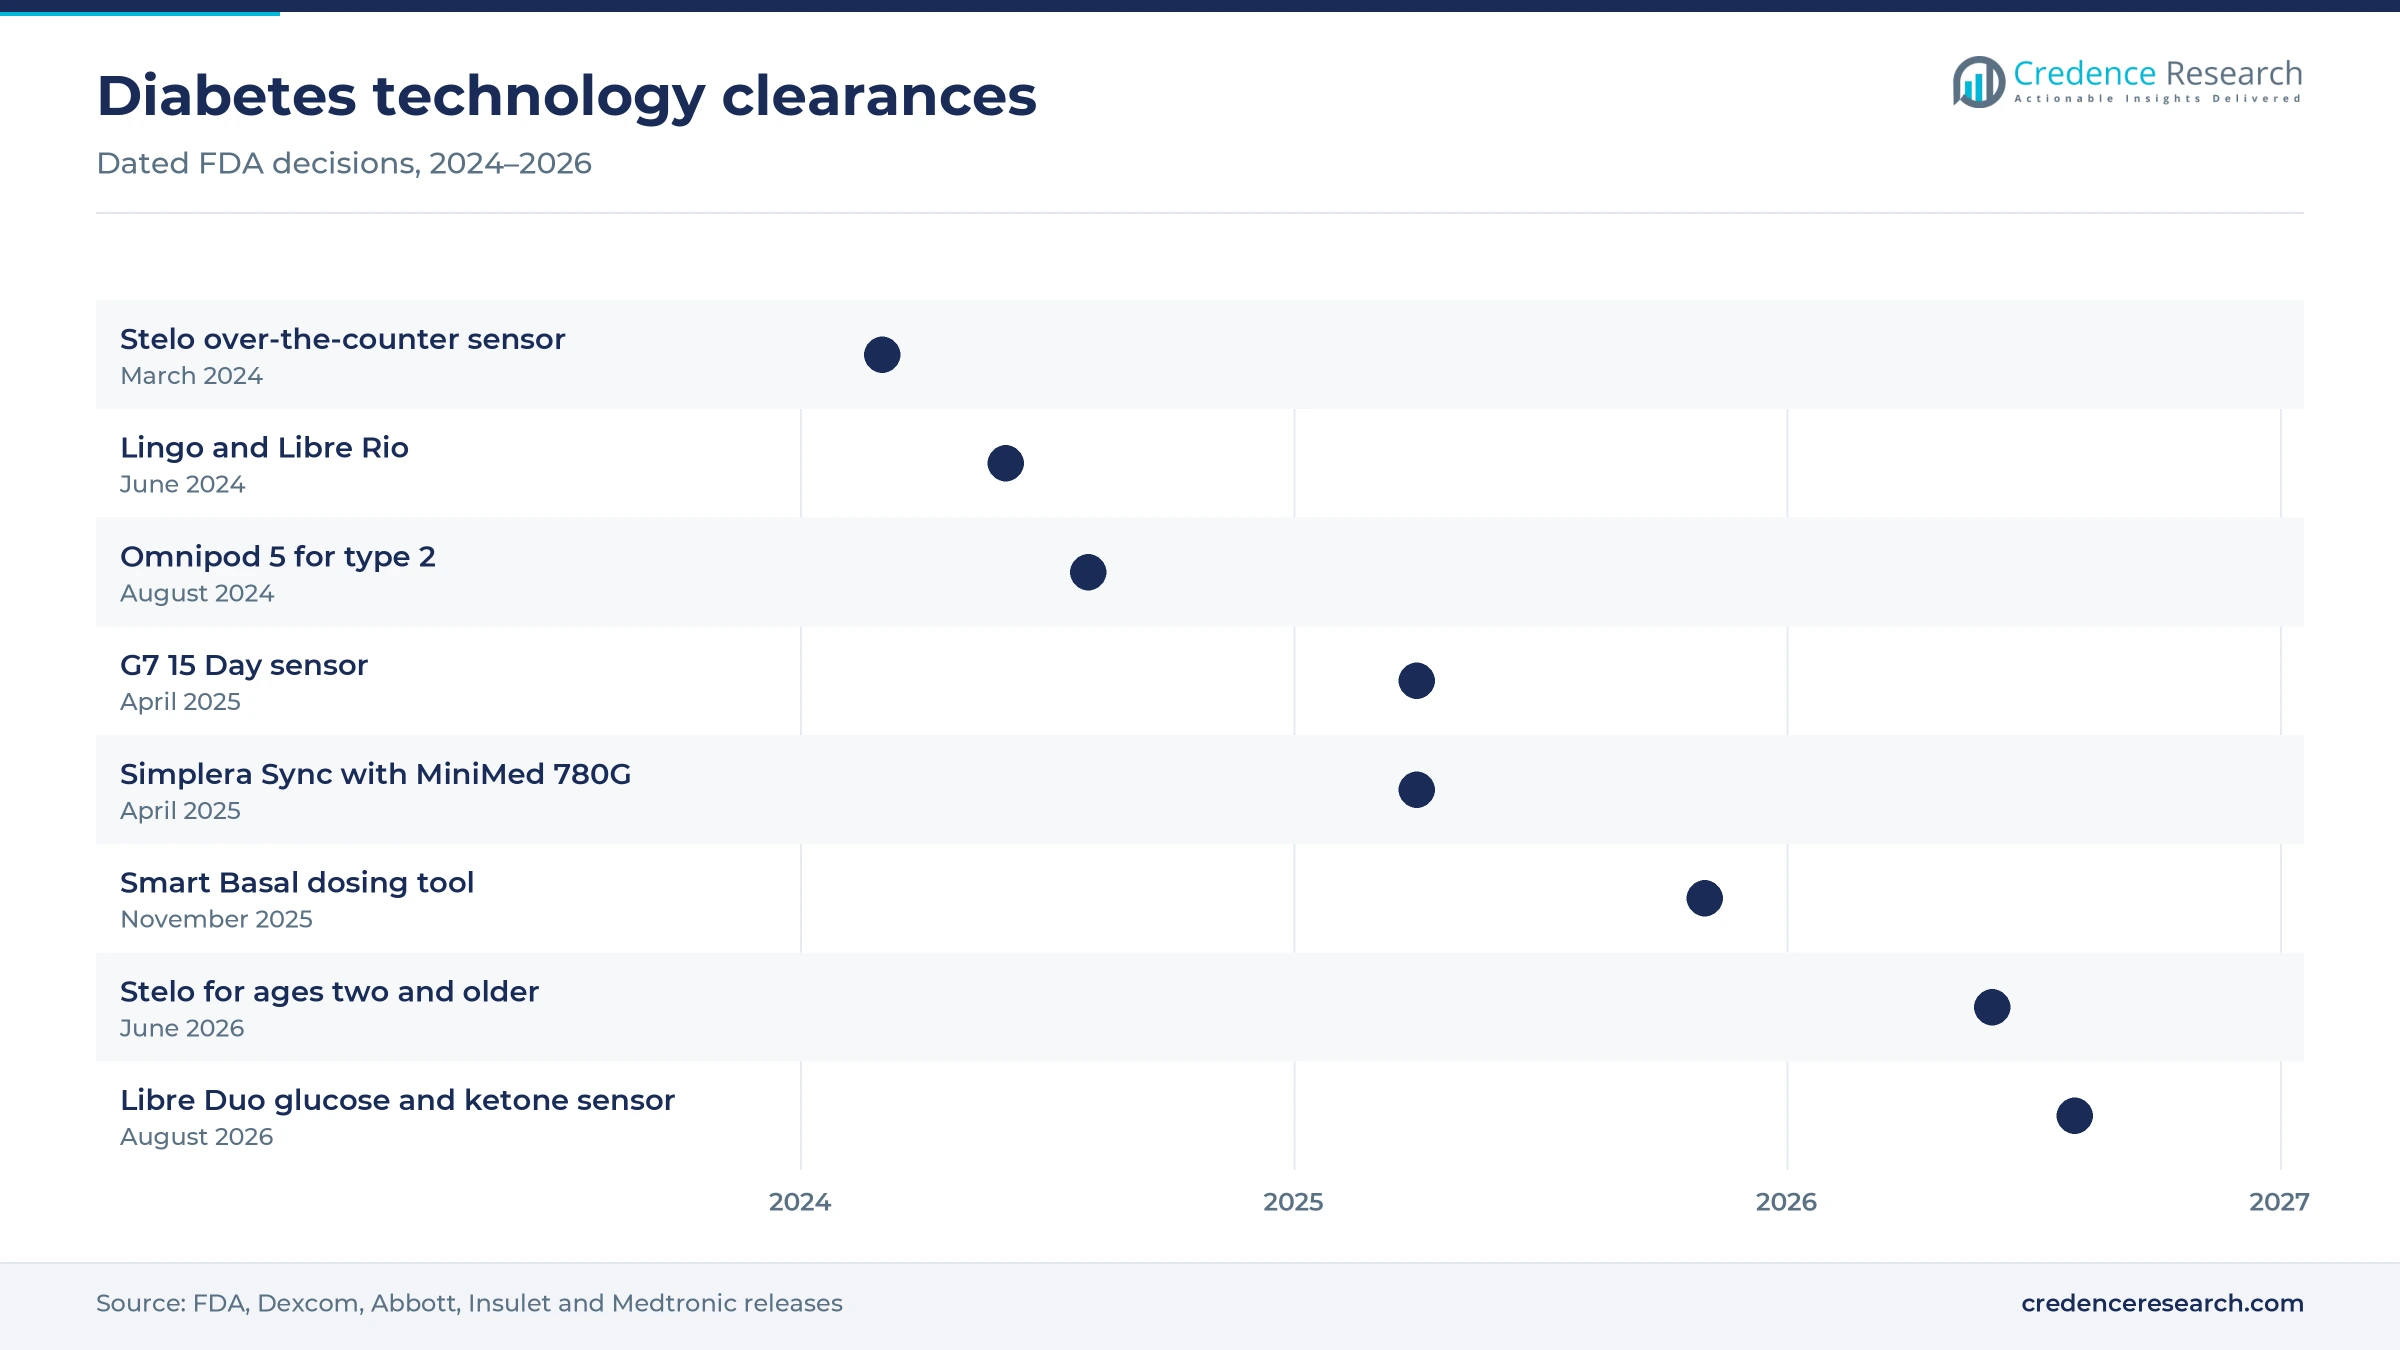
Over-the-counter sensors are shifting demand toward retail channels, because buyers no longer need a prescription to try continuous monitoring. In March 2024, the FDA cleared Dexcom Stelo for adults who do not use insulin, with sensors worn for up to 15 days. Abbott followed in June 2024, when it announced clearance of Lingo and Libre Rio for wellness users and type 2 patients. As a result, the market for over-the-counter continuous glucose monitors is growing quickly.
Why is longer sensor wear rising in importance?
Longer sensor wear is rising in importance, because fewer sensor changes lower cost and improve comfort for users. In April 2025, Dexcom announced FDA clearance of the G7 15 Day system, with 15.5 days of wear and an overall accuracy score of 8.0% mean absolute relative difference. Medtronic received FDA approval for its Simplera Sync sensor with the MiniMed 780G system in April 2025. In turn, competition increasingly centers on wear time, accuracy and integration with insulin pumps.
Can dosing software open a new value pool for sensor makers?
Sensor makers have a clear opening in insulin dosing software, because many type 2 patients struggle to adjust long-acting insulin doses at home. In November 2025, Dexcom announced FDA clearance of Smart Basal, which uses G7 15 Day sensor data and logged doses to suggest daily basal insulin doses. Connected tools such as smart insulin pens add dose records to the same data stream. As a result, device makers can earn value from software as well as hardware.
Where can multi-analyte sensors and pediatric labels add users?
Device makers have room to add users through new sensor types and wider age labels, because current products leave several groups underserved. In June 2026, the FDA cleared Dexcom Stelo for people aged two and older who do not use insulin, the first such over-the-counter clearance for children. In August 2026, the agency authorized the Abbott Libre Duo system, which tracks ketones and glucose together for people aged two and older with diabetes. In turn, these products open new uses in pediatric and high-risk care.
Coverage gaps, cost and accuracy limits slow uptake
Why do coverage gaps limit sensor adoption?
Coverage gaps limit sensor adoption, because many public and private payers still restrict continuous glucose monitors to insulin users. People with type 2 diabetes who manage the disease with oral medicines often pay out of pocket for sensors. This cost keeps many of them on fingerstick meters, even where clinical guidance supports wider monitoring. As a result, sensor penetration varies widely between countries and between insurance plans within the same country.
How does affordability slow uptake in emerging markets?
Affordability slows uptake in emerging markets, because patients there often buy meters, strips and pens without insurance support. Three in four adults with diabetes live in low- and middle-income countries, according to the International Diabetes Federation. Many of these patients ration test strips or test only during clinic visits. In turn, suppliers must offer low-cost meters and local manufacturing to grow volume, which keeps average prices in these regions low.
Why do accuracy and reliability concerns affect trust?
Accuracy and reliability concerns affect trust, because insulin dosing decisions depend on correct glucose readings. Sensors can lose adhesion, fail early or give readings that differ from blood tests, especially during rapid glucose changes. Dexcom disclosed that 73.9% of G7 15 Day sensors lasted the full 15 days in its study, which shows how early failures still occur. As a result, manufacturers invest heavily in quality systems, replacement programs and user training.
How do cybersecurity and data rules raise development costs?
Cybersecurity and data rules raise development costs, because connected sensors and pumps send health data to phones and cloud platforms. Regulators expect makers of connected devices to document software security, update processes and interoperability before clearance. Smaller companies often lack the teams needed to meet these requirements across several markets. In turn, the cost of compliance favors large suppliers and slows the entry of new device makers.
North America leads as Asia Pacific gains pace
| Region | Value, 2025 (USD billion) | Share, 2025 | CAGR, 2026–2035 |
|---|---|---|---|
| North America | 17.74 | 42.0% | 6.89% |
| Europe | 11.40 | 27.0% | 6.49% |
| Asia Pacific | 9.29 | 22.0% | 8.49% |
| Latin America | 2.11 | 5.0% | 7.79% |
| Middle East & Africa | 1.69 | 4.0% | 7.99% |
Why does North America hold the largest regional share?
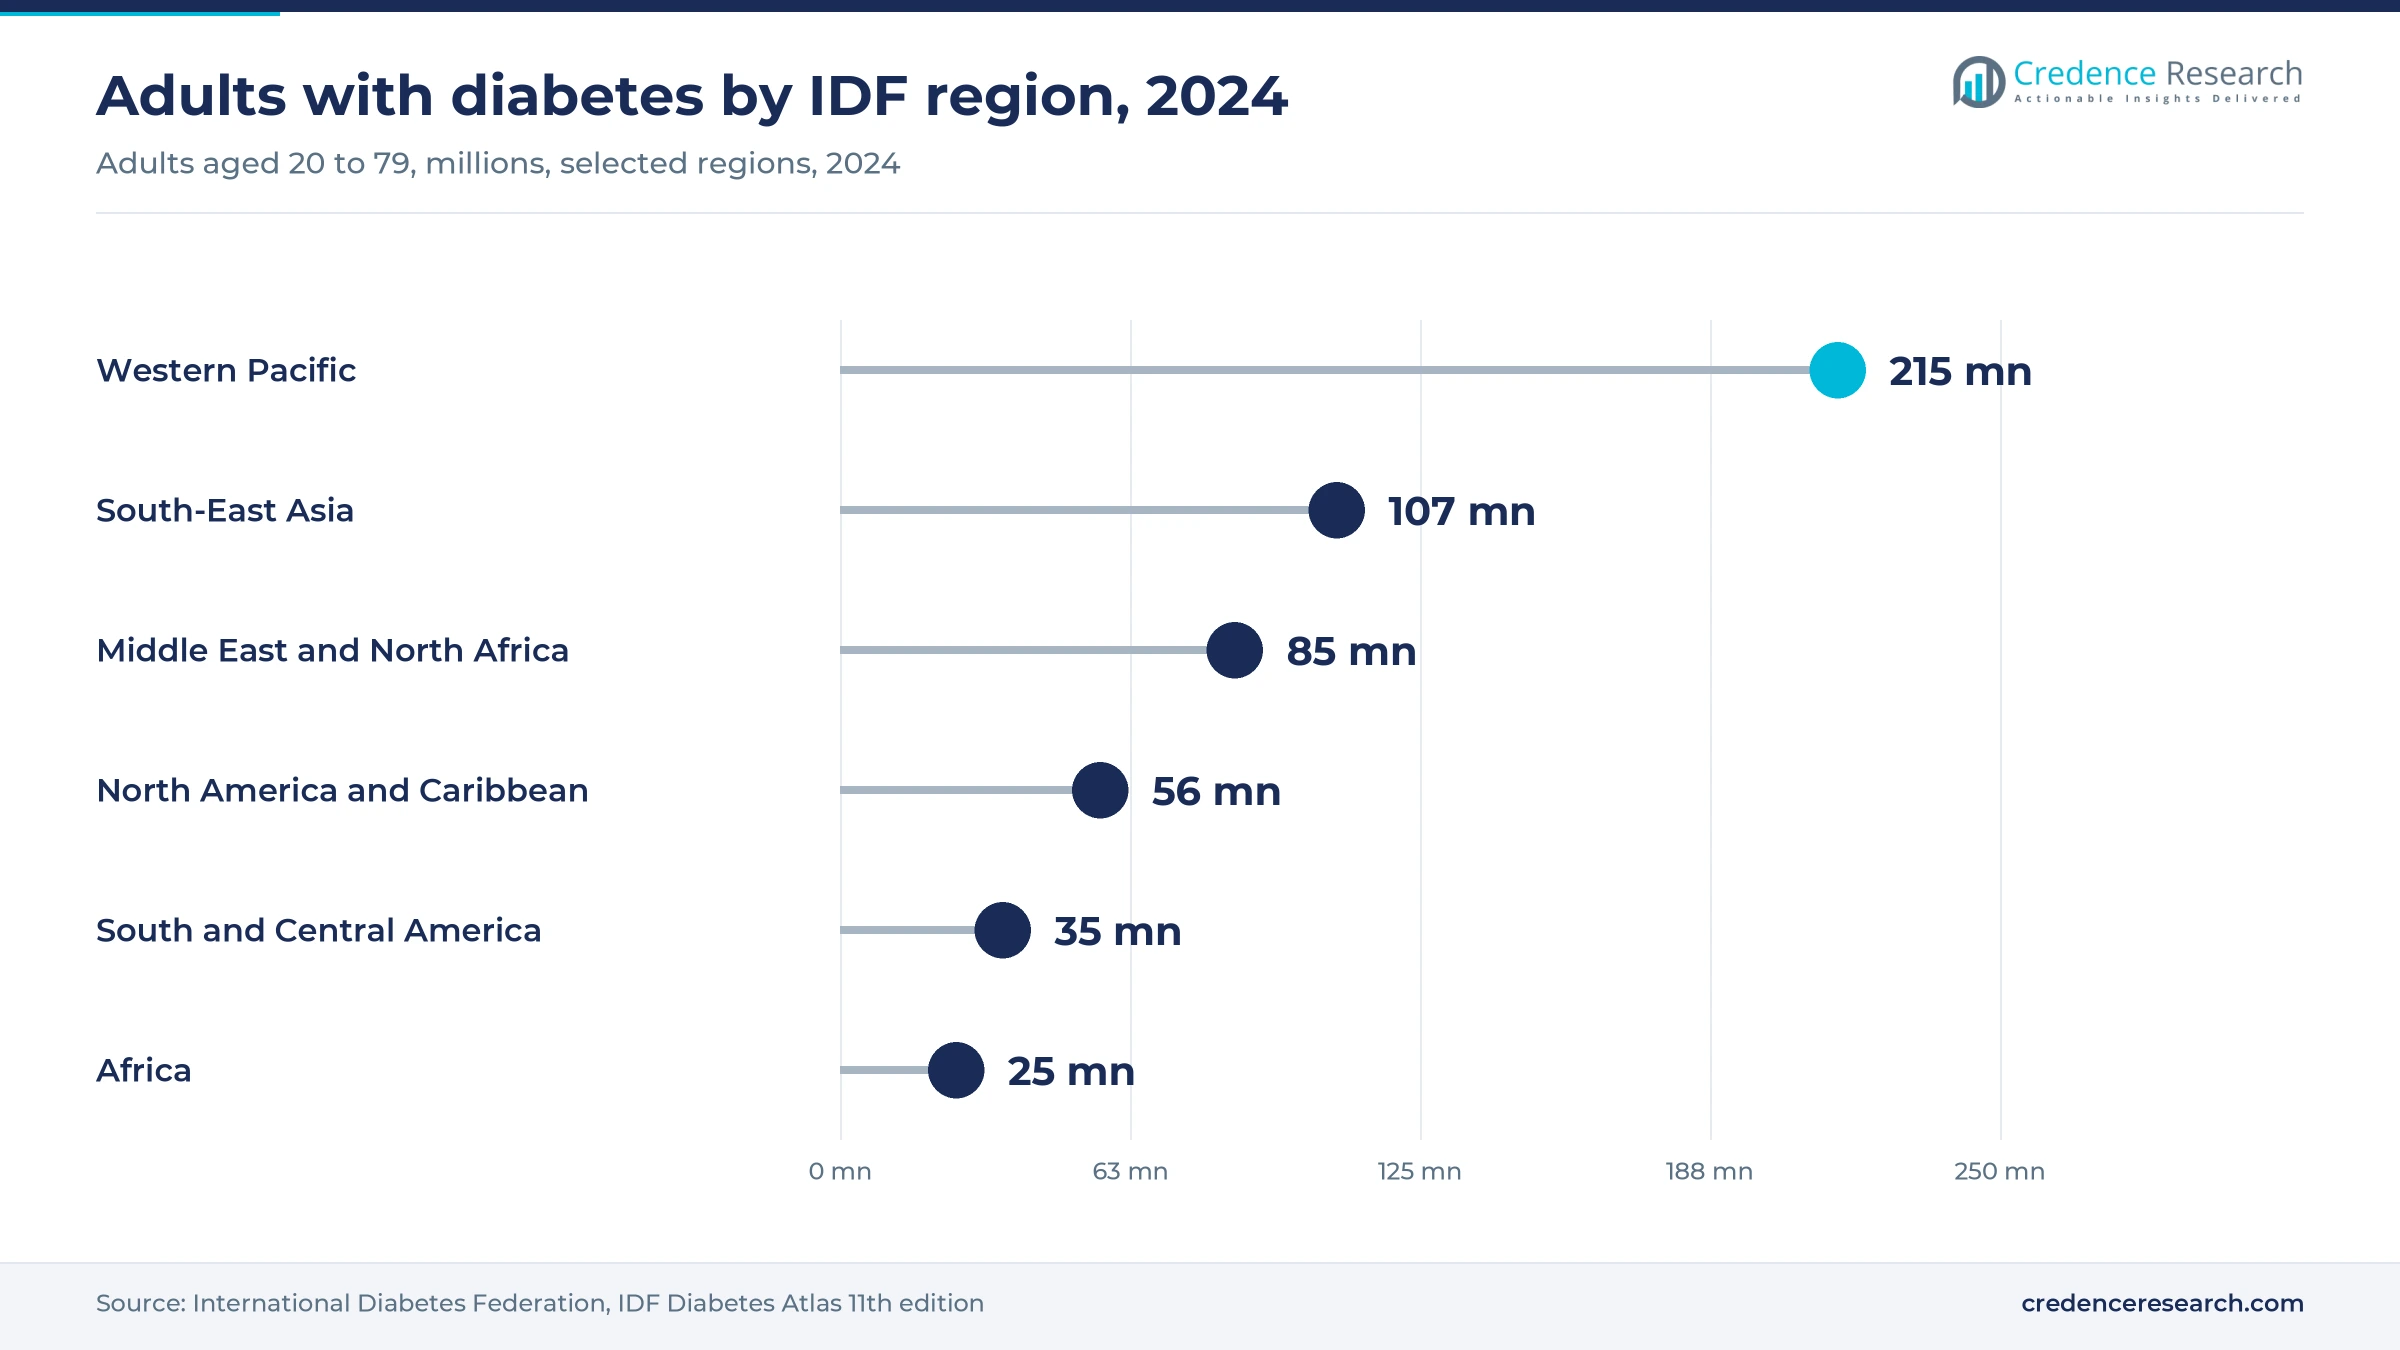
North America held a 42.0% share of 2025 value and grows at 6.89% a year through 2035. The United States drives this position, because private and public insurers cover continuous glucose monitors and automated pumps for many insulin users. The International Diabetes Federation counts 56 million adults with diabetes in its North America and Caribbean region in 2024, and 16 million of them are undiagnosed. U.S. regulators cleared several new sensors and dosing systems between 2024 and 2026, which keeps new technology reaching this region first.
How fast is Asia Pacific adding device users?
Asia Pacific held a 22.0% share of 2025 value and is the fastest-growing region at 8.49% a year. The region carries the largest patient base, since the International Diabetes Federation counts 215 million adults with diabetes in its Western Pacific region and 107 million in South-East Asia in 2024. About 108 million adults in the Western Pacific region are undiagnosed, which leaves wide room for screening and meter adoption. Local makers in China, India and South Korea compete strongly on meters and strips.
What shapes demand across Europe?
Europe held a 27.0% share of 2025 value and grows at 6.49% a year, the slowest pace of the five regions. Germany, France, the United Kingdom and Italy account for most spending, because national health systems reimburse sensors for many insulin users. Roche received a CE mark for its Accu-Chek SmartGuide sensor in July 2024, which predicts low glucose within 30 minutes. However, tender-based purchasing and price controls keep value growth below the global average.
Where is Latin America adding demand?
Latin America held a 5.0% share of 2025 value and grows at 7.79% a year through 2035. The International Diabetes Federation counts 35 million adults with diabetes in its South and Central America region in 2024. Brazil and Mexico lead regional spending, while most patients still rely on meters and strips bought through pharmacies.
What limits growth in the Middle East and Africa?
The Middle East and Africa held a 4.0% share of 2025 value and grows at 7.99% a year through 2035. The International Diabetes Federation counts 85 million adults with diabetes in the Middle East and North Africa and 25 million in Africa in 2024. About 18 million adults with diabetes in Africa are undiagnosed, which limits device use outside major cities.
FDA clearances for sensors and pumps since 2024
| Development | Status and market relevance |
|---|---|
| In April 2025, Dexcom received FDA clearance for the G7 15 Day continuous glucose monitoring system for adults. | Cleared; offers 15.5 days of wear and an 8.0% overall accuracy score |
| In April 2025, Medtronic received FDA approval for the Simplera Sync sensor for use with the MiniMed 780G system. | Approved; limited U.S. launch planned for fall 2025 |
| In November 2025, Dexcom received FDA clearance for Smart Basal, a sensor-integrated basal insulin dosing tool for type 2 diabetes. | Cleared; supports adults using glargine U-100 insulin |
| In June 2026, the FDA cleared Dexcom Stelo for people aged two and older who do not use insulin. | Cleared; first over-the-counter continuous glucose monitor for children, used under adult supervision |
| In August 2026, the FDA authorized the Abbott Libre Duo system, which monitors ketones and glucose in one wearable sensor. | Authorized; first wearable that tracks both values, for people with diabetes aged two and older |
Longer-wear sensors and dosing software lead innovation
- Long-wear continuous glucose sensors measure glucose every few minutes for up to 15 days, which reduces fingerstick testing and sensor changes.
- Automated insulin delivery systems link a sensor and a pump through an algorithm, which adjusts insulin doses with less input from the user.
- Predictive glucose software such as the Roche Accu-Chek SmartGuide app forecasts glucose for the next two hours, which helps users prevent low readings.
- Dual glucose and ketone sensors track both values in one wearable, which helps detect the risk of diabetic ketoacidosis earlier.
Need a Custom Version of This Report?
Tailor the scope, geography, or segments to your exact requirements.
- Custom geography or segment scope
- Direct access to our analyst team
Sensor and pump leaders compete on connected systems
Competition is led by sensor and pump specialists and by diversified health care companies with large diabetes portfolios. Abbott Laboratories and Dexcom compete directly in continuous glucose monitoring, and both now sell over-the-counter sensors in the United States. Medtronic and Insulet lead automated insulin delivery, with tubed and tubeless designs that connect to partner or in-house sensors. Roche, Ascensia Diabetes Care, ARKRAY, Bionime and Nova Biomedical compete in blood glucose meters and strips, where Nova Biomedical focuses on hospital point-of-care testing. Becton, Dickinson and Company supplies pen needles, syringes and related consumables for insulin users across hospitals and pharmacies. Novo Nordisk and Eli Lilly and Company sell insulin pens alongside their medicines, while Dr. Reddy's Laboratories adds diabetes products in emerging markets and DarioHealth offers a digital management platform. As a result, buyers increasingly favor connected systems that combine sensors, dosing tools and software under one ecosystem.
Companies profiled and their roles in this market
| Company | Type | Role in the market |
|---|---|---|
| Abbott Laboratories | Diversified | FreeStyle Libre sensors and the Lingo and Libre Rio over-the-counter systems |
| Dexcom | Specialist | G7 15 Day and Stelo continuous glucose monitors and Smart Basal dosing software |
| Medtronic | Diversified | MiniMed 780G automated insulin delivery system and Simplera Sync sensor |
| Insulet | Specialist | Omnipod 5 tubeless automated insulin delivery system for type 1 and type 2 diabetes |
| F. Hoffmann-La Roche | Diversified | Accu-Chek meters, strips and the SmartGuide predictive sensor |
| Ascensia Diabetes Care | Specialist | Contour blood glucose meters and test strips |
| ARKRAY | Specialist | Blood glucose meters and diagnostic testing products |
| Bionime | Specialist | Blood glucose meters and test strips |
| Nova Biomedical | Specialist | Hospital point-of-care glucose meters |
| Becton, Dickinson and Company | Diversified | Insulin syringes, pen needles and related consumables |
| B. Braun Melsungen | Diversified | Pen needles, insulin syringes and hospital consumables |
| Novo Nordisk | Pharmaceutical | Insulin pens and connected pen devices |
| Eli Lilly and Company | Pharmaceutical | Insulin pens and connected dosing tools |
| Dr. Reddy's Laboratories | Pharmaceutical | Diabetes products in India and other emerging markets |
| DarioHealth | Digital health | Smartphone-linked glucose meter and digital management platform |
Continuous monitoring sets the growth pace to 2035
Credence Research's view is that continuous glucose monitoring will set the pace of growth through 2035, because sensors replace fingerstick testing and now reach type 2 users who do not take insulin. The overall market grows at 7.25% a year, supported by a rising patient base in Asia Pacific and wider coverage in high-income markets. Insulin delivery grows steadily as automated systems extend to type 2 patients, while strips and lancets lose share. Companies that combine accurate sensors, dosing software and payer support will win the most new users.
How Credence Research sized diabetes device spending
The report uses 2025 as the base year and 2026 to 2035 as the forecast period. Market values come from the Credence Research model, which builds spending by product, disease type, end user and region. Regional and segment splits are Credence Research estimates informed by International Diabetes Federation and World Health Organization statistics, U.S. regulator decisions and company press releases. No primary interviews or surveys were used in preparing this edition of the report.
Diabetes device spending outlook to 2035
By 2035, the diabetes care devices market is projected to reach USD 85.01 billion, with growth led by continuous sensors, automated insulin delivery and dosing software. Blood glucose monitoring devices will remain the largest product area, as long-wear sensors move into retail channels and younger age groups. North America keeps the highest spending per patient, while Asia Pacific adds the most new users. Home care will take a larger share of value, because connected devices let clinicians follow patients remotely. As a result, advantage will depend on accuracy, coverage and software integration.
Frequently Asked Questions
How big is the global diabetes care devices market?
Which product leads the diabetes care devices market?
Which region leads diabetes device spending?
Which disease type accounts for most device spending?
Why do over-the-counter glucose sensors matter for this market?
How many adults live with diabetes worldwide?
Who are the leading diabetes device companies?
What restrains growth in diabetes care devices?
Table of Content
Chapter 1 Market Segmentation
- 1.1 Segmentation Framework
- 1.1.1 Product and Service Classification
- 1.1.2 Application and End-Use Classification
- 1.1.3 Technology and Solution Classification
- 1.1.4 Customer and Distribution Channel Classification
- 1.1.5 Geographic Segmentation
- 1.1.6 Market Segment Definitions and Boundaries
- 1.2 By Product
- 1.2.1 Blood Glucose Monitoring Devices
- 1.2.2 Insulin Delivery Devices
- 1.2.3 Consumables
- 1.3 By Disease Type
- 1.3.1 Type 1
- 1.3.2 Type 2
- 1.4 By End User
- 1.4.1 Hospital
- 1.4.2 Ambulatory Surgical Centers
- 1.4.3 Diagnostic Centers
- 1.4.4 Home Care
- 1.4.5 Others
Chapter 2 Introduction
- 2.1 Report Objectives and Scope
- 2.2 Product Definition and Industry Terminology
- 2.3 Market Inclusions and Exclusions
- 2.4 Research Process
- 2.4.1 Primary Research and Expert Interviews
- 2.4.2 Secondary Research and Source Review
- 2.4.3 Top-Down and Bottom-Up Estimation
- 2.4.4 Data Triangulation and Verification
- 2.5 Market Size Measurement Basis
- 2.5.1 2025: USD 42.23 billion → 2035: USD 85.01 billion
- 2.6 Historical and Forecast Reference Periods
- 2.6.1 Historical Period: 2018-2025
- 2.6.2 Base Year: 2025
- 2.6.3 Forecast Period: 2025-2035
- 2.7 Research Assumptions and Limitations
Chapter 3 Executive Summary
- 3.1 Market Snapshot and Key Findings
- 3.2 Base-Year Market Size, 2025
- 3.3 Forecast Market Size, 2035
- 3.4 Revenue and Volume Growth Outlook
- 3.5 Key Demand and Supply Indicators
- 3.6 Leading Market Segments
- 3.7 Fastest-Growing Market Opportunities
- 3.8 Regional Performance Highlights
- 3.9 Technology and Industry Transformation
- 3.10 Competitive Landscape Summary
- 3.11 Analyst View and Strategic Implications
Chapter 4 Global Diabetes Care Devices Market Trends and Developments
- 4.1 Historical Industry Development, 2018-2025
- 4.2 Recent Market Trends and Developments
- 4.3 Demand and Customer Behavior Trends
- 4.4 Technology and Product Innovation
- 4.5 Artificial Intelligence, Automation and Digitalization
- 4.6 Local Manufacturing and Supply Chain Realignment
- 4.7 Industry Partnerships, Mergers and Acquisitions
- 4.8 Sustainability and Circular Economy Developments
- 4.9 Government and Private Sector Investment Trends
- 4.10 Emerging Business Models and Commercialization
- 4.11 Industry Developments and Announcements
Chapter 5 Global Diabetes Care Devices Market Production, Supply and Demand Analysis
- 5.1 Demand Trend and Consumption Analysis, 2018-2025
- 5.2 Demand Forecast, 2025-2035
- 5.3 Production and Output Trend, 2018-2025
- 5.4 Production and Output Forecast, 2025-2035
- 5.5 Installed Capacity and Capacity Utilization
- 5.6 Company-Wise Production Plants and Statistics
- 5.6.1 Installed Production Capacity
- 5.6.2 Actual Production
- 5.6.3 Planned Capacity and Expansion Targets
- 5.7 Supply Chain Structure and Procurement Trends
- 5.8 Supply-Demand Gap and Bottlenecks
- 5.9 Import Dependence and Sourcing Structure
- 5.10 Contract Manufacturing and Outsourcing
- 5.11 Regional Supply and Demand Concentration
Chapter 6 Global Diabetes Care Devices Market Pricing Analysis
- 6.1 Pricing Structure and Measurement
- 6.2 Historical Pricing Trends, 2018-2025
- 6.3 Pricing Outlook, 2025-2035
- 6.4 Average Selling Price and Unit Economics
- 6.5 Pricing by Product and Market Segment
- 6.6 Geographic Pricing Differences
- 6.7 Key Input, Energy, Labor and Logistics Costs
- 6.8 Contract Pricing and Purchasing Models
- 6.9 Pricing Sensitivity and Competitive Positioning
- 6.10 Price, Margin and Profitability Implications
Chapter 7 Global Diabetes Care Devices Market Dynamics
- 7.1 Market Growth Drivers
- 7.1.1 Demand-Side Drivers
- 7.1.2 Technology and Innovation Drivers
- 7.1.3 Infrastructure and Investment Drivers
- 7.1.4 Regulatory and Policy Drivers
- 7.2 Market Restraints
- 7.2.1 Cost and Affordability Constraints
- 7.2.2 Technology and Adoption Barriers
- 7.2.3 Supply Chain and Operational Constraints
- 7.3 Market Challenges
- 7.3.1 Competitive Pressure and Margin Erosion
- 7.3.2 Skills, Infrastructure and Implementation Gaps
- 7.4 Emerging Market Opportunities
- 7.5 Market Dynamics Impact and Time-Horizon Assessment
Chapter 8 Global Diabetes Care Devices Value Chain Analysis
- 8.1 Industry Value Chain Overview
- 8.2 Upstream Suppliers and Critical Inputs
- 8.3 Technology and Component Providers
- 8.4 Manufacturing or Service Delivery
- 8.5 Distribution, Channel Partners and Integrators
- 8.6 Downstream Applications and End Users
- 8.7 Value Addition and Profit Pools
- 8.8 Vertical Integration and Outsourcing
- 8.9 Supplier Concentration and Risk
- 8.10 Supply Chain Localization and Resilience
Chapter 9 Global Diabetes Care Devices Market Regulations and Policies
- 9.1 Relevant Laws, Standards and Compliance Frameworks
- 9.2 Product, Service, Safety and Quality Requirements
- 9.3 Government Policies, Incentives and Subsidies
- 9.4 Imports, Exports and Trade Barriers
- 9.5 Public Procurement and Local Content Requirements
- 9.6 Environmental and Sustainability Compliance
- 9.7 Upcoming Policy Changes and Market Implications
Chapter 10 Global Diabetes Care Devices Market Hotspots and Opportunities
- 10.1 Market Opportunity Mapping and Growth Hotspots
- 10.2 High-Growth Applications and Customer Groups
- 10.3 Underserved Markets and White-Space Opportunities
- 10.4 Emerging Technology and Product Opportunities
- 10.5 New Capacity and Investment Hotspots
- 10.6 Market Entry and Expansion Opportunities
- 10.7 Distribution and Partnership Opportunities
- 10.8 Near-Term and Long-Term Commercial Potential
- 10.9 Opportunity Attractiveness and Execution Risks
Chapter 11 Global Diabetes Care Devices Market Outlook, 2025-2035
- 11.1 Market Size and Analysis
- 11.1.1 Revenue (Market Measurement: 2025: USD 42.23 billion → 2035: USD 85.01 billion)
- 11.1.2 Market Volume and Quantity Sold
- 11.1.3 Historical Market Size, 2018-2025
- 11.1.4 Base-Year Market Size, 2025
- 11.2 Market Forecast, 2025-2035
- 11.2.1 Revenue Forecast to 2035
- 11.2.2 Volume Forecast to 2035
- 11.2.3 CAGR and Year-on-Year Growth
- 11.2.4 Incremental Revenue Opportunity
- 11.3 Forecast Assumptions and Scenario Analysis
- 11.3.1 Base-Case Forecast
- 11.3.2 Optimistic and Conservative Scenarios
- 11.3.3 Technology, Pricing and Policy Sensitivities
- 11.4 Market Attractiveness and Growth Outlook
Chapter 12 Global Diabetes Care Devices Market Segmentation and Outlook
- 12.1 Segmentation Summary and Market Shares, 2025
- 12.2 Largest and Fastest-Growing Segments
- 12.3 By Product - Market Size and Forecast, 2025-2035
- 12.3.1 Segment Definition and Scope
- 12.3.2 Historical Market Size, 2018-2025
- 12.3.3 Revenue Forecast, 2025-2035
- 12.3.4 Volume Forecast, 2025-2035
- 12.3.5 Base-Year Market Share, 2025
- 12.3.6 Segment CAGR and Growth Drivers
- 12.3.7 Subsegment Market Size and Forecast
- 12.3.7.1 Blood Glucose Monitoring Devices
- 12.3.7.2 Insulin Delivery Devices
- 12.3.7.3 Consumables
- 12.3.8 Subsegment Pricing and Adoption Trends
- 12.3.9 Leading Suppliers and Competition
- 12.3.10 Regional Demand and Opportunities
- 12.4 By Disease Type - Market Size and Forecast, 2025-2035
- 12.4.1 Segment Definition and Scope
- 12.4.2 Historical Market Size, 2018-2025
- 12.4.3 Revenue Forecast, 2025-2035
- 12.4.4 Volume Forecast, 2025-2035
- 12.4.5 Base-Year Market Share, 2025
- 12.4.6 Segment CAGR and Growth Drivers
- 12.4.7 Subsegment Market Size and Forecast
- 12.4.7.1 Type 1
- 12.4.7.2 Type 2
- 12.4.8 Subsegment Pricing and Adoption Trends
- 12.4.9 Leading Suppliers and Competition
- 12.4.10 Regional Demand and Opportunities
- 12.5 By End User - Market Size and Forecast, 2025-2035
- 12.5.1 Segment Definition and Scope
- 12.5.2 Historical Market Size, 2018-2025
- 12.5.3 Revenue Forecast, 2025-2035
- 12.5.4 Volume Forecast, 2025-2035
- 12.5.5 Base-Year Market Share, 2025
- 12.5.6 Segment CAGR and Growth Drivers
- 12.5.7 Subsegment Market Size and Forecast
- 12.5.7.1 Hospital
- 12.5.7.2 Ambulatory Surgical Centers
- 12.5.7.3 Diagnostic Centers
- 12.5.7.4 Home Care
- 12.5.7.5 Others
- 12.5.8 Subsegment Pricing and Adoption Trends
- 12.5.9 Leading Suppliers and Competition
- 12.5.10 Regional Demand and Opportunities
- 12.6 Segment Growth Comparison
- 12.7 Segment Attractiveness and Priority Matrix
Chapter 13 Global Diabetes Care Devices End-Use and Application Market Outlook
- 13.1 End-Use Industry and Customer Demand Structure
- 13.2 Leading Applications and Customer Groups
- 13.3 End-Use Market Size, Share and Forecast
- 13.4 Major End-Use Industry Deep Dives
- 13.4.1 Customer Requirements and Use Cases
- 13.4.2 Demand and Replacement Cycles
- 13.4.3 Technical and Regulatory Considerations
- 13.4.4 Purchasing and Procurement Models
- 13.4.5 Leading Vendors and Distribution Channels
- 13.4.6 Forecast and Commercial Opportunities
- 13.5 Emerging Applications and Cross-Segment Demand
- 13.6 End-Use Industry Investment Priorities
Chapter 14 Global Diabetes Care Devices Geographic Market Outlook, 2025-2035
- 14.1 Regional Market Size and Share, 2025
- 14.2 Regional Market Forecast, 2025-2035
- 14.3 Regional Pricing, Production and Demand Differences
- 14.4 North America
- 14.4.1 United States
- 14.4.2 Canada
- 14.4.3 Mexico
- 14.5 Europe
- 14.5.1 Germany
- 14.5.2 France
- 14.5.3 Italy
- 14.5.4 United Kingdom
- 14.5.5 Spain
- 14.5.6 Poland
- 14.5.7 Russia
- 14.5.8 Netherlands
- 14.5.9 Belgium
- 14.5.10 Sweden
- 14.5.11 Denmark
- 14.5.12 Norway
- 14.5.13 Rest of Europe
- 14.6 Asia Pacific
- 14.6.1 China
- 14.6.2 India
- 14.6.3 Japan
- 14.6.4 South Korea
- 14.6.5 Thailand
- 14.6.6 Indonesia
- 14.6.7 Vietnam
- 14.6.8 Malaysia
- 14.6.9 Australia
- 14.6.10 Rest of Asia Pacific
- 14.7 Latin America
- 14.7.1 Brazil
- 14.7.2 Argentina
- 14.7.3 Colombia
- 14.7.4 Chile
- 14.7.5 Rest of Latin America
- 14.8 Middle East
- 14.8.1 Saudi Arabia
- 14.8.2 United Arab Emirates
- 14.8.3 Turkey
- 14.8.4 Israel
- 14.8.5 Iran
- 14.8.6 Rest of the Middle East
- 14.9 Africa
- 14.9.1 South Africa
- 14.9.2 Egypt
- 14.9.3 Nigeria
- 14.9.4 Morocco
- 14.9.5 Rest of Africa
- 14.10 Regional Investment, Policy and Supply Chain Differences
- 14.11 Regional Competitive Landscape
- 14.12 Geographic Growth Hotspots
Chapter 15 Global Diabetes Care Devices Technology, Innovation and Sustainability Outlook
- 15.1 Technology Landscape and Maturity
- 15.2 Product, Process and Service Innovation
- 15.3 AI, Automation and Digital Tools in the Industry
- 15.4 Technology Adoption and Performance Benchmarking
- 15.5 Innovation Pipeline and R&D Investment
- 15.6 Patent and Intellectual Property Trends
- 15.7 Energy Efficiency and Resource Management
- 15.8 Sustainability, Recycling and Circularity
- 15.9 Technology Roadmap, 2025-2035
- 15.10 Risks of Obsolescence and Technology Substitution
Chapter 16 Global Diabetes Care Devices Market Key Strategic Imperatives
- 16.1 Growth and Market Entry Priorities
- 16.2 High-Return Products and Segments
- 16.3 Pricing, Profitability and Cost Optimization
- 16.4 Technology Investment and Product Differentiation
- 16.5 Supply Chain Localization and Resilience
- 16.6 Distribution and Customer Acquisition
- 16.7 Partnership, Acquisition and Capacity Strategy
- 16.8 Regional Expansion Priorities
- 16.9 Short-, Medium- and Long-Term Actions
Chapter 17 Competition Outlook
- 17.1 Industry Competition Characteristics
- 17.2 Market Structure and Concentration
- 17.3 Market Share and Competitive Positioning, 2025
- 17.4 Company-Wise Revenue and Product Benchmarking
- 17.5 Production and Service Capacity Benchmarking
- 17.6 Technology, Pricing and Differentiation
- 17.7 Regional Footprint and Distribution Strength
- 17.8 Mergers, Acquisitions and Strategic Alliances
- 17.9 New Entrants and Competitive Threats
- 17.10 Porter's Five Forces and Industry Attractiveness
- 17.11 Competitive Outlook, 2025-2035
Chapter 18 Company Profiles
- 18.1 Company Coverage and Selection Criteria
- 18.2 Abbott Laboratories
- 18.2.1 Business Description
- 18.2.2 Company Ownership and Geographic Presence
- 18.2.3 Product and Service Portfolio
- 18.2.4 Manufacturing and Operating Footprint
- 18.2.5 Production Capacity and Expansion Plans
- 18.2.6 Financial Performance and Investment
- 18.2.7 Market Share and Competitive Position
- 18.2.8 Technology and Innovation Capabilities
- 18.2.9 Strategic Alliances or Partnerships
- 18.2.10 Recent Developments
- 18.2.11 Growth Strategy and Outlook
- 18.3 ARKRAY
- 18.4 Ascensia Diabetes Care
- 18.5 B. Braun Melsungen
- 18.6 Becton, Dickinson and Company
- 18.7 Bionime
- 18.8 DarioHealth
- 18.9 Dexcom
- 18.10 Dr. Reddy's Laboratories
- 18.11 Eli Lilly and Company
- 18.12 F. Hoffmann-La Roche
- 18.13 Insulet
- 18.14 Medtronic
- 18.15 Nova Biomedical
- 18.16 Novo Nordisk
- 18.17 Other Relevant Market Participants
Note: Every listed company is profiled on the structure shown under the first company. The company list is preliminary and may change based on research findings, market developments, data availability and client requirements.
Chapter 19 Disclaimer
- 19.1 Research and Forecast Disclaimer
- 19.2 Data Source and Estimation Limitations
Note: The depth of individual sections depends on data availability for this market. Volume, capacity, trade and other unit-based metrics are included where applicable.