
Dimethylformamide Market Overview:
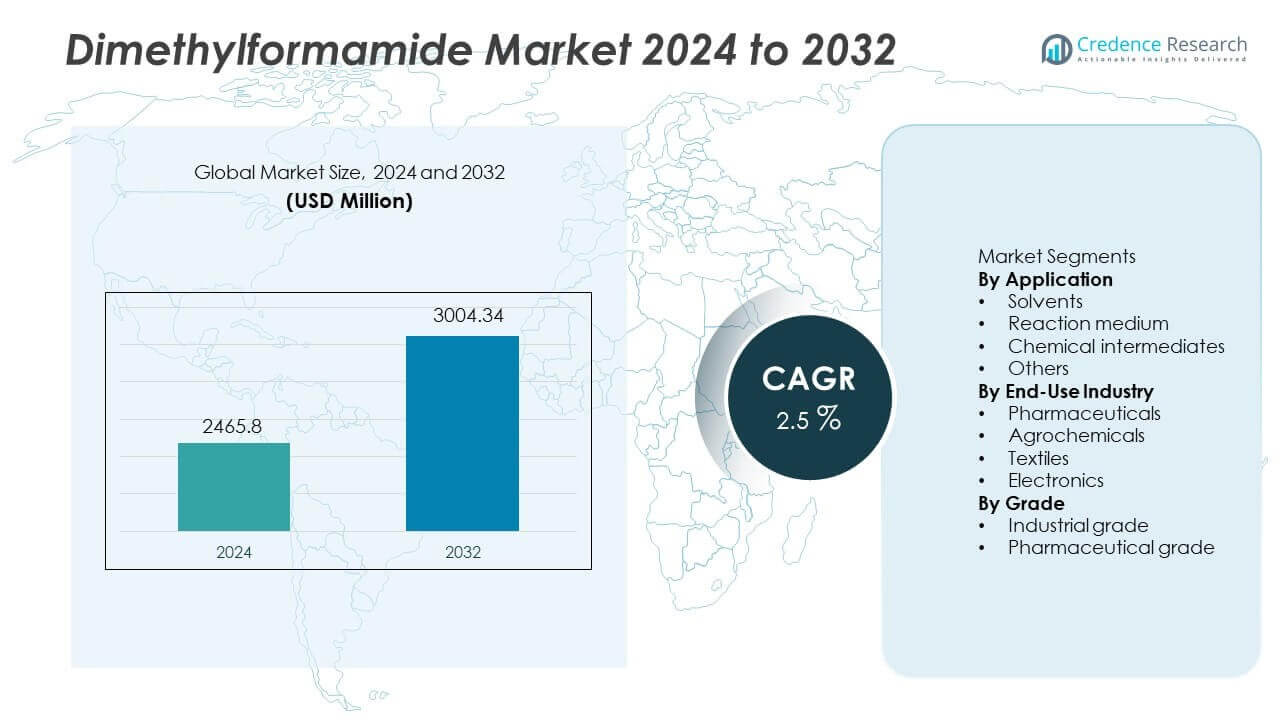
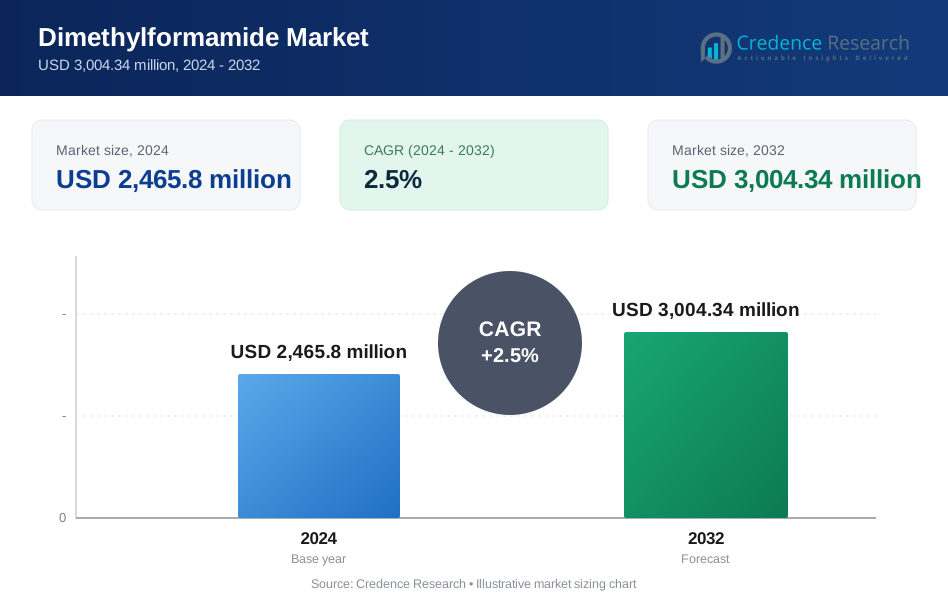
The dimethylformamide market was valued at USD 2,465.8 million in 2024 and is expected to reach USD 3,004.34 million by 2032, growing at a CAGR of 2.5% during the forecast period.
| REPORT ATTRIBUTE | DETAILS |
|---|---|
| Historical Period | 2020-2024 |
| Base Year | 2025 |
| Forecast Period | 2026-2032 |
| Dimethylformamide Market Size 2024 | USD 2,465.8 million |
| Dimethylformamide Market, CAGR | 2.5% |
| Dimethylformamide Market Size 2032 | USD 3,004.34 million |
Dimethylformamide Market Insights
- Strong pharmaceutical manufacturing acts as a key market driver, as DMF supports active pharmaceutical ingredient synthesis and reaction stability, while the solvents application segment leads with a 44% share due to extensive use in polymer processing and chemical reactions.
- Market trends highlight rising demand for high-purity grades and specialty applications, with pharmaceutical grade accounting for 32% share, while industrial grade dominates with 68% share due to large-scale textile and chemical usage.
- Competitive analysis shows leading players focusing on capacity optimization, cost efficiency, and regulatory compliance, with integrated operations strengthening supply reliability across pharmaceutical, textile, and agrochemical customers.
- Regional analysis indicates Asia Pacific leads with a 38% share, followed by Europe at 27% and North America at 25%, while the Rest of the World holds a 10% share, reflecting varied industrial maturity and consumption patterns.
Dimethylformamide Market Segmentation Analysis:
By Application
By application, solvents dominate the dimethylformamide market with a 44% share. Solvent use remains strong due to high solvency power and chemical stability. DMF performs well in dissolving polymers, resins, and synthetic fibers. Textile coating, polyurethane processing, and pharmaceutical synthesis rely heavily on solvent-grade DMF. Reaction medium applications hold a 28% share, supported by controlled reaction environments in organic synthesis. Chemical intermediates account for 19%, driven by demand for specialty chemicals and active ingredients. Others represent 9%, covering niche laboratory and specialty uses. Strong industrial compatibility and process efficiency drive solvent segment leadership.
- For instance, BASF supplies solvent-grade DMF with 99.9 purity, boiling point 153 °C, and dielectric constant 36.7, supporting polyurethane processing and textile coating lines with stable viscosity control and repeatable dissolution performance.
By End-Use Industry
By end-use industry, pharmaceuticals lead the market with a 36% share. DMF supports drug synthesis, peptide production, and API manufacturing. High purity requirements and process consistency sustain pharmaceutical demand. Textiles follow with a 29% share, supported by synthetic fiber spinning and coating operations. Agrochemicals hold a 21% share, driven by pesticide and herbicide formulation needs. Electronics account for 14%, supported by use in circuit board cleaning and specialty coatings. Pharmaceutical dominance reflects stable drug manufacturing volumes and strict solvent performance requirements across regulated production environments.
- For instance, Tokyo Chemical Industry supplies semiconductor-grade DMF with metal impurities below 1 ppm and acid content under 0.01 percent, enabling reliable circuit board cleaning and specialty coating applications.
By Grade
By grade, industrial grade dimethylformamide dominates with a 68% market share. Large-scale chemical processing and textile manufacturing drive high-volume consumption. Industrial grade offers cost efficiency and adequate purity for bulk applications. Pharmaceutical grade holds a 32% share, supported by stringent quality standards. Drug manufacturing requires low impurity levels and controlled specifications. Regulatory compliance increases production costs for pharmaceutical grade material. However, steady pharmaceutical output sustains demand growth. Industrial grade dominance reflects broader application coverage and continuous demand from high-volume end-use industries.
Key Growth Drivers
Expanding Pharmaceutical Manufacturing Demand
Pharmaceutical manufacturing remains a core growth driver for the dimethylformamide market. DMF supports synthesis of active pharmaceutical ingredients and complex intermediates. Manufacturers value DMF for high solvency and stable reaction performance. Rising chronic disease prevalence increases global drug output. Generic drug production expands rapidly across Asia Pacific regions. Contract manufacturing organizations prefer DMF for scalable and repeatable processes. Regulatory compliance requirements favor consistent solvent quality. Continuous investments in pharmaceutical capacity sustain long-term consumption. Healthcare demand stability supports steady market expansion.
- For instance, Balaji Amines Limited produces pharmaceutical-grade DMF with purity of 99.9, water content below 1,000 ppm, boiling point of 153 °C, and specific gravity of 0.944 at 25 °C, enabling stable reaction control and consistent batch reproducibility in large-scale API and generic drug manufacturing operations.
Growth in Synthetic Fiber and Textile Processing
Textile production continues to drive dimethylformamide demand. DMF plays a vital role in synthetic fiber spinning and coating processes. Polyurethane and acrylic fiber manufacturing depends on DMF properties. Growing apparel consumption increases textile output worldwide. Technical textiles gain wider use in industrial and automotive applications. Developing economies expand domestic textile manufacturing bases. Export-driven textile hubs generate consistent solvent demand. DMF ensures uniform fiber quality and process efficiency. Ongoing textile modernization supports long-term market stability.
- For instance, Eastman Chemical Company produces fiber-grade DMF that supports uniform polyurethane and acrylic fiber formation in continuous spinning operations.
Rising Demand for Chemical Intermediates
Chemical intermediate production strengthens dimethylformamide market growth. DMF supports controlled organic synthesis reactions. Specialty chemicals require stable reaction environments. Agrochemical manufacturing increases intermediate consumption volumes. Fine chemical plants rely on DMF process reliability. Industrial diversification boosts chemical output across regions. Efficiency advantages favor DMF over alternative solvents. Long production cycles ensure recurring demand. Integrated chemical manufacturing supports steady market fundamentals.
Key Trends & Opportunities
Shift Toward High-Purity and Specialty Grades
High-purity dimethylformamide demand continues to rise. Pharmaceutical and electronics industries require strict impurity control. Buyers prioritize certified quality and consistency. Producers invest in advanced purification technologies. Specialty grades allow higher value realization. Compliance with global quality standards strengthens supplier positioning. Demand for reliable solvent performance grows steadily. Specialty offerings reduce price sensitivity. This trend supports margin improvement opportunities.
- For instance, the Mitsubishi Chemical Group implements real-time continuous process monitoring and advanced separation and purification technologies to stabilize manufacturing processes and achieve high-precision impurity control.
Capacity Expansion in Emerging Markets
Emerging markets attract new dimethylformamide production investments. Asia Pacific leads chemical manufacturing capacity additions. Local production reduces import dependency and logistics costs. Government incentives support domestic chemical growth. End users benefit from stable regional supply. Producers access fast-growing consumer markets. Regional plants enhance supply chain resilience. Faster delivery improves customer engagement. Emerging markets strengthen long-term demand prospects.
- For instance, Jiutian Chemical commissioned a DMF unit with significant annual output, optimizing logistics to reduce regional delivery times.
Key Challenges
Environmental and Health Safety Concerns
Health and safety risks present major challenges for dimethylformamide usage. Prolonged exposure affects worker safety conditions. Regulators enforce strict handling and emission controls. Compliance increases operational and monitoring costs. Producers invest in safety systems and training. End users face additional workplace regulations. Environmental rules limit waste disposal practices. Substitution pressure rises in sensitive applications. Regulatory complexity impacts long-term demand patterns.
Availability of Alternative Solvents
Alternative solvents create competitive pressure on dimethylformamide demand. Green chemistry initiatives promote safer solvent options. Bio-based and low-toxicity alternatives gain attention. Regulatory encouragement accelerates substitution research. End users evaluate alternatives in specific applications. Performance and cost parity improves gradually. Process revalidation reduces switching barriers. Some industries reduce DMF usage selectively. Continuous innovation remains critical for market relevance.
Regional Analysis
North America
North America holds a 25% share of the dimethylformamide market, supported by strong pharmaceutical and chemical manufacturing. The United States leads demand due to large-scale API production and specialty chemical synthesis. Strict quality standards sustain demand for high-purity DMF grades. Agrochemical manufacturing contributes to stable consumption volumes. Advanced research and development activities rely on DMF for controlled reactions. Regulatory compliance drives investments in safety and handling infrastructure. Stable healthcare spending supports pharmaceutical output. Mature industrial ecosystems ensure consistent solvent demand across the region.
Europe
Europe accounts for a 27% share of the dimethylformamide market, driven by diversified industrial usage. Germany, France, and Italy lead regional consumption through chemical intermediates and pharmaceutical manufacturing. Textile finishing and coating applications support steady demand. Regulatory emphasis on process control favors consistent solvent performance. Pharmaceutical exports sustain production volumes. Environmental regulations increase compliance costs but support certified grade demand. Specialty chemical production remains a key contributor. Advanced manufacturing standards reinforce solvent reliability requirements.
Asia Pacific
Asia Pacific dominates the dimethylformamide market with a 38% share, supported by rapid industrial expansion. China leads consumption through textile manufacturing and chemical processing. India strengthens demand through pharmaceutical API production. Expanding agrochemical manufacturing boosts solvent usage. Cost-efficient production supports high-volume industrial applications. Government support encourages chemical capacity expansion. Export-oriented textile hubs create recurring demand. Integrated supply chains enhance regional competitiveness and market leadership.
Rest of the World
The Rest of the World represents a 10% share of the dimethylformamide market, supported by selective industrial growth. Latin America shows demand from agrochemical and pharmaceutical sectors. The Middle East benefits from expanding chemical processing investments. Africa records gradual demand growth from textile finishing activities. Infrastructure development supports market expansion. Import dependency remains high across several countries. Local production capacity stays limited. Industrial diversification trends drive steady consumption growth.
Dimethylformamide Market Segmentations:
By Application
- Solvents
- Reaction medium
- Chemical intermediates
- Others
By End-Use Industry
- Pharmaceuticals
- Agrochemicals
- Textiles
- Electronics
By Grade
- Industrial grade
- Pharmaceutical grade
By Geography
- North America
- U.S.
- Canada
- Mexico
- Europe
- Germany
- France
- U.K.
- Italy
- Spain
- Rest of Europe
- Asia Pacific
- China
- Japan
- India
- South Korea
- South-east Asia
- Rest of Asia Pacific
- Latin America
- Brazil
- Argentina
- Rest of Latin America
- Middle East & Africa
- GCC Countries
- South Africa
- Rest of the Middle East and Africa
Competitive Landscape
Competitive Landscape Analysis in the dimethylformamide market features BASF SE, Eastman Chemical Company, Mitsubishi Chemical Group, LANXESS AG, and Balaji Amines Limited as key participants. The competitive landscape reflects strong emphasis on production efficiency and consistent quality. Integrated operations provide cost and supply advantages. Asian producers compete through high-volume, cost-efficient manufacturing. European and U.S. players focus on high-purity grades and regulatory compliance. Capacity optimization and plant upgrades remain priorities. Companies invest in safety systems to meet environmental norms. Long-term contracts support demand stability. Technology improvements enhance yield and purity. Regional expansion improves customer proximity. Competition centers on scale, reliability, and compliance capabilities.
Key Player Analysis
- BASF SE
- Eastman Chemical Company
- Mitsubishi Chemical Group
- LANXESS AG
- Zhejiang Jiangshan Chemical
- Balaji Amines Limited
- Luxi Chemical Group
- Shandong Hualu-Hengsheng
- Sinopec Group
- Tokyo Chemical Industry
Recent Developments
- In November 2023, BASF SE and Sinopec inaugurated expanded downstream plants at BASF-YPC Nanjing.
- In November 2023, Sinopec Group joined BASF in expanding BASF-YPC’s Nanjing downstream plants.
Report Coverage
The research report offers an in-depth analysis based on Application, End-Use Industry, Grade and Geography. It details leading market players, providing an overview of their business, product offerings, investments, revenue streams, and key applications. Additionally, the report includes insights into the competitive environment, SWOT analysis, current market trends, as well as the primary drivers and constraints. Furthermore, it discusses various factors that have driven market expansion in recent years. The report also explores market dynamics, regulatory scenarios, and technological advancements that are shaping the industry. It assesses the impact of external factors and global economic changes on market growth. Lastly, it provides strategic recommendations for new entrants and established companies to navigate the complexities of the market.
Future Outlook
- Pharmaceutical manufacturing will continue driving steady dimethylformamide demand across global markets.
- Textile and synthetic fiber production will sustain high-volume consumption in industrial applications.
- Asia Pacific will remain the primary growth region due to expanding chemical capacity.
- Demand for high-purity grades will increase across regulated end-use industries.
- Producers will invest in process optimization to improve yield and cost efficiency.
- Environmental compliance will shape production practices and safety investments.
- Alternative solvent development will influence selective application shifts.
- Long-term supply agreements will strengthen demand visibility for manufacturers.
- Capacity expansion in emerging economies will enhance regional supply security.
- Technological upgrades will support consistent quality and operational reliability.
Request a Free Sample
Fill in your details and we'll send you a free sample report.
- Sample data tables & charts
- Research methodology
Need a Custom Version of This Report?
Tailor the scope, geography, or segments to your exact requirements.
- Custom geography or segment scope
- Direct access to our analyst team
Frequently Asked Questions
What is the current market size for the Dimethylformamide market, and what is its projected size in 2032?
At what Compound Annual Growth Rate is the Dimethylformamide market projected to grow between 2024 and 2032?
Which Dimethylformamide market segment held the largest share in 2024?
What are the primary factors fueling the growth of the Dimethylformamide market?
Who are the leading companies in the Dimethylformamide market?
Which region commanded the largest share of the Dimethylformamide market in 2024?
Table of Content
Chapter 1. Report Introduction
- 1.1 Report Description & Purpose
- 1.1.1 Report Title & Market Definition
- 1.1.2 Unique Selling Propositions (USP) & Key Differentiators
- 1.1.3 Value Proposition for Stakeholders
- 1.2 Research Objectives
- 1.2.1 Market Sizing Objectives (Volume & Revenue)
- 1.2.2 Segmentation Objectives
- 1.2.3 Competitive Intelligence Objectives
- 1.2.4 Forecast & Scenario Objectives
- 1.3 Report Scope
- 1.3.1 Dimethylformamide Scope – Types & Subtypes Covered
- 1.3.2 Geographic Scope – Regions & Countries Covered
- 1.3.3 Historical Period, Base Year & Forecast Period (2024; forecast to 2032)
- 1.3.4 Inclusions & Exclusions
- 1.4 HS Code & Classification Framework
- 1.5 Currency, Units & Pricing Basis
- 1.6 Target Stakeholders
- 1.7 Limitations & Assumptions
Chapter 2. Executive Summary
- 2.1 Global Dimethylformamide Market Snapshot
- 2.1.1 Market Size – Historical (2024) & Forecast (2024-2032) (2024: USD 2,465.8 million → 2032: USD 3,004.34 million)
- 2.1.2 Volume & Revenue – Global Totals
- 2.1.3 Key Market Highlights – Top Five Facts
- 2.2 Dimethylformamide Market Segmentation Snapshot
- 2.2.1 Market Split by Region – 2024 vs. 2032
- 2.3 Competitive Snapshot
- 2.3.1 Top 10 Players by Revenue Share – 2024
- 2.3.2 Top 10 Players by Volume Share – 2024
- 2.3.3 Recent Strategic Developments (18-Month Summary)
- 2.4 Key Investment Highlights & Strategic Conclusions
Chapter 3. Dimethylformamide Market Dynamics & Industry Analysis
- 3.1 Market Overview & Context
- 3.1.1 Dimethylformamide Market Position in the Broader Automotive Value Chain
- 3.1.2 OEM vs. Replacement Market Dynamics
- 3.1.3 Market Maturity & Development Stage by Region
- 3.2 Dimethylformamide Market Drivers
- 3.3 Dimethylformamide Market Restraints & Challenges
- 3.4 Dimethylformamide Market Opportunities
- 3.5 Porter's Five Forces Analysis
- 3.5.1 Threat of New Entrants
- 3.5.2 Bargaining Power of Suppliers
- 3.5.3 Bargaining Power of Buyers
- 3.5.4 Threat of Substitutes
- 3.5.5 Competitive Rivalry – Intensity Assessment
- 3.6 Dimethylformamide Value Chain Analysis
- 3.6.1 Upstream – Raw Material/Input Suppliers
- 3.6.1.1 Raw Material/Input 1
- 3.6.1.2 Raw Material/Input 2
- 3.6.1.3 Raw Material/Input 3
- 3.6.2 Midstream – Production/Manufacturing/Service Delivery
- 3.6.2.1 Production/Process Overview
- 3.6.2.2 Key Facility Locations & Capacity by Manufacturer
- 3.6.3 Downstream – Distribution & End Consumer
- 3.6.3.1 Primary Channel – B2B/OEM
- 3.6.3.2 Secondary Channels – Dealer, Retail, Online, Direct
- 3.6.4 Value Chain Profitability Analysis
- 3.6.1 Upstream – Raw Material/Input Suppliers
- 3.7 PESTEL Analysis
- 3.7.1 Political Factors
- 3.7.2 Economic Factors
- 3.7.3 Social Factors
- 3.7.4 Technological Factors
- 3.7.5 Environmental Factors
- 3.7.6 Legal Factors
- 3.8 Dimethylformamide Supply Chain Analysis
- 3.8.1 Raw Material/Input Supply Risk Assessment
- 3.8.2 Manufacturing Concentration Risk (Geographic Exposure)
- 3.8.3 Trade Disruption Impact Analysis
- 3.9 Regulatory & Policy Landscape
Note: The regulatory and policy landscape section covers regulations based on their applicability to the market, Dimethylformamide category, geography, and scope of the study. Only regulatory frameworks with a material impact on operations, compliance, trade, sustainability, or market access are analyzed in detail.
Chapter 4. Key Investment Pockets & Opportunity Analysis
- 4.1 Dimethylformamide Market Attractiveness Analysis
- 4.1.1 By Region – Investment Attractiveness Matrix (Volume × CAGR)
- 4.2 Absolute Revenue Growth Opportunity
- 4.2.1 By Region – Absolute USD Growth Through 2032
- 4.3 Incremental Volume Opportunity
- 4.3.1 By Region – Incremental Volume Through 2032
- 4.3.2 Segment – Incremental Volume
- 4.4 Emerging Submarket Opportunity Deep Dive (Subject to Applicability)
- 4.5 Emerging Market Opportunity Scorecards
- 4.5.1 United States
- 4.5.2 Europe
- 4.5.3 Asia
- 4.5.4 Middle East & Africa
Note: Emerging Market Opportunity Scorecards will be included based on relevance and strategic importance. Regions listed are indicative and may vary depending on data availability and market dynamics.
Chapter 5. Dimethylformamide Import-Export Analysis & Trade Flows
- 5.1 Global Trade Overview
- 5.1.1 Global Export Value by Country (2024)
- 5.1.2 Global Export Volume by Country (2024)
- 5.1.3 Global Import Value by Country (2024)
- 5.1.4 Global Import Volume by Country (2024)
- 5.1.5 Net Trade Balance by Country (2024)
- 5.2 Export Analysis – Segment
- 5.2.1 Type 1 (HS Code)
- 5.2.2 Type 2 (HS Code)
- 5.2.3 Type 3 (HS Code)
- 5.2.4 Type 4 (HS Code)
- 5.2.5 Type 5 (HS Code)
- 5.3 Import Analysis – Segment
- 5.3.1 Type 1 (HS Code)
- 5.3.2 Type 2 (HS Code)
- 5.3.3 Type 3 (HS Code)
- 5.3.4 Type 4 (HS Code)
- 5.3.5 Type 5 (HS Code)
- 5.4 Average Unit Trade Prices
- 5.4.1 Average Export Price – Segment & Country
- 5.4.2 Average Import Price – Segment & Source Country
- 5.4.3 Price Trends (2024)
- 5.5 Key Trade Route Analysis
- 5.5.1 Trade Route 1
- 5.5.2 Trade Route 2
- 5.5.3 Trade Route 3
- 5.5.4 Trade Route 4
- 5.5.5 Trade Route 5
- 5.6 Trade Policy Impact Assessment
- 5.6.1 US Anti-Dumping & Section 301 Tariffs
- 5.6.2 EU Customs Union Impact
- 5.6.3 Major Free Trade Agreements
- 5.6.4 USMCA Rules of Origin
Note: Trade policy analysis will be included only where relevant to the Dimethylformamide market.
Chapter 6. Competitive Landscape & Company Benchmarking
- 6.1 Dimethylformamide Market Concentration & Structure
- 6.1.1 Herfindahl-Hirschman Index (HHI) – vs. 2024
- 6.1.2 Tier 1, Tier 2 & Tier 3 Market Structure
- 6.1.3 Global, Regional & Local Player Dynamics
- 6.2 Dimethylformamide Market Share Analysis – 2024
- 6.2.1 Global Revenue Share by Company
- 6.2.2 Global Volume Share by Company
- 6.2.3 Regional Revenue Share
- 6.2.4 Market Share Evolution ( vs. 2024)
- 6.2.5 OEM Segment Share by Company
- 6.2.6 Replacement Segment Share by Company
- 6.3 Production/Delivery Capacity & Facility Analysis
- 6.3.1 Global Installed Capacity
- 6.3.2 Capacity Utilization Rates
- 6.3.3 Production/Output Volume
- 6.3.4 Facility Locations & Capacity Map
- 6.3.5 Planned Capacity Additions
- 6.4 Dimethylformamide Competitive Benchmarking Matrix
- 6.4.1 Revenue, Volume, CAGR & Profitability Comparison
- 6.4.2 Channel Revenue Mix
- 6.4.3 Geographic Revenue Exposure
- 6.4.4 R&D Intensity
- 6.4.5 Sustainability Maturity
- 6.5 Strategic Developments in Dimethylformamide (Last 24 Months)
- 6.5.1 Mergers, Acquisitions & Divestments
- 6.5.2 New Dimethylformamide Launches
- 6.5.3 Facility Expansions
- 6.5.4 Strategic Alliances, Joint Ventures & Partnerships
- 6.5.5 Distribution Expansion & Market Entry
- 6.5.6 Sustainability & ESG Initiatives
- 6.6 Competitive Strategy Mapping
- 6.6.1 Leader, Challenger, Follower & Niche Classification
- 6.6.2 Pricing Strategy Comparison
- 6.6.3 Channel Strategy Matrix
Note: Strategic developments are included based on their materiality and the availability of reliable information.
Chapter 7. Global Dimethylformamide Market – By Distribution Channel
- 7.1 Segment Overview
- 7.1.1 Volume & Revenue Split by Channel (2024 & 2032)
- 7.1.2 Channel Mix Evolution (2024-2032)
Chapter 8. Regional Market Analysis – Global Overview
- 8.1 Global Regional Overview
- 8.1.1 Regional Volume Share
- 8.1.2 Regional Revenue Share
- 8.1.3 Regional Volume by Region
- 8.1.4 Regional Revenue by Region
- 8.1.5 Regional Forecast Through 2032
- 8.2 Cross-Regional Segment Analysis
- 8.2.1 By Distribution Channel
- 8.2.2 By Brand/Price Tier
Chapter 9. North America Dimethylformamide Market
- 9.1 United States
- 9.2 Canada
- 9.3 Mexico
Chapter 10. Europe Dimethylformamide Market
- 10.1 Germany
- 10.2 France
- 10.3 Italy
- 10.4 United Kingdom
- 10.5 Spain
- 10.6 Poland
- 10.7 Russia
- 10.8 Netherlands
- 10.9 Belgium
- 10.10 Sweden
- 10.11 Denmark
- 10.12 Norway
- 10.13 Rest of Europe
Chapter 11. Asia Pacific Dimethylformamide Market
- 11.1 China
- 11.2 India
- 11.3 Japan
- 11.4 South Korea
- 11.5 Thailand
- 11.6 Indonesia
- 11.7 Vietnam
- 11.8 Malaysia
- 11.9 Australia
- 11.10 Rest of Asia Pacific
Chapter 12. Latin America Dimethylformamide Market
- 12.1 Brazil
- 12.2 Argentina
- 12.3 Colombia
- 12.4 Chile
- 12.5 Rest of Latin America
Chapter 13. Middle East Dimethylformamide Market
- 13.1 Saudi Arabia
- 13.2 United Arab Emirates
- 13.3 Turkey
- 13.4 Israel
- 13.5 Iran
- 13.6 Rest of the Middle East
Chapter 14. Africa Dimethylformamide Market
- 14.1 South Africa
- 14.2 Egypt
- 14.3 Nigeria
- 14.4 Morocco
- 14.5 Rest of Africa
Chapter 15. Dimethylformamide Company Profiles
- 15.1 [Company 01]
- 15.1.1 Company Overview
- 15.1.2 Key Management Personnel
- 15.1.3 Products & Services Portfolio
- 15.1.4 Financial Performance
- 15.1.5 Key Market Focus & Geographic Presence
- 15.1.6 Recent Developments & Strategic Initiatives
Note: The company profile list is preliminary and may change based on research findings, market developments, data availability, and client requirements.
Chapter 16. Appendices
- Appendix A – List of Abbreviations & Acronyms
- Appendix B – Industry Classification Code Reference – Full Series
- Appendix C – Production & Capacity Data Tables
- Appendix D – End-Use & Demand Base Tables
- Appendix E – Consumption & Replacement Rate Assumptions
- Appendix F – ASP Reference Tables
- Appendix G – Manufacturing & Facility Database
- Appendix H – Import-Export Data Tables
- Appendix I – Regulatory Summary Tables
- Appendix J – Primary Research Participant List (Anonymized)
- Appendix K – Primary Research Questionnaire Framework
- Appendix L – Data Sources & Bibliography
- Appendix M – Market Size Divergence & Source Comparison
Chapter 17. Research Methodology
- 17.1 Research Framework & Philosophy
- 17.2 Secondary Research – Sources, Hierarchy & Data Extraction
- 17.3 Data Modeling – Bottom-Up & Top-Down Market Sizing
- 17.4 Primary Research – Stakeholder Framework, LOI & Sample Sizes
- 17.5 Forecast Methodology – Regression, Scenario & Sensitivity Analysis
- 17.6 Quality Control – Four-Layer Validation Framework
- 17.7 Limitations & Standard Assumptions
- 17.8 Disclaimer
