
Nitinol Market Overview:
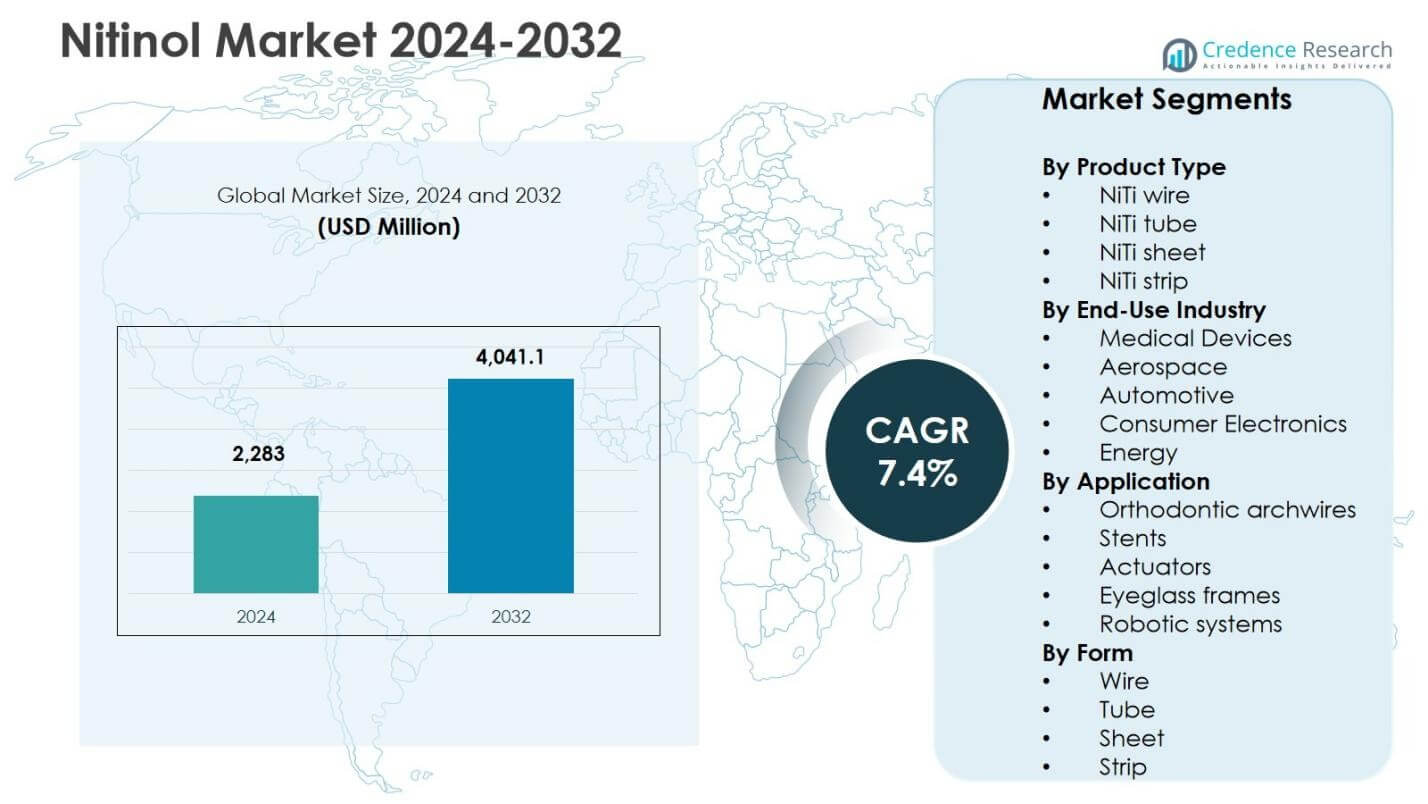
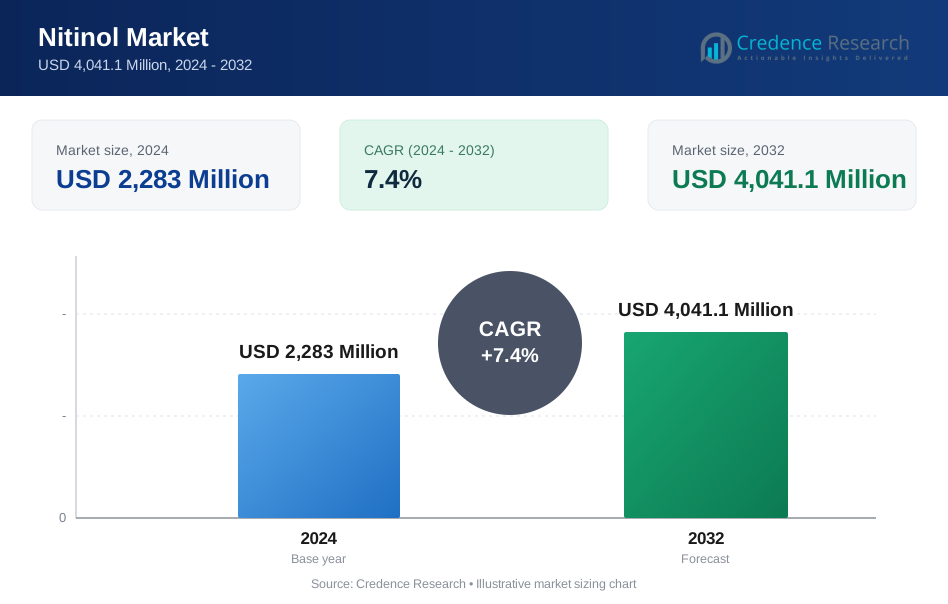
Nitinol Market size was valued USD 2,283 Million in 2024 and is anticipated to reach USD 4,041.1 Million by 2032, at a CAGR of 7.4% during the forecast period.
| REPORT ATTRIBUTE | DETAILS |
|---|---|
| Historical Period | 2020-2023 |
| Base Year | 2024 |
| Forecast Period | 2025-2032 |
| Nitinol Market Size 2024 | USD 2,283 million |
| Nitinol Market, CAGR | 7.4% |
| Nitinol Market Size 2032 | USD 4,041.1 million |
Nitinol Market Insights
- The market is driven by rising use of Nitinol in minimally invasive cardiovascular and orthopedic implants, with the Medical Devices segment holding 58.7% share in 2024 as demand for stents, guidewires, and orthodontic systems continues to expand across clinical applications.
- Market trends reflect increasing adoption of shape-memory alloys in robotics, aerospace actuation systems, and precision engineering, while growing R&D investments support development of advanced NiTi wire and tube products that accounted for 46.2% share within product categories.
- Industry dynamics are influenced by innovation-focused strategies among leading manufacturers emphasizing product quality, alloy reliability, and technology integration across manufacturing ecosystems to strengthen application growth in healthcare and industrial sectors.
- Regional growth is led by North America with 37.6% share in 2024, followed by Europe at 28.4% and Asia-Pacific at 24.1%, driven by strong healthcare infrastructure, rising production capacity, and increasing technological adoption across key end-use industries.
Nitinol Market Segmentation Analysis:
By Product Type
In the Nitinol Market, NiTi wire emerged as the dominant product type in 2024, accounting for 46.2% market share, driven by its widespread use in minimally invasive medical devices, orthodontic systems, and precision actuators. Its superior superelasticity, fatigue resistance, and biocompatibility support increasing adoption in stents, guidewires, and robotic mechanisms. NiTi tube followed due to demand in catheter systems and endovascular implants, while NiTi sheet and strip gained traction in industrial automation and consumer electronics as manufacturers leverage shape-memory capabilities for lightweight functional components across engineered assemblies.
- For instance, Vascotube supplies Nitinol tubing for catheter reinforcement and endovascular applications like neurovascular stents, achieving outer diameters up to 16 mm through precision manufacturing for consistent durability.
By End-Use Industry
The Medical Devices segment dominated the Nitinol Market in 2024 with a 58.7% market share, supported by expanding usage in cardiovascular implants, orthopedic fixation systems, orthodontic wires, and minimally invasive surgical instruments. Rising procedure volumes, aging demographics, and preference for shape-memory alloys in flexible, patient-safe devices accelerated demand. The Aerospace and Automotive segments demonstrated steady uptake for lightweight actuation and vibration-control components, while Consumer Electronics and Energy applications advanced as manufacturers integrated Nitinol into smart mechanisms, micro-actuators, and temperature-responsive assemblies to enhance performance, durability, and design efficiency.
- For instance, in Aerospace, Nitinol actuators from suppliers like Memry Corporation enable morphing wing structures and vibration damping in aircraft for optimized aerodynamics.
By Application
Within the application landscape, Stents represented the leading segment in 2024 with a 41.5% market share, propelled by the growing adoption of self-expanding vascular and peripheral stents that leverage Nitinol’s superelasticity, corrosion resistance, and shape-recovery behavior for reliable device deployment. Orthodontic archwires contributed significantly due to consistent clinical preference for flexible wire performance, while Actuators and Robotic systems gained traction in precision engineering and automation. Eyeglass frames maintained a niche presence, supported by consumer demand for durability and shape-retention features in premium, lightweight eyewear designs.
Key Growth Drivers
Rising Adoption of Minimally Invasive and Implantable Medical Devices
The Nitinol Market is experiencing strong growth due to its expanding use in minimally invasive and implantable medical devices, particularly in cardiovascular, orthopedic, and orthodontic applications. Healthcare providers increasingly prefer Nitinol-based stents, guidewires, fixation devices, and archwires because of the alloy’s superelasticity, biocompatibility, fatigue resistance, and ability to recover shape under physiological stress. The rising burden of cardiovascular disorders, growth in aging populations, and increasing volume of surgical interventions further strengthen demand. In addition, continuous improvements in device engineering and regulatory approvals for advanced Nitinol implants are reinforcing its role as a preferred material in next-generation medical technologies.
- For instance, DePuy Synthes offers Nitinol staples like Speed, Speed Shift, Speed Arc, Speed Titan, Speed Triad, and Elite for small bone fixation in foot, ankle, hand, and trauma surgery, providing continuous active compression during healing.
Growth of Smart Materials in Aerospace, Robotics, and Industrial Automation
The growing adoption of smart materials across aerospace, robotics, and industrial automation is a key driver for the Nitinol Market. Shape-memory and actuation capabilities enable manufacturers to integrate Nitinol into lightweight adaptive structures, precision control systems, vibration-damping mechanisms, and robotic actuators. Industries increasingly prioritize energy-efficient, compact, and responsive materials, and Nitinol fulfills these performance expectations more effectively than conventional metals. Expanding investments in advanced manufacturing, unmanned systems, and aerospace innovation are accelerating material substitution trends. The shift toward intelligent components in automation and robotics is further strengthening Nitinol’s positioning as a strategic functional material in engineering and motion-control applications.
- For instance, Kellogg's Research Labs uses superelastic Nitinol Belleville washers in industrial systems for vibration damping, combining titanium's strength with silicone-like effectiveness to flatten large-amplitude vibrations.
Increasing Focus on Material Innovation and Precision Manufacturing Capabilities
Continuous advancements in material processing, precision manufacturing, and metallurgical engineering are significantly contributing to market expansion. Improvements in Nitinol melting, heat treatment, machining, and surface finishing technologies are enhancing product consistency, performance reliability, and application versatility across industries. Manufacturers are increasingly investing in R&D to develop customized Nitinol alloys with controlled transformation temperatures, improved durability, and higher fatigue resistance. The integration of additive manufacturing, micro-fabrication, and laser-processing techniques is also enabling greater design flexibility and miniaturization of components. These technological enhancements are supporting broader commercialization opportunities and strengthening the adoption of Nitinol in both medical and industrial innovation pipelines.
Key Trends & Opportunities
Expansion of Nitinol Applications in Emerging Consumer and Electronics Markets
A major trend shaping the Nitinol Market is the expansion of its applications beyond traditional medical and industrial domains into emerging consumer and electronics markets. The material is increasingly incorporated into smart wearable components, precision eyeglass frames, micro-actuators, and compact motion-control systems to enhance durability, flexibility, and functional responsiveness. Miniaturization trends and the rise of smart consumer products create opportunities for Nitinol integration in adaptive hinges, responsive connectors, and temperature-responsive mechanisms. Growing interest in premium, high-performance consumer technologies further supports market potential, encouraging manufacturers to explore diversified product portfolios and value-added applications that leverage Nitinol’s unique functional capabilities.
- For instance, Flexon eyewear by Marchon utilizes NiTiNOL, a shape memory alloy of titanium and nickel, in its frames. These frames return to their original shape after being bent or twisted, offering superior durability compared to conventional metals.
Strategic Collaborations, R&D Investments, and Manufacturing Capacity Expansion
The market is witnessing increasing opportunities arising from strategic collaborations among material suppliers, medical device companies, and engineering firms focused on advancing Nitinol-based solutions. Companies are expanding R&D investments to optimize alloy performance, develop application-specific grades, and strengthen regulatory compliance for medical and aerospace applications. At the same time, manufacturers are scaling production capacities and strengthening supply chains to address rising global demand. Partnerships with research institutions and technology developers are enabling innovation in product design, fatigue modeling, and lifecycle performance. These collaborative initiatives are accelerating commercialization timelines and opening new avenues for Nitinol deployment across high-value, technology-driven industries.
- For instance, Confluent Medical Technologies formed a strategic partnership with ATI Specialty Alloys, investing over $50 million in melt and conversion infrastructure. This collaboration aims for a 300% capacity increase by 2027 and positions Confluent as the exclusive fulfillment partner for ATI's medical Nitinol, enhancing supply chain reliability for medical devices.
Key Challenges
High Material and Processing Costs Impacting Large-Scale Adoption
One of the major challenges in the Nitinol Market is the high cost associated with raw materials, precision processing, and specialized manufacturing techniques. The complex thermo-mechanical treatment and stringent quality control requirements significantly increase production expenses compared with conventional alloys. These cost constraints limit broader penetration in cost-sensitive industries and restrict adoption in mass manufacturing environments. Additionally, fluctuations in nickel prices and supply-chain dependencies further impact pricing stability. Manufacturers must balance performance benefits with economic feasibility, and many end users continue to evaluate alternative materials when budget limitations outweigh functional advantages, particularly in non-critical and high-volume applications.
Technical Complexity, Design Limitations, and Performance Reliability Concerns
The technical complexity of working with Nitinol presents another key challenge, particularly in terms of design predictability, fatigue behavior, and transformation-temperature control. Variations in processing conditions can affect performance consistency, requiring specialized expertise in metallurgy and component engineering. Long-term durability validation, regulatory testing, and certification processes remain demanding, especially for implantable medical and aerospace components. Mechanical property sensitivity and limited recyclability also pose engineering and sustainability constraints. These challenges increase development timelines and create barriers to entry for new market participants, reinforcing the need for advanced modeling tools, process optimization, and deeper material-science understanding across the value chain.
Regional Analysis
North America
North America held a leading position in the Nitinol Market in 2024, accounting for 37.6% market share, driven by strong demand from the medical device sector, particularly in cardiovascular and orthopedic implant applications. The region benefits from advanced healthcare infrastructure, high procedure volumes, and strong clinical adoption of minimally invasive technologies. Major manufacturing hubs in the U.S. support innovation in stents, guidewires, orthodontic products, and precision actuators. Robust R&D investments, presence of key material suppliers, and supportive regulatory approvals further strengthen regional growth, while ongoing commercialization of next-generation implantable and robotic systems continues to expand application potential for Nitinol-based components.
Europe
Europe captured 28.4% market share in the Nitinol Market in 2024, supported by established medical device manufacturing, strong clinical adoption of vascular implants, and growing integration of shape-memory alloys in aerospace and industrial engineering applications. Countries such as Germany, France, and the United Kingdom play a central role in research and precision manufacturing of Nitinol components for healthcare and automation technologies. Rising investments in robotic surgery, advanced orthodontic systems, and minimally invasive treatment solutions continue to support demand. Increasing collaboration between research institutes and commercial producers further enhances material innovation, strengthening Europe’s contribution to product development and application diversification.
Asia-Pacific
Asia-Pacific accounted for 24.1% market share in 2024 and represents the fastest-growing regional market due to increasing medical device production, expanding healthcare expenditure, and rapid industrial development across China, Japan, South Korea, and India. The region is witnessing rising adoption of Nitinol in cardiovascular implants, orthodontic devices, consumer electronics, and robotic automation systems. Government support for local manufacturing, growing availability of advanced fabrication technologies, and strengthening export capabilities contribute to market expansion. Increasing patient access to minimally invasive procedures and continued investments in precision engineering and smart material applications further enhance Asia-Pacific’s strategic role in the global Nitinol supply and demand landscape.
Latin America
Latin America recorded 5.6% market share in the Nitinol Market in 2024, driven primarily by gradual growth in medical device imports, rising procedure volumes, and increasing presence of minimally invasive treatment solutions in countries such as Brazil, Mexico, and Argentina. Demand for Nitinol-based cardiovascular and orthodontic products is strengthening as healthcare infrastructure modernizes and awareness of advanced implant technologies expands. However, limited manufacturing capabilities and dependency on international suppliers constrain large-scale adoption. Ongoing investments in regional healthcare services, strengthening partnerships with global device manufacturers, and rising interest in precision engineering applications are expected to support steady future development of Nitinol usage in the region.
Middle East & Africa
The Middle East & Africa region accounted for 4.3% market share in 2024, with growth supported by improving healthcare infrastructure, increasing adoption of advanced cardiovascular implants, and rising demand for minimally invasive medical procedures in Gulf economies. The market is largely import-driven, with Nitinol components primarily sourced from global manufacturers for use in specialized medical centers and high-end treatment facilities. Ongoing expansion of private healthcare networks, increasing investments in medical technology, and gradual development of industrial automation applications are contributing to demand. However, limited local production capabilities and price sensitivity continue to moderate large-scale penetration of Nitinol-based solutions across the region.
Nitinol Market Segmentations:
By Product Type
- NiTi wire
- NiTi tube
- NiTi sheet
- NiTi strip
By End-Use Industry
- Medical Devices
- Aerospace
- Automotive
- Consumer Electronics
- Energy
By Application
- Orthodontic archwires
- Stents
- Actuators
- Eyeglass frames
- Robotic systems
By Form
- Wire
- Tube
- Sheet
- Strip
By Geography
- North America
- U.S.
- Canada
- Mexico
- Europe
- Germany
- France
- U.K.
- Italy
- Spain
- Rest of Europe
- Asia Pacific
- China
- Japan
- India
- South Korea
- South-east Asia
- Rest of Asia Pacific
- Latin America
- Brazil
- Argentina
- Rest of Latin America
- Middle East & Africa
- GCC Countries
- South Africa
- Rest of the Middle East and Africa
Competitive Landscape
Competitive landscape analysis in the Nitinol Market features leading players such as Abbott Laboratories, Medtronic plc, Boston Scientific Corporation, B. Braun SE, Arthrex Inc., Cook Medical Inc., Carpenter Technology Corporation, Hitachi Metals Ltd., Nippon Steel Corporation, and Becton, Dickinson and Company (C. R. Bard), who collectively shape product innovation, manufacturing capabilities, and application expansion across medical and industrial sectors. The market remains moderately consolidated, with medical device manufacturers accounting for a significant share of demand through cardiovascular stents, guidewires, orthodontic systems, and minimally invasive implants. Material producers focus on alloy purity, fatigue resistance, and transformation-temperature control, while device companies emphasize performance reliability, regulatory approvals, and clinical adoption. Strategic priorities include capacity expansion, product customization, and partnerships between material suppliers and OEMs to improve supply-chain stability and application-specific engineering. Rising investments in R&D, additive manufacturing, and precision processing further intensify competition as companies pursue technological differentiation and broader commercialization of advanced Nitinol-based solutions.
Key Player Analysis
- Cook Medical, Inc.
- Hitachi Metals, Ltd.
- Arthrex Inc.
- Nippon Steel Corporation
- Medtronic plc
- Boston Scientific Corporation
- B. Braun SE
- Carpenter Technology Corporation
- Abbott Laboratories
- Becton, Dickinson and Company (C. R. Bard)
Recent Developments
- In May 2025, Resonetics acquired the Nitinol gun drilling operations and assets from Medical Component Specialists in New Boston, NH, to enhance tubing capabilities and reduce supply chain risks for medical devices.
- In April 2025, Medline UNITE received FDA 510(k) clearance for its REFLEX® HYBRID Nitinol Implant System for foot and ankle surgery, expanding its Nitinol-based surgical offerings.
- In 2025, Fort Wayne Metals and partners launched the PRIME supply chain initiative to advance Nitinol materials and strengthen supply chain resilience to meet rising market demand.
Report Coverage
The research report offers an in-depth analysis based on Product Type, End Use Industry, Appllication, Form and Geography. It details leading market players, providing an overview of their business, product offerings, investments, revenue streams, and key applications. Additionally, the report includes insights into the competitive environment, SWOT analysis, current market trends, as well as the primary drivers and constraints. Furthermore, it discusses various factors that have driven market expansion in recent years. The report also explores market dynamics, regulatory scenarios, and technological advancements that are shaping the industry. It assesses the impact of external factors and global economic changes on market growth. Lastly, it provides strategic recommendations for new entrants and established companies to navigate the complexities of the market.
Future Outlook
- The market will experience sustained growth as demand for minimally invasive cardiovascular and orthopedic implants continues to rise worldwide.
- Manufacturers will expand investments in precision processing technologies to enhance fatigue performance and reliability of Nitinol components.
- Medical device companies will increasingly adopt Nitinol for next-generation stents, guidewires, and orthodontic systems to improve procedural outcomes.
- Aerospace, robotics, and automation sectors will broaden the use of shape-memory alloys in smart actuation, control systems, and adaptive structures.
- Research initiatives will focus on developing customized alloy grades with improved transformation stability and resistance to mechanical stress.
- Strategic collaborations between material producers and device OEMs will strengthen innovation pipelines and accelerate product commercialization.
- Emerging applications in consumer electronics and wearable devices will create new opportunities for small-scale actuators and flexible mechanisms.
- Regional manufacturing expansion in Asia-Pacific will play a key role in strengthening global supply capabilities and cost competitiveness.
- Digital simulation, fatigue modeling, and additive manufacturing technologies will support greater design accuracy and miniaturization of components.
- Sustainability considerations and long-term material lifecycle optimization will influence future product development and regulatory priorities.
Request a Free Sample
Fill in your details and we'll send you a free sample report.
- Sample data tables & charts
- Research methodology
Need a Custom Version of This Report?
Tailor the scope, geography, or segments to your exact requirements.
- Custom geography or segment scope
- Direct access to our analyst team
Frequently Asked Questions
What is the current market size for Nitinol Market, and what is its projected size in 2032?
At what Compound Annual Growth Rate is the Nitinol Market projected to grow between 2024 and 2032?
Which Nitinol Market segment held the largest share in 2024?
What are the primary factors fueling the growth of the Nitinol Market?
Who are the leading companies in the Nitinol Market?
Which region commanded the largest share of the Nitinol Market in 2024?
Table of Content
Chapter 1. Report Introduction
- 1.1 Report Description & Purpose
- 1.1.1 Report Title & Market Definition
- 1.1.2 Unique Selling Propositions (USP) & Key Differentiators
- 1.1.3 Value Proposition for Stakeholders
- 1.2 Research Objectives
- 1.2.1 Market Sizing Objectives (Volume & Revenue)
- 1.2.2 Segmentation Objectives
- 1.2.3 Competitive Intelligence Objectives
- 1.2.4 Forecast & Scenario Objectives
- 1.3 Report Scope
- 1.3.1 Nitinol Scope – Types & Subtypes Covered
- 1.3.2 Geographic Scope – Regions & Countries Covered
- 1.3.3 Historical Period, Base Year & Forecast Period (2024; forecast to 2032)
- 1.3.4 Inclusions & Exclusions
- 1.4 HS Code & Classification Framework
- 1.5 Currency, Units & Pricing Basis
- 1.6 Target Stakeholders
- 1.7 Limitations & Assumptions
Chapter 2. Executive Summary
- 2.1 Global Nitinol Market Snapshot
- 2.1.1 Market Size – Historical (2024) & Forecast (2024-2032) (2024: USD 2,283 Million → 2032: USD 4,041.1 Million)
- 2.1.2 Volume & Revenue – Global Totals
- 2.1.3 Key Market Highlights – Top Five Facts
- 2.2 Nitinol Market Segmentation Snapshot
- 2.2.1 Market Split by Region – 2024 vs. 2032
- 2.3 Competitive Snapshot
- 2.3.1 Top 10 Players by Revenue Share – 2024
- 2.3.2 Top 10 Players by Volume Share – 2024
- 2.3.3 Recent Strategic Developments (18-Month Summary)
- 2.4 Key Investment Highlights & Strategic Conclusions
Chapter 3. Nitinol Market Dynamics & Industry Analysis
- 3.1 Market Overview & Context
- 3.1.1 Nitinol Market Position in the Broader Automotive Value Chain
- 3.1.2 OEM vs. Replacement Market Dynamics
- 3.1.3 Market Maturity & Development Stage by Region
- 3.2 Nitinol Market Drivers
- 3.3 Nitinol Market Restraints & Challenges
- 3.4 Nitinol Market Opportunities
- 3.5 Porter's Five Forces Analysis
- 3.5.1 Threat of New Entrants
- 3.5.2 Bargaining Power of Suppliers
- 3.5.3 Bargaining Power of Buyers
- 3.5.4 Threat of Substitutes
- 3.5.5 Competitive Rivalry – Intensity Assessment
- 3.6 Nitinol Value Chain Analysis
- 3.6.1 Upstream – Raw Material/Input Suppliers
- 3.6.1.1 Raw Material/Input 1
- 3.6.1.2 Raw Material/Input 2
- 3.6.1.3 Raw Material/Input 3
- 3.6.2 Midstream – Production/Manufacturing/Service Delivery
- 3.6.2.1 Production/Process Overview
- 3.6.2.2 Key Facility Locations & Capacity by Manufacturer
- 3.6.3 Downstream – Distribution & End Consumer
- 3.6.3.1 Primary Channel – B2B/OEM
- 3.6.3.2 Secondary Channels – Dealer, Retail, Online, Direct
- 3.6.4 Value Chain Profitability Analysis
- 3.6.1 Upstream – Raw Material/Input Suppliers
- 3.7 PESTEL Analysis
- 3.7.1 Political Factors
- 3.7.2 Economic Factors
- 3.7.3 Social Factors
- 3.7.4 Technological Factors
- 3.7.5 Environmental Factors
- 3.7.6 Legal Factors
- 3.8 Nitinol Supply Chain Analysis
- 3.8.1 Raw Material/Input Supply Risk Assessment
- 3.8.2 Manufacturing Concentration Risk (Geographic Exposure)
- 3.8.3 Trade Disruption Impact Analysis
- 3.9 Regulatory & Policy Landscape
Note: The regulatory and policy landscape section covers regulations based on their applicability to the market, Nitinol category, geography, and scope of the study. Only regulatory frameworks with a material impact on operations, compliance, trade, sustainability, or market access are analyzed in detail.
Chapter 4. Key Investment Pockets & Opportunity Analysis
- 4.1 Nitinol Market Attractiveness Analysis
- 4.1.1 By Region – Investment Attractiveness Matrix (Volume × CAGR)
- 4.2 Absolute Revenue Growth Opportunity
- 4.2.1 By Region – Absolute USD Growth Through 2032
- 4.3 Incremental Volume Opportunity
- 4.3.1 By Region – Incremental Volume Through 2032
- 4.3.2 Segment – Incremental Volume
- 4.4 Emerging Submarket Opportunity Deep Dive (Subject to Applicability)
- 4.5 Emerging Market Opportunity Scorecards
- 4.5.1 United States
- 4.5.2 Europe
- 4.5.3 Asia
- 4.5.4 Middle East & Africa
Note: Emerging Market Opportunity Scorecards will be included based on relevance and strategic importance. Regions listed are indicative and may vary depending on data availability and market dynamics.
Chapter 5. Nitinol Import-Export Analysis & Trade Flows
- 5.1 Global Trade Overview
- 5.1.1 Global Export Value by Country (2024)
- 5.1.2 Global Export Volume by Country (2024)
- 5.1.3 Global Import Value by Country (2024)
- 5.1.4 Global Import Volume by Country (2024)
- 5.1.5 Net Trade Balance by Country (2024)
- 5.2 Export Analysis – Segment
- 5.2.1 Type 1 (HS Code)
- 5.2.2 Type 2 (HS Code)
- 5.2.3 Type 3 (HS Code)
- 5.2.4 Type 4 (HS Code)
- 5.2.5 Type 5 (HS Code)
- 5.3 Import Analysis – Segment
- 5.3.1 Type 1 (HS Code)
- 5.3.2 Type 2 (HS Code)
- 5.3.3 Type 3 (HS Code)
- 5.3.4 Type 4 (HS Code)
- 5.3.5 Type 5 (HS Code)
- 5.4 Average Unit Trade Prices
- 5.4.1 Average Export Price – Segment & Country
- 5.4.2 Average Import Price – Segment & Source Country
- 5.4.3 Price Trends (2024)
- 5.5 Key Trade Route Analysis
- 5.5.1 Trade Route 1
- 5.5.2 Trade Route 2
- 5.5.3 Trade Route 3
- 5.5.4 Trade Route 4
- 5.5.5 Trade Route 5
- 5.6 Trade Policy Impact Assessment
- 5.6.1 US Anti-Dumping & Section 301 Tariffs
- 5.6.2 EU Customs Union Impact
- 5.6.3 Major Free Trade Agreements
- 5.6.4 USMCA Rules of Origin
Note: Trade policy analysis will be included only where relevant to the Nitinol market.
Chapter 6. Competitive Landscape & Company Benchmarking
- 6.1 Nitinol Market Concentration & Structure
- 6.1.1 Herfindahl-Hirschman Index (HHI) – vs. 2024
- 6.1.2 Tier 1, Tier 2 & Tier 3 Market Structure
- 6.1.3 Global, Regional & Local Player Dynamics
- 6.2 Nitinol Market Share Analysis – 2024
- 6.2.1 Global Revenue Share by Company
- 6.2.2 Global Volume Share by Company
- 6.2.3 Regional Revenue Share
- 6.2.4 Market Share Evolution ( vs. 2024)
- 6.2.5 OEM Segment Share by Company
- 6.2.6 Replacement Segment Share by Company
- 6.3 Production/Delivery Capacity & Facility Analysis
- 6.3.1 Global Installed Capacity
- 6.3.2 Capacity Utilization Rates
- 6.3.3 Production/Output Volume
- 6.3.4 Facility Locations & Capacity Map
- 6.3.5 Planned Capacity Additions
- 6.4 Nitinol Competitive Benchmarking Matrix
- 6.4.1 Revenue, Volume, CAGR & Profitability Comparison
- 6.4.2 Channel Revenue Mix
- 6.4.3 Geographic Revenue Exposure
- 6.4.4 R&D Intensity
- 6.4.5 Sustainability Maturity
- 6.5 Strategic Developments in Nitinol (Last 24 Months)
- 6.5.1 Mergers, Acquisitions & Divestments
- 6.5.2 New Nitinol Launches
- 6.5.3 Facility Expansions
- 6.5.4 Strategic Alliances, Joint Ventures & Partnerships
- 6.5.5 Distribution Expansion & Market Entry
- 6.5.6 Sustainability & ESG Initiatives
- 6.6 Competitive Strategy Mapping
- 6.6.1 Leader, Challenger, Follower & Niche Classification
- 6.6.2 Pricing Strategy Comparison
- 6.6.3 Channel Strategy Matrix
Note: Strategic developments are included based on their materiality and the availability of reliable information.
Chapter 7. Global Nitinol Market – By Distribution Channel
- 7.1 Segment Overview
- 7.1.1 Volume & Revenue Split by Channel (2024 & 2032)
- 7.1.2 Channel Mix Evolution (2024-2032)
Chapter 8. Regional Market Analysis – Global Overview
- 8.1 Global Regional Overview
- 8.1.1 Regional Volume Share
- 8.1.2 Regional Revenue Share
- 8.1.3 Regional Volume by Region
- 8.1.4 Regional Revenue by Region
- 8.1.5 Regional Forecast Through 2032
- 8.2 Cross-Regional Segment Analysis
- 8.2.1 By Distribution Channel
- 8.2.2 By Brand/Price Tier
Chapter 9. North America Nitinol Market
- 9.1 United States
- 9.2 Canada
- 9.3 Mexico
Chapter 10. Europe Nitinol Market
- 10.1 Germany
- 10.2 France
- 10.3 Italy
- 10.4 United Kingdom
- 10.5 Spain
- 10.6 Poland
- 10.7 Russia
- 10.8 Netherlands
- 10.9 Belgium
- 10.10 Sweden
- 10.11 Denmark
- 10.12 Norway
- 10.13 Rest of Europe
Chapter 11. Asia Pacific Nitinol Market
- 11.1 China
- 11.2 India
- 11.3 Japan
- 11.4 South Korea
- 11.5 Thailand
- 11.6 Indonesia
- 11.7 Vietnam
- 11.8 Malaysia
- 11.9 Australia
- 11.10 Rest of Asia Pacific
Chapter 12. Latin America Nitinol Market
- 12.1 Brazil
- 12.2 Argentina
- 12.3 Colombia
- 12.4 Chile
- 12.5 Rest of Latin America
Chapter 13. Middle East Nitinol Market
- 13.1 Saudi Arabia
- 13.2 United Arab Emirates
- 13.3 Turkey
- 13.4 Israel
- 13.5 Iran
- 13.6 Rest of the Middle East
Chapter 14. Africa Nitinol Market
- 14.1 South Africa
- 14.2 Egypt
- 14.3 Nigeria
- 14.4 Morocco
- 14.5 Rest of Africa
Chapter 15. Nitinol Company Profiles
- 15.1 [Company 01]
- 15.1.1 Company Overview
- 15.1.2 Key Management Personnel
- 15.1.3 Products & Services Portfolio
- 15.1.4 Financial Performance
- 15.1.5 Key Market Focus & Geographic Presence
- 15.1.6 Recent Developments & Strategic Initiatives
Note: The company profile list is preliminary and may change based on research findings, market developments, data availability, and client requirements.
Chapter 16. Appendices
- Appendix A – List of Abbreviations & Acronyms
- Appendix B – Industry Classification Code Reference – Full Series
- Appendix C – Production & Capacity Data Tables
- Appendix D – End-Use & Demand Base Tables
- Appendix E – Consumption & Replacement Rate Assumptions
- Appendix F – ASP Reference Tables
- Appendix G – Manufacturing & Facility Database
- Appendix H – Import-Export Data Tables
- Appendix I – Regulatory Summary Tables
- Appendix J – Primary Research Participant List (Anonymized)
- Appendix K – Primary Research Questionnaire Framework
- Appendix L – Data Sources & Bibliography
- Appendix M – Market Size Divergence & Source Comparison
Chapter 17. Research Methodology
- 17.1 Research Framework & Philosophy
- 17.2 Secondary Research – Sources, Hierarchy & Data Extraction
- 17.3 Data Modeling – Bottom-Up & Top-Down Market Sizing
- 17.4 Primary Research – Stakeholder Framework, LOI & Sample Sizes
- 17.5 Forecast Methodology – Regression, Scenario & Sensitivity Analysis
- 17.6 Quality Control – Four-Layer Validation Framework
- 17.7 Limitations & Standard Assumptions
- 17.8 Disclaimer
