
Market Overview
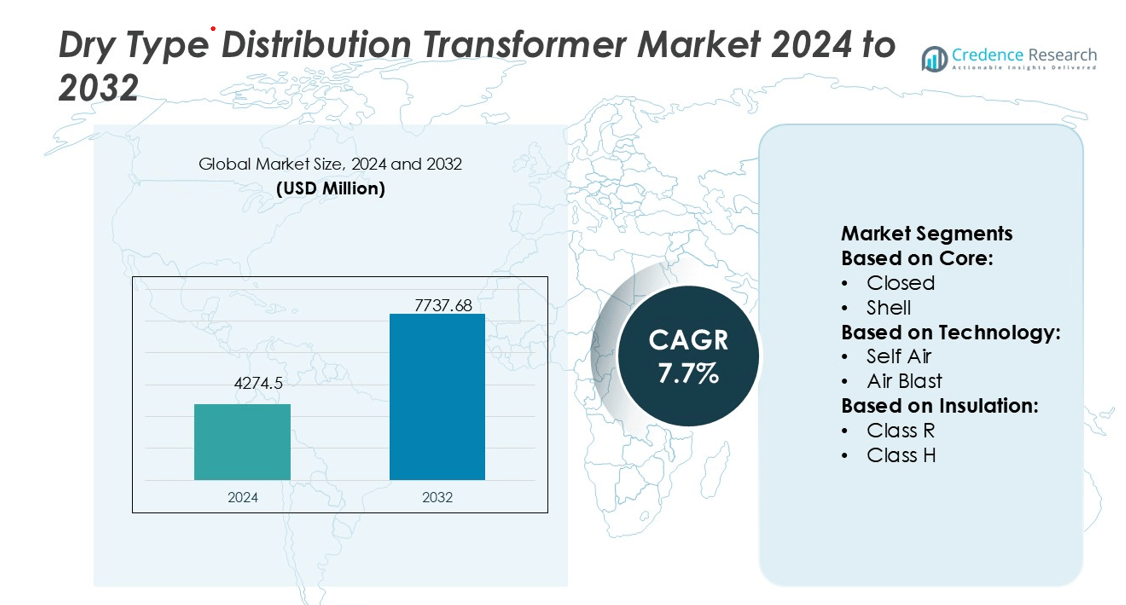
Dry Type Distribution Transformer Market size was valued USD 4274.5 million in 2024 and is anticipated to reach USD 7737.68 million by 2032, at a CAGR of 7.7% during the forecast period.
| REPORT ATTRIBUTE | DETAILS |
|---|---|
| Historical Period | 2020-2023 |
| Base Year | 2024 |
| Forecast Period | 2025-2032 |
| Dry Type Distribution Transformer Market Size 2024 | USD 4274.5 million |
| Dry Type Distribution Transformer Market, CAGR | 7.7% |
| Dry Type Distribution Transformer Market Size 2032 | USD 7737.68 million |
The Dry Type Distribution Transformer Market is shaped by major players such as ABB, Schneider Electric, Hitachi Energy Ltd., General Electric, Eaton, CG Power & Industrial Solutions Ltd., Crompton Greaves Consumer Electricals Limited, Bharat Heavy Electricals Limited (BHEL), Kirloskar Electric Company Limited, and Easun Reyrolle Limited. These companies emphasize product innovation, digital monitoring integration, and sustainable manufacturing practices to meet evolving energy efficiency standards. Strategic collaborations with utilities and industrial clients strengthen their market positions. Asia-Pacific leads the global market with a 34% share in 2024, driven by rapid industrialization, renewable energy expansion, and government-backed grid modernization programs, establishing the region as the key growth hub for dry type distribution transformers.
Market Insights
- The Dry Type Distribution Transformer Market was valued at USD 4274.5 million in 2024 and is projected to reach USD 7737.68 million by 2032, growing at a CAGR of 7.7% during the forecast period.
- Growing emphasis on energy efficiency, renewable integration, and eco-friendly designs drives strong adoption across industrial and commercial applications.
- Advancements in smart monitoring, IoT connectivity, and insulation technology are key trends enhancing operational reliability and performance.
- The market faces restraints from high initial costs and thermal limitations in high-voltage applications, restricting large-scale deployment.
- Asia-Pacific leads with a 34% share, followed by North America with 28% and Europe with 24%; the closed core segment dominates by design, supported by rising demand for safe, compact, and maintenance-free transformers across smart grid and renewable energy infrastructure projects.
Market Segmentation Analysis:
By Core
The closed core segment dominates the Dry Type Distribution Transformer Market with a 46% share in 2024. Its strong magnetic coupling and reduced leakage flux enable efficient energy transfer and minimal losses. Closed-core transformers are preferred for commercial and industrial applications where consistent voltage regulation is essential. The growing shift toward smart grids and renewable power integration boosts demand for compact, energy-efficient transformer cores. Manufacturers invest in advanced magnetic steel and vacuum casting processes to enhance thermal stability and performance reliability in varying load conditions.
- For instance, Hyosung Heavy Industries’ oil‑immersed transformers support voltage ratings up to 77 kV and power handling from 100 kVA to 80 MVA, and the company has shipped more than 150000 units to date.
By Technology
The self-air cooling segment leads the market with a 58% share in 2024, owing to its simple design, low maintenance, and reliable thermal performance. These transformers utilize natural air circulation for cooling, making them ideal for indoor and outdoor installations with limited ventilation. The increasing focus on eco-friendly and maintenance-free systems drives their adoption across utilities, commercial complexes, and industrial plants. Manufacturers are integrating IoT-enabled temperature sensors to monitor efficiency and extend operational lifespan, supporting their dominance over air-blast alternatives.
- For instance, Bharat Bijlee plans to boost transformer manufacturing capacity by 7,000 MVA at its Airoli facility in Navi Mumbai, raising total capacity from 28,000 MVA to 35,000 MVA. The board approved this expansion on August 25, 2025.
By Insulation
The Class F insulation segment holds the largest share of 41% in 2024, driven by its superior thermal endurance and safety compliance. Class F materials withstand temperatures up to 155°C, providing a balance between cost and durability for continuous operation in demanding environments. These transformers are widely used in manufacturing plants, renewable energy systems, and distribution substations. The rising adoption of fire-resistant epoxy resin and enhanced insulation coatings promotes reliability and extends service life, making Class F insulation the preferred choice for modern dry-type distribution transformers.
Key Growth Drivers
Rising Focus on Energy Efficiency and Grid Modernization
The global shift toward energy-efficient infrastructure drives demand for dry type distribution transformers. Governments and utilities are investing in smart grid modernization to reduce transmission losses and enhance energy reliability. Dry type transformers offer low maintenance, high efficiency, and safety advantages compared to oil-filled variants. Their fire-resistant design makes them suitable for densely populated and environmentally sensitive areas. Continuous upgrades in insulation materials and cooling systems further strengthen their adoption in sustainable energy distribution networks.
- For instance, GE’s transformer and grid‑support portfolio spans medium through ultra‑high voltage domains. They offer power transformers ranging from 5 MVA up to 2,750 MVA, and voltage capabilities from 1200 kV AC to ±1100 kV DC.
Expansion of Renewable Energy Integration
The growing renewable energy capacity, especially from solar and wind sources, accelerates the deployment of dry type distribution transformers. These transformers provide efficient voltage regulation and stability for distributed generation networks. Their ability to operate in fluctuating load environments aligns with renewable integration requirements. Governments worldwide are emphasizing green power infrastructure, leading to higher investments in dry type solutions. Manufacturers focus on developing compact, high-capacity transformers for renewable projects, ensuring reliability and minimal environmental impact.
- For instance, HPS unveiled EV Charging Distribution Transformers-three-phase units rated from 15 kVA up to 1000 kVA, with 220 °C insulation class (150 °C rise) and optional rugged 3RE+ enclosures tested to withstand blowing snow and rain at speeds up to 120 km/h.
Increasing Industrial and Commercial Power Demand
Rapid industrialization and urbanization across developing economies fuel the need for reliable and safe power distribution systems. Dry type distribution transformers are favored in commercial complexes, data centers, and healthcare facilities due to their non-flammable characteristics. The growing adoption of automation and electric-driven systems increases energy loads, requiring efficient and durable transformers. The segment benefits from rising construction of smart buildings and industrial parks, where energy reliability and operational safety remain key priorities for end users.
Key Trends & Opportunities
Adoption of Smart Monitoring and IoT Technologies
The integration of IoT-enabled monitoring systems and digital sensors is transforming transformer performance management. These technologies enable real-time tracking of temperature, load, and insulation health, improving maintenance efficiency and system reliability. Manufacturers are introducing smart transformers with cloud-based analytics and predictive diagnostics to minimize downtime. The trend toward digitalized energy infrastructure creates new opportunities for innovation in connected dry type transformer solutions.
- For instance, CG Power manufactures a wide spectrum of transformers, offering power transformers rated from 25 kVA to 1,500 MVA and voltage classes spanning 11 kV to 765 kV. The company also produces reactors, with a range of 10 MVAr to 125 MVAr, in voltage classes from 33 kV to 765 kV.
Development of High-Temperature and Compact Designs
The market is witnessing advancements in compact and high-temperature-resistant transformer designs. New insulation materials and thermal management techniques enhance performance under extreme environmental conditions. Compact dry type transformers are increasingly deployed in renewable installations, transport hubs, and space-constrained commercial buildings. This trend supports sustainability targets by reducing footprint and improving power density. Manufacturers leveraging advanced resin encapsulation and vacuum pressure impregnation technologies gain a competitive edge.
- For instance, Hyundai manufactures power transformers with ratings up to 1,500 MVA and voltage capability up to 800 kV-spanning generator step-up, transmission, and distribution transformers.
Growing Preference for Eco-Friendly and Fire-Safe Systems
Environmental regulations and safety standards encourage the shift from oil-filled to dry type transformers. These transformers eliminate the risk of oil leakage, fire hazards, and environmental contamination. Their suitability for indoor and underground applications offers significant advantages in urban energy systems. As global emission reduction goals intensify, the adoption of eco-friendly transformer materials and designs becomes a major opportunity for manufacturers to align with sustainability goals.
Key Challenges
High Initial Cost and Complex Manufacturing Process
Dry type distribution transformers involve higher production costs due to advanced insulation, vacuum casting, and cooling systems. These factors increase upfront investment compared to oil-filled alternatives, limiting adoption in cost-sensitive markets. Additionally, the manufacturing process demands specialized facilities and skilled labor. Small and medium-scale utilities often face budget constraints, which can restrict large-scale deployment despite long-term efficiency benefits.
Thermal Limitations and Restricted Power Range
While dry type transformers offer improved safety and environmental benefits, they face challenges in managing heat dissipation at higher capacities. The natural air or forced air cooling systems limit their performance beyond certain voltage levels. This restricts their use in heavy industrial or high-voltage transmission networks. Manufacturers are addressing this through material innovation and enhanced thermal design, but achieving cost-effective scalability remains a persistent technical challenge.
Regional Analysis
North America
North America holds a 28% share of the Dry Type Distribution Transformer Market in 2024. The region benefits from strong investments in grid modernization, renewable integration, and data center expansion. The United States leads with widespread adoption of energy-efficient transformers to comply with Department of Energy (DOE) standards. Canada follows, driven by infrastructure upgrades and urban electrification. Major manufacturers focus on introducing IoT-enabled monitoring systems and fire-resistant insulation solutions. The rising focus on replacing aging transformers and expanding electric vehicle charging infrastructure supports steady market growth across the region.
Europe
Europe accounts for a 24% market share in 2024, driven by strict environmental regulations and sustainability goals. Countries such as Germany, France, and the United Kingdom lead in adopting dry type transformers across renewable power grids and smart city projects. The region’s focus on reducing carbon emissions encourages the replacement of oil-filled transformers with eco-friendly alternatives. European Union directives promoting green infrastructure investments further boost demand. The market also benefits from technological advancements in cast resin insulation and compact transformer design suited for urban energy systems.
Asia-Pacific
Asia-Pacific dominates the global market with a 34% share in 2024, driven by rapid industrialization and rising electricity consumption in China, India, Japan, and South Korea. Government initiatives supporting renewable integration and smart grid deployment stimulate large-scale adoption. China leads production and export, supported by strong manufacturing capabilities and expanding renewable capacity. India experiences growth through rural electrification and industrial corridor development. The region’s focus on safety, efficiency, and local manufacturing expansion strengthens the dominance of dry type distribution transformers in both utility and industrial sectors.
Latin America
Latin America captures a 7% market share in 2024, with growth led by Brazil, Mexico, and Chile. The region’s increasing renewable energy projects, particularly solar and wind, enhance demand for dry type transformers. Governments are prioritizing grid reliability and rural electrification programs. Manufacturers are entering strategic partnerships to supply cost-efficient, maintenance-free transformers suitable for diverse climates. Brazil’s industrial modernization and Chile’s mining sector electrification contribute significantly. Despite economic fluctuations, investments in sustainable infrastructure and smart distribution networks continue to support moderate market growth in the region.
Middle East & Africa
The Middle East & Africa region holds a 7% share of the market in 2024, supported by power infrastructure expansion and urban development projects. The Gulf nations are investing heavily in smart grid systems and commercial buildings requiring fire-safe transformers. In Africa, countries such as South Africa, Egypt, and Nigeria are focusing on renewable energy integration and electrification programs. Dry type transformers are preferred for their safety and minimal maintenance needs in high-temperature conditions. Continuous government-backed infrastructure investments strengthen long-term market potential across the region.
Market Segmentations:
By Core:
- Closed
- Shell
By Technology:
- Self Air
- Air Blast
By Insulation:
- Class R
- Class H
By Geography
- North America
- U.S.
- Canada
- Mexico
- Europe
- UK
- France
- Germany
- Italy
- Spain
- Russia
- Rest of Europe
- Asia Pacific
- China
- Japan
- South Korea
- India
- Australia
- Southeast Asia
- Rest of Asia Pacific
- Latin America
- Brazil
- Argentina
- Rest of Latin America
- Middle East
- GCC Countries
- Israel
- Turkey
- Rest of Middle East
- Africa
- South Africa
- Egypt
- Rest of Africa
Competitive Landscape
The Dry Type Distribution Transformer Market is characterized by strong competition among key players including Easun Reyrolle Limited, General Electric, Kirloskar Electric Company Limited, Schneider Electric, Hitachi Energy Ltd., CG Power & Industrial Solutions Ltd., ABB, Crompton Greaves Consumer Electricals Limited, Bharat Heavy Electricals Limited (BHEL), and Eaton. The Dry Type Distribution Transformer Market features an increasingly competitive landscape driven by technological innovation, energy efficiency standards, and sustainability goals. Manufacturers are focusing on enhancing transformer reliability through advanced insulation materials, vacuum pressure impregnation, and cast resin technology. The integration of IoT-enabled monitoring systems and smart diagnostics improves performance tracking and predictive maintenance. Companies are expanding production capacities and establishing partnerships with utilities and industrial sectors to strengthen global reach. Continuous R&D investments support compact, fire-resistant, and eco-friendly designs that meet evolving safety norms. Rising adoption across renewable energy networks and smart city infrastructures further intensifies competition among global and regional manufacturers.
Key Player Analysis
- Easun Reyrolle Limited
- General Electric
- Kirloskar Electric Company Limited
- Schneider Electric
- Hitachi Energy Ltd.
- CG Power & Industrial Solutions Ltd.
- ABB
- Crompton Greaves Consumer Electricals Limited
- Bharat Heavy Electricals Limited (BHEL)
- Eaton
Recent Developments
- In July 2025, power transformers utilizing advanced natural ester insulating fluids. These transformers offer enhanced thermal stability and safety features, supporting sustainable grid upgrades and reducing environmental impact across the utility and industrial sectors.
- In April 2025, Eaton inaugurated a state-of-the-art transformer manufacturing facility in Hai'an, Jiangsu, China, enhancing its collaboration with Jiangsu Ryan Electrical Co. Ltd. This facility integrates smart manufacturing and IoT technologies to support the global shift toward smart electrification.
- In January 2024, GE Vernova and IHI Corporation have initiated the next phase of their collaboration to develop a gas turbine combustion system capable of burning 100% ammonia, potentially transforming natural gas fired electricity generation.
- In May 2023, Huntsman worked with TBEA Group, a global leader in the production of power transmission and distribution equipment with an annual transformer capacity of 260 million kVA, on an Outdoor Dry Type Transformer (DDT)
Report Coverage
The research report offers an in-depth analysis based on Core, Technology, Insulation and Geography. It details leading market players, providing an overview of their business, product offerings, investments, revenue streams, and key applications. Additionally, the report includes insights into the competitive environment, SWOT analysis, current market trends, as well as the primary drivers and constraints. Furthermore, it discusses various factors that have driven market expansion in recent years. The report also explores market dynamics, regulatory scenarios, and technological advancements that are shaping the industry. It assesses the impact of external factors and global economic changes on market growth. Lastly, it provides strategic recommendations for new entrants and established companies to navigate the complexities of the market.
Future Outlook
- The market will witness growing adoption of eco-friendly and fire-safe transformer technologies.
- Digital monitoring and IoT integration will enhance operational efficiency and predictive maintenance.
- Rising renewable energy projects will drive demand for compact and energy-efficient transformers.
- Urban infrastructure and smart grid development will strengthen product penetration across cities.
- Advancements in insulation materials will improve thermal performance and lifespan.
- Manufacturers will expand production capacities in Asia-Pacific to meet increasing demand.
- Government regulations promoting energy efficiency will accelerate replacement of oil-filled transformers.
- Industrial automation and electrification will create new application opportunities.
- Strategic collaborations and technology licensing will support innovation and market expansion.
- Ongoing R&D will focus on developing high-capacity dry type transformers for heavy-duty applications.

Request a Free Sample
Fill in your details and we'll send you a free sample report.
- Sample data tables & charts
- Research methodology
Need a Custom Version of This Report?
Tailor the scope, geography, or segments to your exact requirements.
- Custom geography or segment scope
- Direct access to our analyst team
Frequently Asked Questions
What is the current market size for the Dry Type Distribution Transformer Market, and what is its projected size in 2032?
At what Compound Annual Growth Rate is the Dry Type Distribution Transformer Market projected to grow between 2025 and 2032?
Which Dry Type Distribution Transformer Market segment held the largest share in 2024?
What are the primary factors fueling the growth of the Dry Type Distribution Transformer Market?
Who are the leading companies in the Dry Type Distribution Transformer Market?
Table of Content
Chapter 1 Market Segmentation
- 1.1 Segmentation Framework
- 1.1.1 Product and Service Classification
- 1.1.2 Application and End-Use Classification
- 1.1.3 Technology and Solution Classification
- 1.1.4 Customer and Distribution Channel Classification
- 1.1.5 Geographic Segmentation
- 1.1.6 Market Segment Definitions and Boundaries
Chapter 2 Introduction
- 2.1 Report Objectives and Scope
- 2.2 Product Definition and Industry Terminology
- 2.3 Market Inclusions and Exclusions
- 2.4 Research Process
- 2.4.1 Primary Research and Expert Interviews
- 2.4.2 Secondary Research and Source Review
- 2.4.3 Top-Down and Bottom-Up Estimation
- 2.4.4 Data Triangulation and Verification
- 2.5 Market Size Measurement Basis
- 2.5.1 2024: USD 4274.5 million → 2032: USD 7737.68 million
- 2.6 Historical and Forecast Reference Periods
- 2.6.1 Base Year: 2024
- 2.6.2 Forecast Period: 2024-2032
- 2.7 Research Assumptions and Limitations
Chapter 3 Executive Summary
- 3.1 Market Snapshot and Key Findings
- 3.2 Base-Year Market Size, 2024
- 3.3 Forecast Market Size, 2032
- 3.4 Revenue and Volume Growth Outlook
- 3.5 Key Demand and Supply Indicators
- 3.6 Leading Market Segments
- 3.7 Fastest-Growing Market Opportunities
- 3.8 Regional Performance Highlights
- 3.9 Technology and Industry Transformation
- 3.10 Competitive Landscape Summary
- 3.11 Analyst View and Strategic Implications
Chapter 4 Global Dry Type Distribution Transformer Market Trends and Developments
- 4.1 Historical Industry Development
- 4.2 Recent Market Trends and Developments
- 4.3 Demand and Customer Behavior Trends
- 4.4 Technology and Product Innovation
- 4.5 Artificial Intelligence, Automation and Digitalization
- 4.6 Local Manufacturing and Supply Chain Realignment
- 4.7 Industry Partnerships, Mergers and Acquisitions
- 4.8 Sustainability and Circular Economy Developments
- 4.9 Government and Private Sector Investment Trends
- 4.10 Emerging Business Models and Commercialization
- 4.11 Industry Developments and Announcements
Chapter 5 Global Dry Type Distribution Transformer Market Production, Supply and Demand Analysis
- 5.1 Demand Trend and Consumption Analysis
- 5.2 Demand Forecast, 2024-2032
- 5.3 Production and Output Trend
- 5.4 Production and Output Forecast, 2024-2032
- 5.5 Installed Capacity and Capacity Utilization
- 5.6 Company-Wise Production Plants and Statistics
- 5.6.1 Installed Production Capacity
- 5.6.2 Actual Production
- 5.6.3 Planned Capacity and Expansion Targets
- 5.7 Supply Chain Structure and Procurement Trends
- 5.8 Supply-Demand Gap and Bottlenecks
- 5.9 Import Dependence and Sourcing Structure
- 5.10 Contract Manufacturing and Outsourcing
- 5.11 Regional Supply and Demand Concentration
Chapter 6 Global Dry Type Distribution Transformer Market Pricing Analysis
- 6.1 Pricing Structure and Measurement
- 6.2 Historical Pricing Trends
- 6.3 Pricing Outlook, 2024-2032
- 6.4 Average Selling Price and Unit Economics
- 6.5 Pricing by Product and Market Segment
- 6.6 Geographic Pricing Differences
- 6.7 Key Input, Energy, Labor and Logistics Costs
- 6.8 Contract Pricing and Purchasing Models
- 6.9 Pricing Sensitivity and Competitive Positioning
- 6.10 Price, Margin and Profitability Implications
Chapter 7 Global Dry Type Distribution Transformer Market Dynamics
- 7.1 Market Growth Drivers
- 7.1.1 Demand-Side Drivers
- 7.1.2 Technology and Innovation Drivers
- 7.1.3 Infrastructure and Investment Drivers
- 7.1.4 Regulatory and Policy Drivers
- 7.2 Market Restraints
- 7.2.1 Cost and Affordability Constraints
- 7.2.2 Technology and Adoption Barriers
- 7.2.3 Supply Chain and Operational Constraints
- 7.3 Market Challenges
- 7.3.1 Competitive Pressure and Margin Erosion
- 7.3.2 Skills, Infrastructure and Implementation Gaps
- 7.4 Emerging Market Opportunities
- 7.5 Market Dynamics Impact and Time-Horizon Assessment
Chapter 8 Global Dry Type Distribution Transformer Value Chain Analysis
- 8.1 Industry Value Chain Overview
- 8.2 Upstream Suppliers and Critical Inputs
- 8.3 Technology and Component Providers
- 8.4 Manufacturing or Service Delivery
- 8.5 Distribution, Channel Partners and Integrators
- 8.6 Downstream Applications and End Users
- 8.7 Value Addition and Profit Pools
- 8.8 Vertical Integration and Outsourcing
- 8.9 Supplier Concentration and Risk
- 8.10 Supply Chain Localization and Resilience
Chapter 9 Global Dry Type Distribution Transformer Market Regulations and Policies
- 9.1 Relevant Laws, Standards and Compliance Frameworks
- 9.2 Product, Service, Safety and Quality Requirements
- 9.3 Government Policies, Incentives and Subsidies
- 9.4 Imports, Exports and Trade Barriers
- 9.5 Public Procurement and Local Content Requirements
- 9.6 Environmental and Sustainability Compliance
- 9.7 Upcoming Policy Changes and Market Implications
Chapter 10 Global Dry Type Distribution Transformer Market Hotspots and Opportunities
- 10.1 Market Opportunity Mapping and Growth Hotspots
- 10.2 High-Growth Applications and Customer Groups
- 10.3 Underserved Markets and White-Space Opportunities
- 10.4 Emerging Technology and Product Opportunities
- 10.5 New Capacity and Investment Hotspots
- 10.6 Market Entry and Expansion Opportunities
- 10.7 Distribution and Partnership Opportunities
- 10.8 Near-Term and Long-Term Commercial Potential
- 10.9 Opportunity Attractiveness and Execution Risks
Chapter 11 Global Dry Type Distribution Transformer Market Outlook, 2024-2032
- 11.1 Market Size and Analysis
- 11.1.1 Revenue (Market Measurement: 2024: USD 4274.5 million → 2032: USD 7737.68 million)
- 11.1.2 Market Volume and Quantity Sold
- 11.1.3 Historical Market Size
- 11.1.4 Base-Year Market Size, 2024
- 11.2 Market Forecast, 2024-2032
- 11.2.1 Revenue Forecast to 2032
- 11.2.2 Volume Forecast to 2032
- 11.2.3 CAGR and Year-on-Year Growth
- 11.2.4 Incremental Revenue Opportunity
- 11.3 Forecast Assumptions and Scenario Analysis
- 11.3.1 Base-Case Forecast
- 11.3.2 Optimistic and Conservative Scenarios
- 11.3.3 Technology, Pricing and Policy Sensitivities
- 11.4 Market Attractiveness and Growth Outlook
Chapter 12 Global Dry Type Distribution Transformer Market Segmentation and Outlook
- 12.1 Segmentation Summary and Market Shares, 2024
- 12.2 Largest and Fastest-Growing Segments
- 12.3 Segment Growth Comparison
- 12.4 Segment Attractiveness and Priority Matrix
Chapter 13 Global Dry Type Distribution Transformer Geographic Market Outlook, 2024-2032
- 13.1 Regional Market Size and Share, 2024
- 13.2 Regional Market Forecast, 2024-2032
- 13.3 Regional Pricing, Production and Demand Differences
- 13.4 North America
- 13.4.1 United States
- 13.4.2 Canada
- 13.4.3 Mexico
- 13.5 Europe
- 13.5.1 Germany
- 13.5.2 France
- 13.5.3 Italy
- 13.5.4 United Kingdom
- 13.5.5 Spain
- 13.5.6 Poland
- 13.5.7 Russia
- 13.5.8 Netherlands
- 13.5.9 Belgium
- 13.5.10 Sweden
- 13.5.11 Denmark
- 13.5.12 Norway
- 13.5.13 Rest of Europe
- 13.6 Asia Pacific
- 13.6.1 China
- 13.6.2 India
- 13.6.3 Japan
- 13.6.4 South Korea
- 13.6.5 Thailand
- 13.6.6 Indonesia
- 13.6.7 Vietnam
- 13.6.8 Malaysia
- 13.6.9 Australia
- 13.6.10 Rest of Asia Pacific
- 13.7 Latin America
- 13.7.1 Brazil
- 13.7.2 Argentina
- 13.7.3 Colombia
- 13.7.4 Chile
- 13.7.5 Rest of Latin America
- 13.8 Middle East
- 13.8.1 Saudi Arabia
- 13.8.2 United Arab Emirates
- 13.8.3 Turkey
- 13.8.4 Israel
- 13.8.5 Iran
- 13.8.6 Rest of the Middle East
- 13.9 Africa
- 13.9.1 South Africa
- 13.9.2 Egypt
- 13.9.3 Nigeria
- 13.9.4 Morocco
- 13.9.5 Rest of Africa
- 13.10 Regional Investment, Policy and Supply Chain Differences
- 13.11 Regional Competitive Landscape
- 13.12 Geographic Growth Hotspots
Chapter 14 Global Dry Type Distribution Transformer Technology, Innovation and Sustainability Outlook
- 14.1 Technology Landscape and Maturity
- 14.2 Product, Process and Service Innovation
- 14.3 AI, Automation and Digital Tools in the Industry
- 14.4 Technology Adoption and Performance Benchmarking
- 14.5 Innovation Pipeline and R&D Investment
- 14.6 Patent and Intellectual Property Trends
- 14.7 Energy Efficiency and Resource Management
- 14.8 Sustainability, Recycling and Circularity
- 14.9 Technology Roadmap, 2024-2032
- 14.10 Risks of Obsolescence and Technology Substitution
Chapter 15 Global Dry Type Distribution Transformer Market Key Strategic Imperatives
- 15.1 Growth and Market Entry Priorities
- 15.2 High-Return Products and Segments
- 15.3 Pricing, Profitability and Cost Optimization
- 15.4 Technology Investment and Product Differentiation
- 15.5 Supply Chain Localization and Resilience
- 15.6 Distribution and Customer Acquisition
- 15.7 Partnership, Acquisition and Capacity Strategy
- 15.8 Regional Expansion Priorities
- 15.9 Short-, Medium- and Long-Term Actions
Chapter 16 Competition Outlook
- 16.1 Industry Competition Characteristics
- 16.2 Market Structure and Concentration
- 16.3 Market Share and Competitive Positioning, 2024
- 16.4 Company-Wise Revenue and Product Benchmarking
- 16.5 Production and Service Capacity Benchmarking
- 16.6 Technology, Pricing and Differentiation
- 16.7 Regional Footprint and Distribution Strength
- 16.8 Mergers, Acquisitions and Strategic Alliances
- 16.9 New Entrants and Competitive Threats
- 16.10 Porter's Five Forces and Industry Attractiveness
- 16.11 Competitive Outlook, 2024-2032
Chapter 17 Company Profiles
- 17.1 Company Coverage and Selection Criteria
- 17.2 Leading Market Participants – Standard Profile Structure
- 17.2.1 Business Description
- 17.2.2 Company Ownership and Geographic Presence
- 17.2.3 Product and Service Portfolio
- 17.2.4 Manufacturing and Operating Footprint
- 17.2.5 Production Capacity and Expansion Plans
- 17.2.6 Financial Performance and Investment
- 17.2.7 Market Share and Competitive Position
- 17.2.8 Technology and Innovation Capabilities
- 17.2.9 Strategic Alliances or Partnerships
- 17.2.10 Recent Developments
- 17.2.11 Growth Strategy and Outlook
- 17.3 Other Relevant Market Participants
Note: Every listed company is profiled on the structure shown under the first company. The company list is preliminary and may change based on research findings, market developments, data availability and client requirements.
Chapter 18 Disclaimer
- 18.1 Research and Forecast Disclaimer
- 18.2 Data Source and Estimation Limitations
Note: The depth of individual sections depends on data availability for this market. Volume, capacity, trade and other unit-based metrics are included where applicable.

