Market Overview
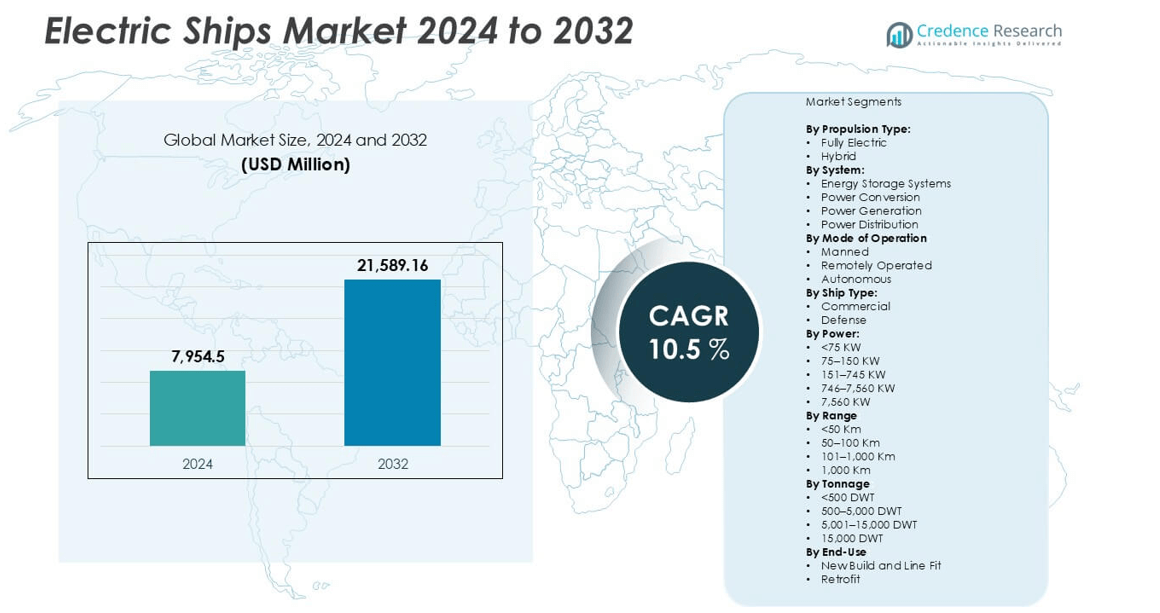
The Electric Ships Market size was valued at USD 7,954.5 million in 2024 and is anticipated to reach USD 21,589.16 million by 2032, growing at a CAGR of 10.5% during the forecast period.
| REPORT ATTRIBUTE |
DETAILS |
| Historical Period |
2020-2023 |
| Base Year |
2024 |
| Forecast Period |
2025-2032 |
| Electric Ships Market Size 2024 |
USD 7,954.5 million |
| Electric Ships Market, CAGR |
10.5% |
| Electric Ships Market Size 2032 |
USD 21,589.16 million |
The Electric Ships Market is led by key players including Yara, KONGSBERG, VARD AS, General Dynamics Electric Boat, Corvus Energy, and Boesch Motorboote AG. These companies focus on advanced propulsion systems, battery integration, and autonomous vessel technologies to enhance operational efficiency and reduce emissions. Strategic partnerships among shipbuilders, technology developers, and energy firms are driving large-scale adoption across passenger and commercial fleets. North America leads the market with 32% share, supported by strong government initiatives and port electrification. Europe follows with 29%, driven by strict emission standards, while Asia-Pacific holds 27%, backed by expanding shipbuilding activities and innovation in hybrid and fully electric vessels.
Market Insights
- The Electric Ships Market size was valued at USD 7,954.5 million in 2024 and is projected to reach USD 21,589.16 million by 2032, growing at a CAGR of 10.5% during the forecast period.
- Growing demand for clean propulsion systems and advancements in high-capacity batteries drive adoption of fully electric and hybrid ships across commercial and defense sectors.
- Key trends include the integration of AI-based navigation, autonomous operation, and hybrid hydrogen-electric propulsion enhancing performance and sustainability.
- Leading players such as Yara, KONGSBERG, and VARD AS focus on developing advanced battery systems, power distribution units, and emission-free vessels to strengthen market presence.
- North America holds 32% share, followed by Europe (29%) and Asia-Pacific (27%); among segments, fully electric ships dominate, supported by energy storage systems as the core technology driving the next phase of maritime electrification.
Access crucial information at unmatched prices!
Request your sample report today & start making informed decisions powered by Credence Research Inc.!
Download Sample
Market Segmentation Analysis:
By Propulsion Type
The market is divided into fully electric and hybrid vessels. Fully electric ships lead the segment due to lower emissions and reduced operating noise. Growing maritime electrification projects and advancements in high-capacity batteries strengthen this category. Hybrid ships remain significant in longer voyages where battery capacity alone is insufficient. The hybrid configuration provides operational flexibility by combining battery power with diesel or LNG systems, improving endurance while meeting emission standards.
- For instance, Yara Birkeland, developed by Yara International and KONGSBERG, operates with a 7 MWh battery system supplied by Leclanché, enabling autonomous, zero-emission voyages of up to 120 kilometers.
By System
The market covers energy storage systems, power conversion, power generation, and power distribution. Energy storage systems dominate the category owing to rapid improvements in lithium-ion and solid-state battery technologies. These systems ensure stable energy supply and efficient propulsion control across vessel sizes. Power conversion systems support voltage regulation and grid stability, critical for safe navigation and optimized performance. Power generation technologies integrate renewable sources and fuel cells, helping ships achieve compliance with IMO 2050 emission targets. Power distribution systems play a key role in managing onboard electrical loads, maintaining safety and reliability in maritime operations.
- For instance, Corvus Energy supplied a 6.1 MWh battery system for Havila Kystruten’s passenger vessel Havila Capella, which, at the time of its delivery around the end of 2021, was considered one of the largest maritime battery installations for a passenger vessel.
By Mode of Operation
The market is classified into manned, remotely operated, and autonomous vessels. Manned ships account for the largest share, driven by established infrastructure and regulatory acceptance. Remotely operated ships are gaining traction in offshore surveillance, research, and short-distance logistics where real-time human control ensures safety. The autonomous segment is emerging rapidly through AI integration, sensor fusion, and real-time navigation systems. It enables predictive decision-making and cost reduction in long-term operations. Companies are testing autonomous platforms to improve efficiency and reduce human error in coastal and deep-sea operations.
Key Growth Drivers
Rising Adoption of Clean Marine Propulsion
Global maritime decarbonization initiatives are accelerating the shift toward electric ships. Governments and shipping companies are investing heavily in zero-emission vessels to meet IMO and regional carbon reduction targets. Electric propulsion offers reduced greenhouse gas emissions, lower maintenance costs, and quieter operation, supporting its adoption in both commercial and defense fleets. Battery technologies such as lithium-ion and solid-state systems are achieving higher energy densities, improving range and reliability. Shipbuilders are integrating hybrid configurations that combine electric and renewable power sources to optimize fuel efficiency. Growing awareness of sustainable transport and stringent emission norms across major ports reinforce the adoption of electric vessels worldwide.
- For instance, the MS Medstraum, the world’s first all-electric and zero-emission fast ferry, was equipped with a 1,524-kWh battery system from Corvus Energy, integrated by Wärtsilä. Its operation on a route near Stavanger reduces annual CO₂ emissions by 1,500 tons.
Advancements in Battery and Energy Storage Technologies
Continuous improvements in marine battery technology are driving the performance of electric ships. High-capacity lithium-ion and emerging solid-state batteries deliver enhanced energy efficiency, faster charging, and longer service life. These technologies enable larger vessels to operate fully on electric propulsion without frequent recharging. The falling cost of marine-grade batteries is improving project feasibility across passenger ferries, cargo vessels, and offshore support ships. Manufacturers are developing modular battery systems that allow easier maintenance and scalability. Energy storage systems with advanced safety management and thermal control enhance ship reliability during long voyages. Growing partnerships among shipbuilders, battery suppliers, and technology firms are further accelerating innovation and deployment.
- For instance, Havila Kystruten’s cruise vessels, such as the Havila Castor, are equipped with the Corvus Orca ESS, a 6.1 MWh battery system, enabling them to sail silently and emission-free for up to 4 hours in sensitive areas like the Geirangerfjord.
Government Support and Infrastructure Development
Government incentives, port electrification projects, and research funding are key catalysts for market expansion. Several nations have introduced subsidies, tax credits, and green financing schemes to encourage shipowners to transition toward electric fleets. Port authorities are deploying onshore power supply systems that reduce idling emissions and support efficient vessel charging. The European Union’s “Fit for 55” initiative and the U.S. Clean Ports Program are notable examples of policy-driven growth. Infrastructure modernization in major maritime hubs such as Rotterdam, Shanghai, and Singapore strengthens the commercial viability of electric ships. Strategic collaborations between public and private entities are ensuring a smooth shift toward low-emission marine operations globally.
Key Trends & Opportunities
Growing Integration of Autonomous and Smart Navigation Systems
The integration of AI, IoT, and advanced sensors is transforming electric ship operations. Smart navigation enables route optimization, predictive maintenance, and real-time energy management. Autonomous vessels powered by electric propulsion reduce operational costs and improve safety by minimizing human error. Companies are testing AI-driven decision systems for collision avoidance and fleet management. The rise of remote-controlled and fully autonomous electric ships presents strong opportunities in logistics, defense, and research applications.
- For instance, KONGSBERG’s K-Mate autonomy system powers the Yara Birkeland, allowing autonomous navigation with over 40 onboard sensors and radar-assisted decision algorithms.
Expansion of Hybrid and Hydrogen-Electric Vessels
Hybrid and hydrogen-electric technologies are emerging as promising alternatives for long-range marine transport. Fuel cell systems paired with batteries extend range while maintaining low emissions. Shipbuilders are developing dual-power propulsion systems to balance endurance with sustainability. The use of hydrogen storage and refueling infrastructure at ports creates new opportunities for zero-emission shipping. Collaboration between shipyards and clean-energy firms is advancing the commercialization of hydrogen-electric vessels across regional and deep-sea routes.
Increasing Electrification of Inland and Short-Sea Shipping
Electrification efforts are rapidly expanding in inland waterways and short-sea transport routes. Passenger ferries, tugs, and coastal cargo vessels are among the early adopters. These operations benefit from frequent docking, making recharging easier and cost-effective. National transport authorities in Norway, Denmark, and Japan are funding all-electric ferry programs to meet emission goals. This segment provides a scalable model for larger vessel electrification in the future.
Key Challenges
High Initial Capital and Retrofit Costs
Despite growing adoption, the high cost of electric propulsion systems and batteries remains a major barrier. Retrofitting existing vessels requires redesigning internal layouts, power distribution networks, and safety systems. Battery packs suitable for marine use are expensive due to high energy density and durability standards. Small ship operators face financial strain without government subsidies or long-term contracts. The payback period for electric conversion is longer compared to conventional vessels, slowing transition in cost-sensitive markets.
Limited Charging Infrastructure and Range Constraints
A lack of standardized charging stations and grid connectivity restricts large-scale deployment. Many ports lack high-voltage charging systems capable of supporting heavy maritime operations. Range limitations, especially in deep-sea shipping, hinder the use of fully electric propulsion. Battery weight and space requirements further limit cargo capacity. Without rapid charging solutions and global infrastructure development, full electrification of the maritime sector faces operational challenges.
Regional Analysis
North America
North America held around 32% of the electric ships market in 2024, driven by strong government support and port electrification projects. The U.S. and Canada are investing in zero-emission marine technologies to meet national carbon neutrality targets. The U.S. Maritime Administration and private operators are deploying hybrid and fully electric ferries across coastal routes. Advanced infrastructure, combined with growing adoption in defense and commercial fleets, is reinforcing regional leadership. Expanding renewable energy integration and supportive maritime regulations continue to drive demand across North American shipyards and port facilities.
Europe
Europe accounted for nearly 29% of the market in 2024, supported by strict emission regulations and green port initiatives. Norway, Denmark, and the Netherlands are leading the shift toward battery-powered ferries and short-distance vessels. The European Union’s maritime decarbonization policies, including the “Fit for 55” plan, are boosting regional adoption. European shipbuilders are also integrating hybrid propulsion and hydrogen fuel cell systems in commercial and passenger vessels. Continuous R&D funding and collaboration between ports, operators, and technology suppliers ensure steady expansion of electric ship infrastructure across the region.
Asia-Pacific
Asia-Pacific captured about 27% of the electric ships market in 2024, fueled by rapid shipbuilding activity and government-led sustainability programs. China, Japan, and South Korea are investing in large-scale electric and hybrid ship projects targeting both domestic and export markets. Japan’s initiatives on autonomous electric vessels and South Korea’s expansion of eco-shipyards highlight strong technological advancement. China’s policy on low-emission inland transport supports battery-powered cargo and passenger vessels. The region’s strong manufacturing base and government-backed innovation programs position it as a key growth hub for electric ship production.
Rest of the World
The Rest of the World held nearly 12% of the global share in 2024, led by emerging projects in the Middle East, South America, and Africa. Countries such as the UAE and Brazil are investing in electric ferries to reduce port emissions and enhance energy efficiency. Growing trade activities and coastal transport modernization are creating opportunities for hybrid vessel deployment. Supportive maritime regulations, coupled with renewable power availability, are encouraging gradual electrification. However, limited infrastructure and higher project costs still restrict large-scale adoption in several developing coastal economies.
Market Segmentations:
By Propulsion Type:
By System:
- Energy Storage Systems
- Power Conversion
- Power Generation
- Power Distribution
By Mode of Operation:
- Manned
- Remotely Operated
- Autonomous
By Ship Type:
By Power:
- <75 KW
- 75–150 KW
- 151–745 KW
- 746–7,560 KW
- 7,560 KW
By Range:
- <50 Km
- 50–100 Km
- 101–1,000 Km
- 1,000 Km
By Tonnage:
- <500 DWT
- 500–5,000 DWT
- 5,001–15,000 DWT
- 15,000 DWT
By End-Use:
- New Build and Line Fit
- Retrofit
By Geography:
- North America
- Europe
- UK
- France
- Germany
- Italy
- Spain
- Russia
- Rest of Europe
- Asia Pacific
- China
- Japan
- South Korea
- India
- Australia
- Southeast Asia
- Rest of Asia Pacific
- Latin America
- Brazil
- Argentina
- Rest of Latin America
- Middle East
- GCC Countries
- Israel
- Turkey
- Rest of Middle East
- Africa
- South Africa
- Egypt
- Rest of Africa
Competitive Landscape
The Electric Ships Market features a dynamic competitive landscape marked by innovation in propulsion, energy storage, and system integration. Leading players such as Yara, KONGSBERG, VARD AS, General Dynamics Electric Boat, and Corvus Energy are focusing on developing next-generation electric and hybrid vessels. Companies are investing in advanced battery technologies, digital navigation systems, and fuel-cell-based propulsion to enhance vessel efficiency and range. Partnerships between shipbuilders and energy solution providers are accelerating the commercialization of sustainable marine transport. Several firms are expanding production capacity and collaborating with port authorities to establish charging infrastructure. Strategic acquisitions and technology collaborations support diversification into autonomous and remotely operated electric vessels. Continuous research in lightweight materials, smart power management, and modular battery systems enables manufacturers to meet emission targets while improving performance. The competition remains centered on innovation, compliance with global maritime standards, and strengthening presence in commercial and defense segments.
Shape Your Report to Specific Countries or Regions & Enjoy 30% Off!
Key Player Analysis
- Yara
- KONGSBERG
- VARD AS
- General Dynamics Electric Boat
- Corvus Energy
- Boesch Motorboote AG
- Bureau Veritas
- Electrovaya
- Duffy Electric Boat Company
- Baltic Workboats AS
- TRITON
- Canadian Electric Boat Compan
Recent Developments
- In September 2025, Kongsberg Maritime signed a contract to supply and integrate the full electrical system for India’s first fully electric tug. The vessel will be deployed at Deendayal Port in Gujarat as part of the country’s Green Tug Transition Programme (GTTP), with delivery scheduled for the fourth quarter of 2026.
- In May 2023, PowerX, Inc., a Japan-based energy company launched a detailed design of the first-ever Battery Tanker. The ship ‘X’ is scheduled to be completed in 2025 and will undergo domestic and international field testing in 2026. The Battery Tanker X is designed to be a zero-emission vessel that can transport renewable energy from offshore wind farms to shore.
- In February 2023, Electric Ship Innovation Alliance (CESIA) was officially founded with the backing of COSCO SHIPPING Development and COSCO SHIPPING. This move cements China’s position as a world leader in the electrification of the shipping industry.
- In January 2023, Hyundai Heavy Industries commissioned South Korea’s first big next-generation electric propulsion ship. The ship is dual-powered and runs on battery power, LNG fuel, or a combination of the two. It will be utilized for demonstrations and tourism cruises along the Korean coast.
- In November 2022, Corvus Energy announced its participation in the Crowley eWolf zero-emission tugboat project This includes an order to provide onshore battery energy storage systems (ESS) using two Corvus Orca BOBs, the containerized variant of the renowned Corvus Orca ESS. These systems collectively offer a substantial energy storage capacity of 2,990 kWh.
Report Coverage
The research report offers an in-depth analysis based on Propulsion Type, System, Mode of Operation, Ship Type, Power, Range, Tonnage, End-Use and Geography. It details leading market players, providing an overview of their business, product offerings, investments, revenue streams, and key applications. Additionally, the report includes insights into the competitive environment, SWOT analysis, current market trends, as well as the primary drivers and constraints. Furthermore, it discusses various factors that have driven market expansion in recent years. The report also explores market dynamics, regulatory scenarios, and technological advancements that are shaping the industry. It assesses the impact of external factors and global economic changes on market growth. Lastly, it provides strategic recommendations for new entrants and established companies to navigate the complexities of the market.
Future Outlook
- Demand for zero-emission marine transport will continue to expand across commercial and defense sectors.
- Advancements in solid-state and lithium-ion batteries will improve range and energy efficiency.
- Hybrid and hydrogen-electric propulsion systems will gain traction for long-distance operations.
- Autonomous and remotely operated electric vessels will become common in logistics and coastal transport.
- Governments will strengthen emission regulations, driving adoption of clean maritime technologies.
- Shipbuilders will focus on modular and scalable power systems for easier retrofitting.
- Charging infrastructure development at major ports will accelerate large-scale deployment.
- Collaboration between shipyards and energy firms will enhance system integration and innovation.
- Increased investment in AI-driven power management will improve vessel safety and performance.
- Growing interest in electric ferries and inland vessels will establish a foundation for wider ocean-going electrification.


