
Market Overview
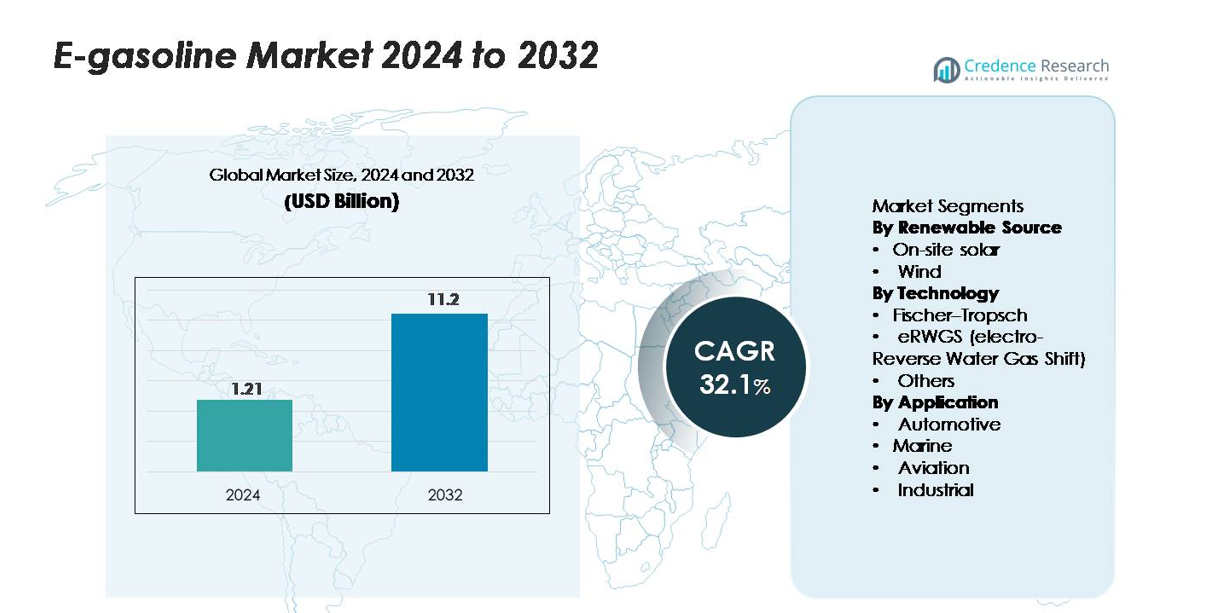
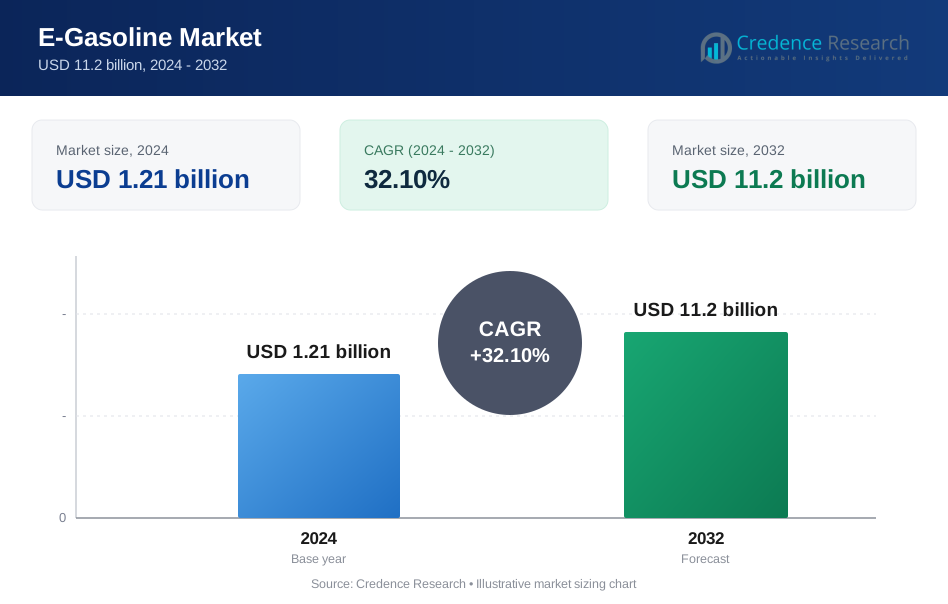
The global e-gasoline market was valued at USD 1.21 billion in 2024 and is projected to reach USD 11.2 billion by 2032, expanding at a CAGR of 32.1% over the forecast period.
| REPORT ATTRIBUTE | DETAILS |
|---|---|
| Historical Period | 2020-2023 |
| Base Year | 2024 |
| Forecast Period | 2025-2032 |
| E-Gasoline Market Size 2024 | USD 1.21 billion |
| E-Gasoline Market, CAGR | 32.1% |
| E-Gasoline Market Size 2032 | USD 11.2 billion |
Leading players in the e-gasoline market include Arcadia eFuels, ExxonMobil, Electrochaea GmbH, Ballard Power Systems, and other innovators developing power-to-liquid and CO₂-to-fuel pathways. These companies advance production efficiency through scalable green-hydrogen systems, high-performance catalysts, and integrated carbon-capture platforms, strengthening their competitive position as early commercial projects progress. Europe leads the global market with 40% share, supported by strong regulatory mandates and large-scale e-fuel deployments. North America follows with 35%, driven by rapid technology adoption and pilot-plant expansion, while Asia-Pacific accounts for 20%, reflecting growing investment in renewable-fuel infrastructure and automotive decarbonization efforts.
Market Insights
- The global E-gasoline market reached USD 1.21 billion in 2024 and is projected to rise to USD 11.2 billion by 2032, expanding at a 32.1% CAGR, reflecting rapid acceleration in power-to-liquid fuel deployment.
- Growing regulatory pressure to decarbonize transport drives adoption, as governments support large-scale green-hydrogen production, CO₂-conversion pathways, and integration of synthetic gasoline into existing fuel infrastructures.
- Key trends include increased investment in e-fuel plants, advancement in high-efficiency electrolyzers, and rising commercialization of e-naphtha and e-gasoline blends, supported by partnerships between energy companies and automotive OEMs.
- Competitive intensity increases as leading players enhance conversion efficiency, scale modular plant designs, and optimize production costs, although high electricity demand and limited renewable availability remain core restraints.
- Europe leads the market with 40% share, followed by North America at 35% and Asia-Pacific at 20%; segment-wise, e-naphtha and gasoline-range hydrocarbons represent the dominant share of overall demand.
Market Segmentation Analysis:
By Renewable Source:
On-site solar currently captures the largest share of the e-gasoline market as producers favor its predictable output, declining installation costs, and compatibility with distributed fuel-synthesis facilities. This dominance is supported by the steady availability of daytime power, which stabilizes electrolyzer performance and reduces operational variability. Wind-based production follows, contributing meaningfully where high-capacity factors enable continuous renewable energy input. Growth in both sources is driven by increasing demand for low-carbon synthetic fuels and expanding policies that incentivize renewable-powered electrofuel projects, particularly in regions prioritizing energy security and emissions reduction.
- For instance, Siemens Energy’s solar-integrated PEM electrolyzer deployed at the Mainz Energy Park operates at a rated capacity of 6 MW and produces up to 1,200 Nm³/h of hydrogen using solar-sourced electricity, demonstrating stable operation under fluctuating irradiance.
By Technology:
The Fischer–Tropsch (FT) process accounts for the largest share in current e-gasoline production due to its technological maturity, high-quality hydrocarbon output, and compatibility with existing refining infrastructure. Its established engineering base and scalability give it a competitive edge over newer pathways. eRWGS technology, while emerging rapidly, remains in the development phase but attracts investment for its efficiency in converting CO₂ and green hydrogen into syngas. Other conversion routes continue to serve niche applications. The shift toward high-efficiency synthetic fuel systems and improved carbon-utilization rates is driving technology adoption across all sub-segments.
- For instance, INERATEC’s commercial FT module deployed in Frankfurt is engineered to process syngas into approximately 2,500 tons of synthetic hydrocarbons annually, using modular micro-reactors operating at temperatures above 200°C and pressures exceeding 20 bar.
By Application:
Automotive applications dominate the e-gasoline market, holding the largest share as the sector explores low-carbon fuel alternatives to decarbonize existing internal combustion vehicle fleets. This dominance is driven by the extensive installed base of vehicles, immediate compatibility with current engines, and supportive regulations encouraging renewable drop-in fuels. Marine and aviation segments follow, gaining momentum as operators seek substitutes for conventional fuels in hard-to-electrify transport modes. Industrial applications continue to expand gradually, supported by demand for cleaner combustion processes. Overall adoption is propelled by the need for scalable, carbon-neutral fuel solutions across transportation and manufacturing.
Key Growth Drivers
Rising Decarbonization Mandates and Low-Carbon Fuel Policies
Governments worldwide increasingly mandate deep reductions in transport-sector emissions, driving strong interest in e-gasoline as a drop-in, carbon-neutral alternative. Regulatory frameworks such as clean fuel standards, renewable fuel quotas, and carbon tax mechanisms incentivize fuel producers to deploy synthetic gasoline pathways powered by renewable energy. Unlike biofuels, e-gasoline provides high energy density and engine compatibility without requiring vehicle modifications, enabling immediate decarbonization of existing fleets. As nations prioritize compliance with net-zero targets, e-gasoline becomes a strategic option for reducing lifecycle emissions in hard-to-electrify segments. These policy mechanisms create predictable demand, de-risk investments in electrolysis and CO₂-to-fuel conversion plants, and encourage long-term offtake agreements across automotive, marine, aviation, and industrial sectors. As a result, regulatory pressure remains one of the most powerful forces accelerating market expansion and commercial-scale deployment.
- For instance, HIF Global’s Haru Oni e-fuel plant supported by Porsche and ExxonMobil operates with a Siemens Energy PEM electrolyzer rated at 3.2 MW and produces around 130,000 liters of synthetic fuel annually in its pilot phase, demonstrating compliance-ready low-carbon fuel production.
Advancements in Renewable Energy Integration and Power-to-Liquid Efficiency
Technological improvements in electrolyzers, carbon-capture systems, and power-to-liquid (PtL) fuel synthesis significantly enhance the commercial viability of e-gasoline. High-efficiency PEM and solid oxide electrolyzers reduce electricity consumption while enabling stable operation under variable renewable power, lowering production costs. Simultaneously, innovations in Fischer–Tropsch catalysts and eRWGS reactors improve conversion yields and reduce thermal losses. Growing integration of solar and wind with large-scale hydrogen hubs ensures a stable supply of low-cost, low-carbon electricity, which is the largest cost component of synthetic fuel production. Digital monitoring systems, AI-based plant optimization, and modular PtL units further enhance scalability and uptime. Together, these advancements shorten payback periods for e-gasoline plants and attract investment from energy companies seeking high-value decarbonization pathways. The ongoing efficiency gains enable producers to expand capacity and position e-gasoline as a competitive alternative to fossil-derived gasoline.
- For instance, Sunfire confirmed that its high-temperature SOEC system achieves electrical efficiencies above 84% (LHV) and delivered more than 8,000 operating hours in the GrInHy2.0 project at Salzgitter, demonstrating industrial-scale stability
Demand for Sustainable Fuels in Hard-to-Electrify Transport Segments
Decarbonizing long-distance transport remains a global challenge, and e-gasoline offers an immediate pathway for reducing emissions where electrification and hydrogen adoption face limitations. Automotive fleets especially in regions with high ICE penetration seek renewable fuels that do not require infrastructure overhaul. The aviation and marine sectors also explore synthetic fuels to comply with emerging carbon-intensity standards and reduce reliance on fossil-based alternatives. E-gasoline’s chemical equivalence to conventional gasoline allows seamless adoption in legacy engines, storage systems, and distribution networks, making it an attractive solution for fleet operators and fuel distributors. Industrial users particularly in manufacturing processes requiring stable combustion performance also show rising interest in low-carbon liquid fuels. As transport and industrial sectors pursue near-term emissions reductions without compromising operational reliability, e-gasoline emerges as a practical, scalable option driving strong market demand.
Key Trends & Opportunities
Expansion of Commercial-Scale Power-to-Liquid Fuel Plants
A major opportunity arises from the accelerating development of commercial-scale PtL facilities that integrate large renewable energy assets with CO₂ utilization and synthetic fuel production. Companies increasingly deploy multi-megawatt electrolyzer systems paired with direct air capture (DAC) or industrial CO₂ streams to generate e-gasoline at scale. This creates a roadmap toward cost reductions through economies of scale and modular plant replication. Strategic partnerships between energy utilities, refineries, and technology developers foster long-term offtake commitments that stabilize project economics. Additionally, the emergence of dedicated hydrogen valleys and renewable industrial clusters supports infrastructure build-out. As more pilot projects transition into commercial production phases, stakeholders gain clarity on operational performance, regulatory compliance, and supply chain coordination. This expansion positions e-gasoline as a mainstream synthetic fuel option and opens new opportunities for investment, technology licensing, and cross-sector collaboration.
- For instance, HIF Global’s Haru Oni plant operates with a Siemens Energy 3.2 MW PEM electrolyzer and targets annual production of 130,000 liters of synthetic fuels in its pilot phase, with expansion plans exceeding 55 million liters per year in its next development
Integration of Carbon Capture Technologies into Fuel Production Ecosystems
The convergence of carbon capture technologies with e-gasoline production unlocks significant opportunities for reducing environmental impact and strengthening fuel sustainability credentials. Point-source CO₂ capture from industrial emitters provides a near-term feedstock stream, while DAC advancements enable long-term scalability and true carbon neutrality. Improved sorbent materials, lower regeneration temperatures, and modular capture units decrease the cost of obtaining high-purity CO₂ suitable for fuel synthesis. Industrial zones with co-located capture systems, renewable power, and hydrogen infrastructure gain competitive advantages in developing synthetic fuel hubs. As carbon utilization markets expand, integrating CO₂-derived e-gasoline into supply chains becomes economically and environmentally attractive for producers aiming to meet low-carbon fuel standards. This integration presents a critical opportunity to align decarbonization goals across industries while scaling sustainable fuel pathways.
- For instance, Climeworks’ Orca DAC plant in Iceland captures 4,000 tons of CO₂ per year using modular collector units powered entirely by geothermal energy, providing certified high-purity CO₂ suitable for synthetic fuel synthesis.
Key Challenges
High Production Costs and Dependence on Renewable Energy Supply
Despite technological progress, e-gasoline faces high production costs primarily driven by electricity consumption, electrolyzer investment, and plant integration complexity. Synthetic fuel pathways require large amounts of renewable electricity, making cost competitiveness highly sensitive to regional energy prices and grid availability. Fluctuating solar and wind output also introduces variability that requires advanced storage or hybrid power systems to ensure continuous operations. Capital-intensive infrastructure—including electrolysis units, CO₂ capture systems, and Fischer–Tropsch or eRWGS reactors—poses financial risks for early adopters. As a result, many projects depend on subsidies, carbon credits, and long-term power purchase agreements to remain viable. Achieving cost parity with fossil gasoline remains a major hurdle, particularly in markets without strong policy support or abundant low-cost renewable energy resources.
Limited Infrastructure, Regulatory Uncertainty, and Market Fragmentation
Widespread adoption of e-gasoline is slowed by fragmented regulations, varying fuel-certification standards, and the absence of a unified global framework for synthetic fuels. While e-gasoline is compatible with existing distribution systems, large-scale commercialization requires clear guidelines for lifecycle emissions accounting, sustainability verification, and cross-border trading. Uncertainty around future carbon pricing, incentives, and import regulations complicates investment decisions for producers and fuel distributors. Additionally, supply chains for electrolyzers, CO₂ capture equipment, and catalyst materials remain underdeveloped, restricting scalability. Competing alternative fuels—such as biofuels, renewable diesel, and hydrogen—further fragment the market by drawing investment and regulatory focus. These gaps collectively hinder long-term planning and slow the pace of infrastructure expansion essential for stable e-gasoline market growth.
Regional Analysis
North America
North America dominates the e-gasoline market with about 35% share, driven by strong investments in low-carbon fuels, advanced power-to-liquid technologies, and public–private collaborations promoting synthetic fuel integration. The U.S. leads adoption due to expanding pilot plants, incentives for renewable fuels, and rising demand from automotive and aviation sectors seeking drop-in alternatives. Canada supports growth through clean-fuel regulations and carbon-reduction policies enabling large-scale CO₂-to-fuel projects. Strong technological capability, availability of renewable electricity, and participation from major energy companies reinforce North America’s leadership in early-stage commercial deployment.
Europe
Europe holds the largest regional share at about 40%, supported by stringent decarbonization mandates, ambitious fit-for-55 targets, and large-scale power-to-liquid projects across Germany, Denmark, Spain, and the Netherlands. Strong policy frameworks for synthetic fuels, aviation mandates, and renewable fuel blending obligations accelerate regional adoption. The EU’s emphasis on carbon-neutral mobility, combined with multiple industrial consortia and commercial e-gasoline demonstrations, drives rapid scale-up. High renewable energy penetration and the presence of leading technology developers position Europe as the core hub for innovation and early commercialization in the e-gasoline value chain.
Asia-Pacific
Asia-Pacific accounts for about 20% of global e-gasoline demand, driven by expanding renewable energy capacity, large automotive markets, and increasing interest in synthetic fuels for long-distance mobility. Japan and South Korea lead through pilot-scale e-fuel plants and strategic partnerships with global energy firms, while Australia leverages abundant solar resources to develop export-oriented e-fuel projects. China explores CO₂-to-fuel pathways as part of its carbon-neutral roadmap. The region’s rapidly growing transportation sector, improving hydrogen infrastructure, and supportive government initiatives contribute to rising demand and future scalability.
Latin America
Latin America represents roughly 3% of the global market, supported primarily by emerging renewable-fuel programs and growing interest in synthetic gasoline for reducing transport-sector emissions. Chile leads regional development through large-scale e-fuel initiatives linked to its high-capacity wind resources in Patagonia, while Brazil explores integration of e-gasoline with its established biofuel ecosystem. Although commercial deployment remains limited, expanding green-hydrogen projects and international partnerships provide a foundation for early-stage market participation. Investment momentum and export-oriented strategies are expected to gradually increase the region’s role in global e-fuel supply.
Middle East & Africa
The Middle East & Africa region holds around 2% of the e-gasoline market, with growth driven by large renewable energy investments, particularly in solar-powered hydrogen production. The UAE and Saudi Arabia lead early activity through green-hydrogen mega-projects positioned to support synthetic fuel production and export. South Africa explores power-to-liquid technologies to decarbonize industrial transport and aviation. Although e-gasoline deployment is at a nascent stage, strong resource availability, supportive national strategies, and international collaborations indicate rising long-term potential for e-fuel production capacity in the region.
Market Segmentations:
By Renewable Source
- On-site solar
- Wind
By Technology
- Fischer–Tropsch
- eRWGS (electro-Reverse Water Gas Shift)
- Others
By Application
- Automotive
- Marine
- Aviation
- Industrial
By Geography
- North America
- U.S.
- Canada
- Mexico
- Europe
- Germany
- France
- U.K.
- Italy
- Spain
- Rest of Europe
- Asia Pacific
- China
- Japan
- India
- South Korea
- South-east Asia
- Rest of Asia Pacific
- Latin America
- Brazil
- Argentina
- Rest of Latin America
- Middle East & Africa
- GCC Countries
- South Africa
- Rest of the Middle East and Africa
Competitive Landscape
The competitive landscape of the e-gasoline market is characterized by a mix of established energy corporations, emerging electrofuel developers, and technology innovators advancing CO₂ utilization, electrolysis, and power-to-liquid synthesis. Companies such as ExxonMobil and Archer Daniels Midland expand their low-carbon portfolios by integrating renewable hydrogen and carbon-capture solutions into fuel production. Specialized players like Arcadia eFuels, eFuel Pacific, and Electrochaea accelerate commercialization through modular PtL facilities and biologically driven methanation pathways that enhance conversion efficiency. Technology leaders including Ballard Power Systems, Ceres Power, and FuelCell Energy contribute advanced fuel-cell and electrolyzer systems that improve hydrogen generation economics. Meanwhile, Climeworks strengthens the ecosystem with high-purity direct air capture feedstock. Industry alliances, including Clean Fuels Alliance America, foster regulatory alignment and market acceptance of synthetic fuels. Overall, competition intensifies as companies pursue scale, cost reduction, and long-term offtake partnerships to secure leadership in renewable liquid fuel production.
Key Player Analysis
- Ballard Power Systems, Inc.
- Arcadia eFuels
- ExxonMobil
- Electrochaea GmbH
- FuelCell Energy, Inc.
- Climeworks AG
- Ceres Power Holding Plc
- Clean Fuels Alliance America
- eFuel Pacific Limited
- Archer Daniels Midland Co.
Recent Developments
- In October 2025, Arcadia eFuels Awarded a contract with Hitachi Energy to deliver the electrical infrastructure for the Vordingborg facility (80,000 t/year e-fuels).
- In September 2025, Ballard Power Systems, Inc. Launched its new FCmove®-SC fuel cell module (for city buses) with ~25% higher volumetric power density, 40% fewer components, aimed at reducing cost of ownership to get closer to diesel parity.
- In May 2024, Arcadia eFuels Completed the Front-End Engineering Design (FEED) for its Project ENDOR plant (in Vordingborg, Denmark) enabling a Final Investment Decision (FID) stage
Report Coverage
The research report offers an in-depth analysis based on Renewable source, Technology, Application and Geography. It details leading market players, providing an overview of their business, product offerings, investments, revenue streams, and key applications. Additionally, the report includes insights into the competitive environment, SWOT analysis, current market trends, as well as the primary drivers and constraints. Furthermore, it discusses various factors that have driven market expansion in recent years. The report also explores market dynamics, regulatory scenarios, and technological advancements that are shaping the industry. It assesses the impact of external factors and global economic changes on market growth. Lastly, it provides strategic recommendations for new entrants and established companies to navigate the complexities of the market.
Future Outlook
- E-gasoline production will expand as power-to-liquid facilities scale up alongside growing renewable energy capacity.
- Advancements in high-efficiency electrolyzers will lower operating costs and improve commercial feasibility.
- Integration of direct air capture technologies will strengthen carbon-neutral fuel pathways.
- Automotive, aviation, and marine sectors will increase adoption to meet tightening emissions regulations.
- Strategic partnerships among energy companies, technology developers, and governments will accelerate large-scale deployment.
- Emerging markets will invest in e-gasoline to diversify energy portfolios and reduce reliance on fossil imports.
- Policy incentives and low-carbon fuel standards will drive long-term demand growth.
- Digital process optimization and automation will enhance plant efficiency and reliability.
- Blending mandates for synthetic fuels will become more common across major economies.
- Continued R&D will improve conversion yields, enabling more competitive pricing over the forecast period.
Request a Free Sample
Fill in your details and we'll send you a free sample report.
- Sample data tables & charts
- Research methodology
Need a Custom Version of This Report?
Tailor the scope, geography, or segments to your exact requirements.
- Custom geography or segment scope
- Direct access to our analyst team
Frequently Asked Questions
What is the current market size for the E-gasoline market, and what is its projected size in 2032?
At what Compound Annual Growth Rate is the E-gasoline market projected to grow between 2025 and 2032?
Which E-gasoline segment held the largest share in 2024?
What are the primary factors fueling the growth of the E-gasoline market?
Who are the leading companies in the E-gasoline market?
Table of Content
Chapter 1. Report Introduction
- 1.1 Report Description & Purpose
- 1.1.1 Report Title & Market Definition
- 1.1.2 Unique Selling Propositions (USP) & Key Differentiators
- 1.1.3 Value Proposition for Stakeholders
- 1.2 Research Objectives
- 1.2.1 Market Sizing Objectives (Volume & Revenue)
- 1.2.2 Segmentation Objectives
- 1.2.3 Competitive Intelligence Objectives
- 1.2.4 Forecast & Scenario Objectives
- 1.3 Report Scope
- 1.3.1 E-Gasoline Scope – Types & Subtypes Covered
- 1.3.2 Geographic Scope – Regions & Countries Covered
- 1.3.3 Historical Period, Base Year & Forecast Period (2024; forecast to 2032)
- 1.3.4 Inclusions & Exclusions
- 1.4 HS Code & Classification Framework
- 1.5 Currency, Units & Pricing Basis
- 1.6 Target Stakeholders
- 1.7 Limitations & Assumptions
Chapter 2. Executive Summary
- 2.1 Global E-Gasoline Market Snapshot
- 2.1.1 Market Size – Historical (2024) & Forecast (2024-2032) (2024: USD 1.21 billion → 2032: USD 11.2 billion)
- 2.1.2 Volume & Revenue – Global Totals
- 2.1.3 Key Market Highlights – Top Five Facts
- 2.2 E-Gasoline Market Segmentation Snapshot
- 2.2.1 Market Split by Region – 2024 vs. 2032
- 2.3 Competitive Snapshot
- 2.3.1 Top 10 Players by Revenue Share – 2024
- 2.3.2 Top 10 Players by Volume Share – 2024
- 2.3.3 Recent Strategic Developments (18-Month Summary)
- 2.4 Key Investment Highlights & Strategic Conclusions
Chapter 3. E-Gasoline Market Dynamics & Industry Analysis
- 3.1 Market Overview & Context
- 3.1.1 E-Gasoline Market Position in the Broader Automotive Value Chain
- 3.1.2 OEM vs. Replacement Market Dynamics
- 3.1.3 Market Maturity & Development Stage by Region
- 3.2 E-Gasoline Market Drivers
- 3.3 E-Gasoline Market Restraints & Challenges
- 3.4 E-Gasoline Market Opportunities
- 3.5 Porter's Five Forces Analysis
- 3.5.1 Threat of New Entrants
- 3.5.2 Bargaining Power of Suppliers
- 3.5.3 Bargaining Power of Buyers
- 3.5.4 Threat of Substitutes
- 3.5.5 Competitive Rivalry – Intensity Assessment
- 3.6 E-Gasoline Value Chain Analysis
- 3.6.1 Upstream – Raw Material/Input Suppliers
- 3.6.1.1 Raw Material/Input 1
- 3.6.1.2 Raw Material/Input 2
- 3.6.1.3 Raw Material/Input 3
- 3.6.2 Midstream – Production/Manufacturing/Service Delivery
- 3.6.2.1 Production/Process Overview
- 3.6.2.2 Key Facility Locations & Capacity by Manufacturer
- 3.6.3 Downstream – Distribution & End Consumer
- 3.6.3.1 Primary Channel – B2B/OEM
- 3.6.3.2 Secondary Channels – Dealer, Retail, Online, Direct
- 3.6.4 Value Chain Profitability Analysis
- 3.6.1 Upstream – Raw Material/Input Suppliers
- 3.7 PESTEL Analysis
- 3.7.1 Political Factors
- 3.7.2 Economic Factors
- 3.7.3 Social Factors
- 3.7.4 Technological Factors
- 3.7.5 Environmental Factors
- 3.7.6 Legal Factors
- 3.8 E-Gasoline Supply Chain Analysis
- 3.8.1 Raw Material/Input Supply Risk Assessment
- 3.8.2 Manufacturing Concentration Risk (Geographic Exposure)
- 3.8.3 Trade Disruption Impact Analysis
- 3.9 Regulatory & Policy Landscape
Note: The regulatory and policy landscape section covers regulations based on their applicability to the market, E-Gasoline category, geography, and scope of the study. Only regulatory frameworks with a material impact on operations, compliance, trade, sustainability, or market access are analyzed in detail.
Chapter 4. Key Investment Pockets & Opportunity Analysis
- 4.1 E-Gasoline Market Attractiveness Analysis
- 4.1.1 By Region – Investment Attractiveness Matrix (Volume × CAGR)
- 4.2 Absolute Revenue Growth Opportunity
- 4.2.1 By Region – Absolute USD Growth Through 2032
- 4.3 Incremental Volume Opportunity
- 4.3.1 By Region – Incremental Volume Through 2032
- 4.3.2 Segment – Incremental Volume
- 4.4 Emerging Submarket Opportunity Deep Dive (Subject to Applicability)
- 4.5 Emerging Market Opportunity Scorecards
- 4.5.1 United States
- 4.5.2 Europe
- 4.5.3 Asia
- 4.5.4 Middle East & Africa
Note: Emerging Market Opportunity Scorecards will be included based on relevance and strategic importance. Regions listed are indicative and may vary depending on data availability and market dynamics.
Chapter 5. E-Gasoline Import-Export Analysis & Trade Flows
- 5.1 Global Trade Overview
- 5.1.1 Global Export Value by Country (2024)
- 5.1.2 Global Export Volume by Country (2024)
- 5.1.3 Global Import Value by Country (2024)
- 5.1.4 Global Import Volume by Country (2024)
- 5.1.5 Net Trade Balance by Country (2024)
- 5.2 Export Analysis – Segment
- 5.2.1 Type 1 (HS Code)
- 5.2.2 Type 2 (HS Code)
- 5.2.3 Type 3 (HS Code)
- 5.2.4 Type 4 (HS Code)
- 5.2.5 Type 5 (HS Code)
- 5.3 Import Analysis – Segment
- 5.3.1 Type 1 (HS Code)
- 5.3.2 Type 2 (HS Code)
- 5.3.3 Type 3 (HS Code)
- 5.3.4 Type 4 (HS Code)
- 5.3.5 Type 5 (HS Code)
- 5.4 Average Unit Trade Prices
- 5.4.1 Average Export Price – Segment & Country
- 5.4.2 Average Import Price – Segment & Source Country
- 5.4.3 Price Trends (2024)
- 5.5 Key Trade Route Analysis
- 5.5.1 Trade Route 1
- 5.5.2 Trade Route 2
- 5.5.3 Trade Route 3
- 5.5.4 Trade Route 4
- 5.5.5 Trade Route 5
- 5.6 Trade Policy Impact Assessment
- 5.6.1 US Anti-Dumping & Section 301 Tariffs
- 5.6.2 EU Customs Union Impact
- 5.6.3 Major Free Trade Agreements
- 5.6.4 USMCA Rules of Origin
Note: Trade policy analysis will be included only where relevant to the E-Gasoline market.
Chapter 6. Competitive Landscape & Company Benchmarking
- 6.1 E-Gasoline Market Concentration & Structure
- 6.1.1 Herfindahl-Hirschman Index (HHI) – vs. 2024
- 6.1.2 Tier 1, Tier 2 & Tier 3 Market Structure
- 6.1.3 Global, Regional & Local Player Dynamics
- 6.2 E-Gasoline Market Share Analysis – 2024
- 6.2.1 Global Revenue Share by Company
- 6.2.2 Global Volume Share by Company
- 6.2.3 Regional Revenue Share
- 6.2.4 Market Share Evolution ( vs. 2024)
- 6.2.5 OEM Segment Share by Company
- 6.2.6 Replacement Segment Share by Company
- 6.3 Production/Delivery Capacity & Facility Analysis
- 6.3.1 Global Installed Capacity
- 6.3.2 Capacity Utilization Rates
- 6.3.3 Production/Output Volume
- 6.3.4 Facility Locations & Capacity Map
- 6.3.5 Planned Capacity Additions
- 6.4 E-Gasoline Competitive Benchmarking Matrix
- 6.4.1 Revenue, Volume, CAGR & Profitability Comparison
- 6.4.2 Channel Revenue Mix
- 6.4.3 Geographic Revenue Exposure
- 6.4.4 R&D Intensity
- 6.4.5 Sustainability Maturity
- 6.5 Strategic Developments in E-Gasoline (Last 24 Months)
- 6.5.1 Mergers, Acquisitions & Divestments
- 6.5.2 New E-Gasoline Launches
- 6.5.3 Facility Expansions
- 6.5.4 Strategic Alliances, Joint Ventures & Partnerships
- 6.5.5 Distribution Expansion & Market Entry
- 6.5.6 Sustainability & ESG Initiatives
- 6.6 Competitive Strategy Mapping
- 6.6.1 Leader, Challenger, Follower & Niche Classification
- 6.6.2 Pricing Strategy Comparison
- 6.6.3 Channel Strategy Matrix
Note: Strategic developments are included based on their materiality and the availability of reliable information.
Chapter 7. Global E-Gasoline Market – By Distribution Channel
- 7.1 Segment Overview
- 7.1.1 Volume & Revenue Split by Channel (2024 & 2032)
- 7.1.2 Channel Mix Evolution (2024-2032)
Chapter 8. Regional Market Analysis – Global Overview
- 8.1 Global Regional Overview
- 8.1.1 Regional Volume Share
- 8.1.2 Regional Revenue Share
- 8.1.3 Regional Volume by Region
- 8.1.4 Regional Revenue by Region
- 8.1.5 Regional Forecast Through 2032
- 8.2 Cross-Regional Segment Analysis
- 8.2.1 By Distribution Channel
- 8.2.2 By Brand/Price Tier
Chapter 9. North America E-Gasoline Market
- 9.1 United States
- 9.2 Canada
- 9.3 Mexico
Chapter 10. Europe E-Gasoline Market
- 10.1 Germany
- 10.2 France
- 10.3 Italy
- 10.4 United Kingdom
- 10.5 Spain
- 10.6 Poland
- 10.7 Russia
- 10.8 Netherlands
- 10.9 Belgium
- 10.10 Sweden
- 10.11 Denmark
- 10.12 Norway
- 10.13 Rest of Europe
Chapter 11. Asia Pacific E-Gasoline Market
- 11.1 China
- 11.2 India
- 11.3 Japan
- 11.4 South Korea
- 11.5 Thailand
- 11.6 Indonesia
- 11.7 Vietnam
- 11.8 Malaysia
- 11.9 Australia
- 11.10 Rest of Asia Pacific
Chapter 12. Latin America E-Gasoline Market
- 12.1 Brazil
- 12.2 Argentina
- 12.3 Colombia
- 12.4 Chile
- 12.5 Rest of Latin America
Chapter 13. Middle East E-Gasoline Market
- 13.1 Saudi Arabia
- 13.2 United Arab Emirates
- 13.3 Turkey
- 13.4 Israel
- 13.5 Iran
- 13.6 Rest of the Middle East
Chapter 14. Africa E-Gasoline Market
- 14.1 South Africa
- 14.2 Egypt
- 14.3 Nigeria
- 14.4 Morocco
- 14.5 Rest of Africa
Chapter 15. E-Gasoline Company Profiles
- 15.1 [Company 01]
- 15.1.1 Company Overview
- 15.1.2 Key Management Personnel
- 15.1.3 Products & Services Portfolio
- 15.1.4 Financial Performance
- 15.1.5 Key Market Focus & Geographic Presence
- 15.1.6 Recent Developments & Strategic Initiatives
Note: The company profile list is preliminary and may change based on research findings, market developments, data availability, and client requirements.
Chapter 16. Appendices
- Appendix A – List of Abbreviations & Acronyms
- Appendix B – Industry Classification Code Reference – Full Series
- Appendix C – Production & Capacity Data Tables
- Appendix D – End-Use & Demand Base Tables
- Appendix E – Consumption & Replacement Rate Assumptions
- Appendix F – ASP Reference Tables
- Appendix G – Manufacturing & Facility Database
- Appendix H – Import-Export Data Tables
- Appendix I – Regulatory Summary Tables
- Appendix J – Primary Research Participant List (Anonymized)
- Appendix K – Primary Research Questionnaire Framework
- Appendix L – Data Sources & Bibliography
- Appendix M – Market Size Divergence & Source Comparison
Chapter 17. Research Methodology
- 17.1 Research Framework & Philosophy
- 17.2 Secondary Research – Sources, Hierarchy & Data Extraction
- 17.3 Data Modeling – Bottom-Up & Top-Down Market Sizing
- 17.4 Primary Research – Stakeholder Framework, LOI & Sample Sizes
- 17.5 Forecast Methodology – Regression, Scenario & Sensitivity Analysis
- 17.6 Quality Control – Four-Layer Validation Framework
- 17.7 Limitations & Standard Assumptions
- 17.8 Disclaimer
