Market Overview
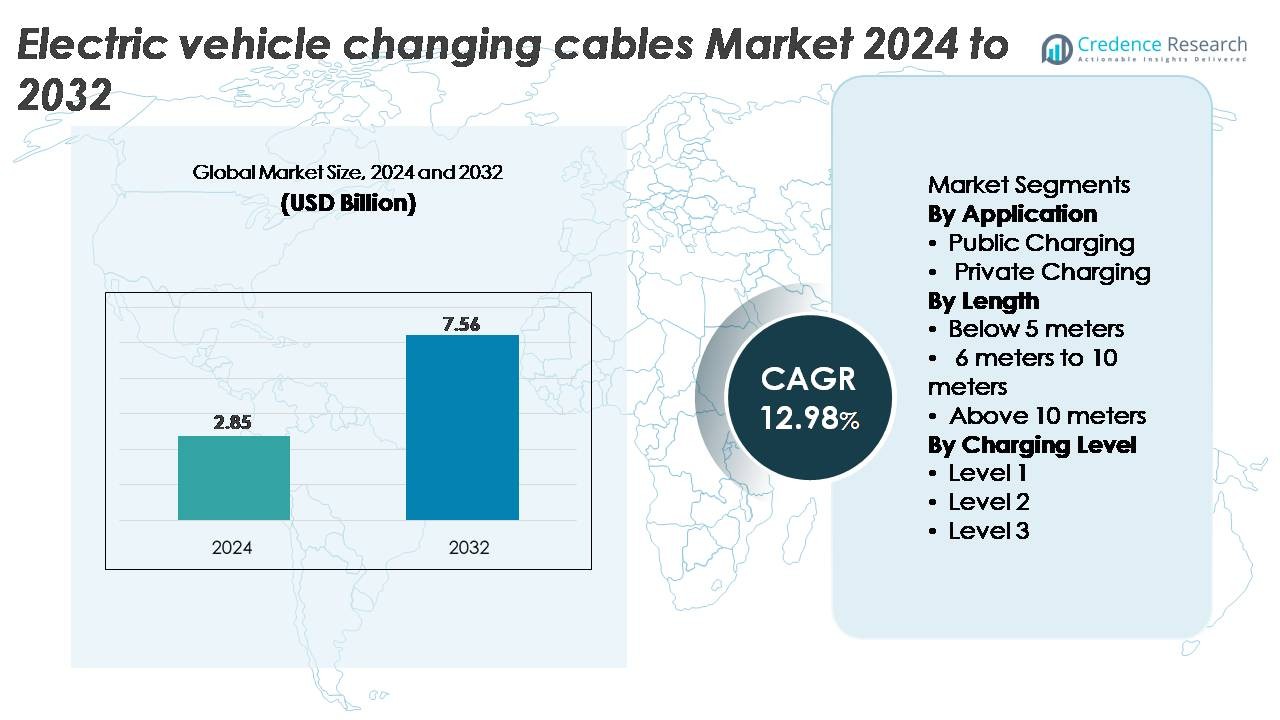
The Electric Vehicle (EV) Charging Cables Market was valued at USD 2.85 billion in 2024 and is projected to reach USD 7.56 billion by 2032, exhibiting a strong CAGR of 12.98% over the forecast period.
| REPORT ATTRIBUTE |
DETAILS |
| Historical Period |
2020-2023 |
| Base Year |
2024 |
| Forecast Period |
2025-2032 |
| Electric Vehicle (EV) Charging Cables Market Size 2024 |
USD 2.85 Billion |
| Electric Vehicle (EV) Charging Cables Market, CAGR |
12.98% |
| Electric Vehicle (EV) Charging Cables Market Size 2032 |
USD 7.56 Billion |
The electric vehicle charging cables market is shaped by established players such as Aptiv, BESEN Group, Leoni AG, TE Connectivity, Coroplast, and Phoenix Contact, each contributing advanced conductor technologies, durable insulation systems, and compliant connector architectures tailored for AC and DC charging. These companies compete by enhancing thermal stability, fast-charging compatibility, and ergonomic handling for both public and residential charging environments. Europe leads the market with a 36% share, supported by dense charging networks, strong regulatory mandates, and rapid deployment of high-power charging corridors. This region’s focus on interoperability and safety standards enables sustained demand for premium, high-performance charging cables.
Access crucial information at unmatched prices!
Request your sample report today & start making informed decisions powered by Credence Research Inc.!
Download Sample
Market Insights
- The electric vehicle charging cables market was valued at USD 2.85 billion in 2024 and is projected to reach USD 7.56 billion by 2032, reflecting a 12.98% CAGR during the forecast period.
- Market growth is driven by rapid expansion of public fast-charging networks, rising EV adoption, and increased installation of Level 2 residential chargers, with public charging emerging as the dominant application segment.
- Key trends include rising deployment of high-power and liquid-cooled cable technologies, growing standardization across connector types, and accelerated investment in ultra-fast and megawatt-charging systems.
- Competition intensifies among leading players such as Aptiv, BESEN Group, Leoni AG, TE Connectivity, Coroplast, and Phoenix Contact, all focusing on advanced insulation materials, thermal management, and compliance with evolving safety standards; however, high costs of premium cables and supply chain constraints act as major restraints.
- Regionally, Europe leads with 36%, followed by North America at 32% and Asia-Pacific at 28%, while the 6–10 meter cable length segment maintains the largest share due to its versatility across public and private charging environments.
 Market Segmentation Analysis:
By Application
Public charging dominates the electric vehicle charging cables market, holding the largest share due to the rapid expansion of commercial charging networks and government-backed infrastructure programs. High-throughput DC fast-charging hubs, destination charging points, and highway corridor installations drive demand for durable, high-capacity cables with enhanced thermal management and safety compliance. Rising EV adoption in urban regions and fleet electrification accelerates deployments by utilities, municipalities, and private operators. Private charging grows steadily as residential installations increase, but public networks remain the primary revenue generator because of higher usage frequency and greater cable replacement requirements.
- For instance, Phoenix Contact’s CHARX high-power liquid-cooled charging cable supports continuous currents of 800 A and peak loads up to 1,000 A, maintaining conductor temperatures below 55°C even during extended high-load sessions, making it ideally suited for public ultra-fast charging environments.
By Length
Cables in the 6–10-meter range account for the largest market share, driven by their suitability for both public stations and residential units that require flexible reach without excessive voltage drop. This length supports efficient maneuverability across parking configurations while meeting regulatory standards for safety and charging performance. Below-5-meter cables remain popular for compact home setups but lack versatility for commercial environments. Above-10-meter cables serve bus depots and fleet yards but face adoption constraints due to higher resistive losses and bulkiness. The dominance of the 6–10-meter segment reflects its optimal balance between usability, efficiency, and cost.
- For instance, Leoni AG produces Type 2 charging cables that are designed to support a continuous current load of 32 A (amperes), facilitating efficient AC charging at capacities of up to 7.4 kW (single-phase) or 22 kW (three-phase).
By Charging Level
Level 2 charging leads the market with the highest share, supported by widespread integration in residential, workplace, and commercial charging environments. Its ability to deliver faster charging than Level 1 while maintaining lower infrastructure costs than Level 3 makes it the preferred choice for mainstream EV users. Level 2 cables support higher current ratings, robust insulation materials, and compatibility with a broad vehicle range, driving sustained demand. Level 3 DC fast-charging cables gain momentum as ultra-fast public networks expand, but they involve higher investment and specialized cooling technologies, keeping Level 2 as the dominant and most scalable segment.
Key Growth Drivers
Expansion of Public and Commercial Fast-Charging Infrastructure
The rapid buildout of public and commercial EV charging networks remains a primary driver of demand for advanced EV charging cables. Governments, utilities, and private operators are investing heavily in high-power charging corridors, urban hubs, fleet depots, and destination charging centers. This expansion requires cables capable of supporting higher voltages and currents, robust insulation, and enhanced thermal stability to meet heavy-duty usage patterns. As charging operators pursue faster turnaround times and higher station utilization, the adoption of high-capacity cables especially those designed for Level 3 fast-charging intensifies. Fleet electrification across logistics, mobility services, and municipal transport further accelerates cable replacement cycles and performance upgrades. Public charging networks prioritize reliability, interoperability, and compliance with evolving global standards, expanding opportunities for manufacturers offering advanced materials, improved ergonomics, and safer connector designs.
· For instance, HUBER+SUHNER’s RADOX® HPC500 liquid-cooled cable supports continuous charging at 500 A and enables power delivery above 400 kW while keeping conductor temperatures stable under sustained load, making it suitable for public fast-charging stations.
Accelerating EV Adoption and Home Charging Installations
Rising consumer adoption of electric vehicles directly increases the need for efficient home charging solutions, positioning Level 2 residential installations as a strong growth driver for the EV charging cable market. Homeowners increasingly opt for faster overnight charging, prompting demand for cables with higher current ratings, improved durability, and enhanced weather resistance. Residential environments also require flexible cable lengths, compact connector designs, and safety features such as overheat protection and ground monitoring. Utility incentives, tax credits, and home charging rebates further encourage installation of dedicated charging units, boosting cable demand. As automakers bundle home chargers with new EV purchases, the aftermarket for replacement cables also grows steadily. The standardization of charging interfaces across vehicle brands enhances consumer confidence and supports mass-market adoption, reinforcing residential charging as a foundational contributor to market expansion.
· For example, BESEN Group offers Type 2 residential EV charging cables rated for 32 A and 250 V, compliant with IEC 62196-2 standards used for home AC charging. The cables feature cross-linked insulation and reinforced sheathing designed for long-term daily use in residential environments.
Advancements in High-Power Charging and Cable Thermal Management
Technological advancements in high-power charging systems significantly accelerate demand for specialized EV charging cables engineered for faster charging and improved heat dissipation. The evolution of 150–350 kW charging platforms requires cables with high-grade copper conductors, advanced insulation compounds, and low-resistance architectures. Innovations such as liquid-cooled charging cables enable safe transmission of ultra-high currents without excessive heat buildup, extending operational lifespan and ensuring user safety. These advancements are critical for supporting next-generation EVs equipped with larger battery packs and higher voltage architectures. As automakers push for reduced charging times and interoperability across global standards, manufacturers are developing cables with enhanced flexibility, abrasion resistance, and compact cooling channels. These performance improvements drive adoption across commercial fast-charging networks and position high-power cables as a key enabler of rapid EV charging ecosystem growth.
Key Trends & Opportunities
Growth of Ultra-Fast and Megawatt-Level Charging Technologies
The shift toward ultra-fast charging and megawatt-scale systems presents substantial opportunities for manufacturers of advanced EV charging cables. As heavy-duty vehicles, commercial fleets, and long-haul trucks transition to electric platforms, the need for cables supporting extremely high power transfer becomes critical. Megawatt Charging System (MCS) developments push cable engineering toward more sophisticated cooling systems, optimized conductor geometry, and improved electromagnetic shielding. This trend also drives innovation in ergonomic connector design and automation-assisted cable handling at high-current stations. Companies capable of delivering scalable, high-durability cables aligned with future charging standards will benefit from early positioning in this emerging high-power segment.
· For example, Phoenix Contact is actively developing Megawatt Charging System (MCS) technology designed to meet industry targets of up to 3,000 A and 1,250 V for heavy-duty vehicle fast charging. The company has demonstrated liquid-cooled MCS connector and cable prototypes that align with these specifications and support future megawatt-class charging infrastructure.
Increasing Standardization and Interoperability Across Global Markets
Global interoperability initiatives create new opportunities by encouraging harmonization of charging standards and cross-compatibility between chargers and vehicles. Standardization efforts around connectors, safety protocols, and communication interfaces reduce complexity and drive volume demand for unified cable architectures. Markets adopting CCS, CHAdeMO’s next-generation protocols, or GB/T advancements create opportunities for cable suppliers offering multi-standard and modular solutions. Standardization also simplifies manufacturing, supports economies of scale, and accelerates global deployment of consistent charging infrastructure. As automakers and station operators converge on common technologies, suppliers capable of delivering compliant, certified, and future-ready cable systems gain a competitive advantage.
· For instance, TE Connectivity develops High Power Charging (HPC) cable assemblies engineered for up to 1,000 V systems and 500 A continuous fast-charging operation. The assemblies are built with reinforced insulation and meet the interoperability and safety requirements defined in IEC and UL standards for high-power EV charging.
Rising Integration of Smart Cable Technologies and Embedded Safety Systems
The integration of intelligent monitoring features into charging cables presents growing opportunities for differentiation and value-added services. Smart cables with embedded temperature sensors, load monitoring, auto-shutdown circuits, and data communication modules enhance user safety and support predictive maintenance. These functionalities are increasingly important for high-use public stations and fleet operations, where overheating or wear can result in costly downtime. Enhanced diagnostic capabilities also support real-time monitoring within networked charging ecosystems. Manufacturers that integrate electronics, cloud connectivity, and advanced materials into their cable offerings can tap into premium segments and support the broader digitalization of EV charging environments.
Key Challenges
Technical and Safety Complexities in High-Power Cable Development
Developing cables capable of safely handling high-power charging presents substantial engineering challenges. As charging speeds increase, cables must manage higher currents, minimize resistive heat, and maintain structural integrity under frequent flexing. Achieving these requirements demands advanced conductor materials, superior insulation, and innovative thermal management solutions such as liquid cooling. Meeting stringent global certification standards further increases development complexity and cost. Cable weight, stiffness, and user ergonomics also pose challenges, particularly for ultra-fast chargers that require thicker, more robust assemblies. Balancing durability, performance, and cost remains difficult, constraining rapid scalability of high-power cable technologies.
Cost Pressures and Supply Chain Constraints Affecting Cable Manufacturing
Manufacturers face ongoing cost challenges driven by fluctuating prices of copper, high-performance polymers, and specialized components required for advanced charging cables. Supply chain disruptions, geopolitical uncertainties, and limited availability of high-purity conductive materials further strain production economics. Compliance with international safety and durability standards adds additional testing and certification expenses. For operators and consumers, high-quality cables especially liquid-cooled or fast-charging variants carry premium costs that can limit adoption in cost-sensitive markets. Balancing affordability with performance requirements remains a persistent hurdle, particularly as global EV adoption expands into emerging economies with tighter budget constraints.
Regional Analysis
North America
North America holds approximately 32% of the electric vehicle charging cables market, supported by rapid EV adoption, large-scale fast-charging deployments, and favorable federal incentives. The U.S. National Electric Vehicle Infrastructure (NEVI) program accelerates installation of high-power charging corridors, driving strong demand for durable, high-capacity cables. Widespread residential charging adoption further boosts Level 2 cable consumption. Automaker investments in EV manufacturing clusters in states such as Michigan, Texas, and California reinforce infrastructure growth. Canada’s increasing focus on clean transportation also contributes to market expansion, ensuring stable demand across both public and private charging segments.
Europe
Europe accounts for the largest share at around 36%, driven by stringent emission regulations, accelerated EV penetration, and mature public charging networks. Countries such as Germany, the U.K., France, and the Netherlands lead deployments of high-speed charging stations, increasing demand for advanced thermal-managed cables. The EU’s Alternative Fuels Infrastructure Regulation (AFIR) mandates dense corridor coverage, encouraging adoption of fast-charging cables with high current ratings. Strong interoperability initiatives and widespread preference for CCS standards further unify the regional market. Growing residential charger installations, supported by government incentives, reinforce Europe’s position as a technology-forward charging infrastructure hub.
Asia-Pacific
Asia-Pacific holds about 28% of the market and represents the fastest-growing region, propelled by expanding EV fleets in China, Japan, South Korea, and India. China’s dominant charging infrastructure ecosystem, including nationwide DC fast-charging networks, drives high-volume demand for both cooled and non-cooled cables. Japan and South Korea continue advancing cable standards aligned with next-generation fast-charging technologies. Growing investments in urban electrification, large public transit charging programs, and rising adoption of electric two-wheelers and commercial fleets further accelerate cable consumption. Government subsidies and strong participation from regional manufacturers support sustained infrastructure scaling.
Latin America
Latin America captures approximately 3% of the market, with growth centered in Brazil, Mexico, and Chile. Increasing EV imports, supportive clean-mobility policies, and early-stage charging corridor development stimulate demand for basic AC and emerging DC fast-charging cables. Infrastructure remains uneven across countries, but private operators and energy companies are expanding public charging footprints in major urban centers. Fleets used in logistics and ride-hailing services gradually adopt electrification, generating niche demand for higher-capacity cables. Although the market is nascent, growing regulatory alignment with global charging standards positions the region for accelerated adoption over the next decade.
Middle East & Africa
The Middle East & Africa region accounts for roughly 1% of global market share but shows strong long-term potential as governments invest in sustainable transport initiatives. The UAE and Saudi Arabia lead EV infrastructure expansion, deploying fast-charging corridors that require robust, high-performance cable systems. Emerging adoption of electric fleets, particularly in public transportation and commercial mobility, gradually increases demand for higher-capacity charging hardware. In Africa, infrastructure remains limited, but pilot programs in South Africa, Morocco, and Kenya introduce early opportunities for AC charging cable adoption. Economic diversification strategies and green-mobility policies support future market growth.
Market Segmentations:
By Application
- Public Charging
- Private Charging
By Length
- Below 5 meters
- 6 meters to 10 meters
- Above 10 meters
By Charging Level
By Geography
- North America
- Europe
- Germany
- France
- U.K.
- Italy
- Spain
- Rest of Europe
- Asia Pacific
- China
- Japan
- India
- South Korea
- South-east Asia
- Rest of Asia Pacific
- Latin America
- Brazil
- Argentina
- Rest of Latin America
- Middle East & Africa
- GCC Countries
- South Africa
- Rest of the Middle East and Africa
Competitive Landscape
The electric vehicle charging cables market features a competitive landscape dominated by global manufacturers focused on advancing cable performance, safety, and compatibility across evolving charging standards. Leading companies emphasize high-power cable technologies, liquid-cooled architectures, and enhanced thermal management to support rapid expansion of fast-charging networks. Continuous investment in R&D enables suppliers to improve conductor efficiency, insulation durability, and ergonomic connector designs. Strategic collaborations among automakers, charging network operators, and component suppliers accelerate development of standardized, interoperable solutions. Many manufacturers expand production capacities and localize operations to meet rising regional demand while maintaining compliance with international certifications. Competition also intensifies around materials innovation, including abrasion-resistant sheathing and high-flexibility compounds tailored for heavy-duty public chargers. As ultra-fast and megawatt-level charging systems emerge, companies capable of delivering high-reliability, long-life cable systems strengthen their market positioning. Overall, differentiation increasingly centers on technological innovation, cost efficiency, and global certification adherence.
Key Player Analysis
- Aptiv (Dublin, Ireland)
- BESEN Group (Jiangsu, China)
- Leoni AG (Nürnberg, Germany)
- TE Connectivity (Schaffhausen, Switzerland)
- Coroplast (Wuppertal, Germany)
- Phoenix Contact (Blomberg, Germany)
Recent Developments
- In May 2025, Leoni Cable Solutions was acquired by Time Interconnect, marking a new phase of growth with improved financial stability and innovative strength for its EV cable technologies, including those showcased for electromobility at events like The Battery Show Europe.
- In May 2025, Phoenix Contact introduced a second-generation line of its liquid-cooled cables and CCS inlets under its CHARX connect family. The new system supports charging powers up to 700 kW, with a “boost mode” reaching up to 1 MW, marking a major milestone for ultra-fast public and commercial charging deployments.
- In September 2024, Coroplast announced its participation in the major European supplier trade fair IZB 2024 where its divisions including its cable-solutions arm Coroflex will present new wire-harness and charging-cable solutions tailored for EVs and battery systems.
Shape Your Report to Specific Countries or Regions & Enjoy 30% Off!
Report Coverage
The research report offers an in-depth analysis based on Application, Length, Charging level and Geography. It details leading market players, providing an overview of their business, product offerings, investments, revenue streams, and key applications. Additionally, the report includes insights into the competitive environment, SWOT analysis, current market trends, as well as the primary drivers and constraints. Furthermore, it discusses various factors that have driven market expansion in recent years. The report also explores market dynamics, regulatory scenarios, and technological advancements that are shaping the industry. It assesses the impact of external factors and global economic changes on market growth. Lastly, it provides strategic recommendations for new entrants and established companies to navigate the complexities of the market.
Future Outlook
- Adoption of high-power DC fast-charging cables will accelerate as automakers move toward higher-voltage architectures and faster charging capabilities.
- Liquid-cooled cable systems will gain wider use to support ultra-high current transfer while maintaining manageable cable weight and flexibility.
- Standardization across global connector formats will strengthen interoperability, reducing complexity for charging operators and vehicle manufacturers.
- Smart cables with embedded sensors and thermal monitoring features will become mainstream to enhance safety and predictive maintenance.
- Expansion of public charging corridors will increase demand for durable, heavy-duty cables designed for high-cycle operation.
- Residential Level 2 charging will continue to grow, driving consistent demand for mid-length, high-efficiency cable assemblies.
- Fleet electrification in logistics, ride-hailing, and public transport will boost adoption of robust, long-life cable solutions tailored for intensive usage.
- Sustainability requirements will encourage development of recyclable insulation materials and lower-carbon manufacturing processes.
- Emerging megawatt-level charging systems will create a new premium segment for advanced commercial vehicle cables.
- Regional manufacturing localization will rise as governments promote domestic EV infrastructure supply chains.


