
Market Overview
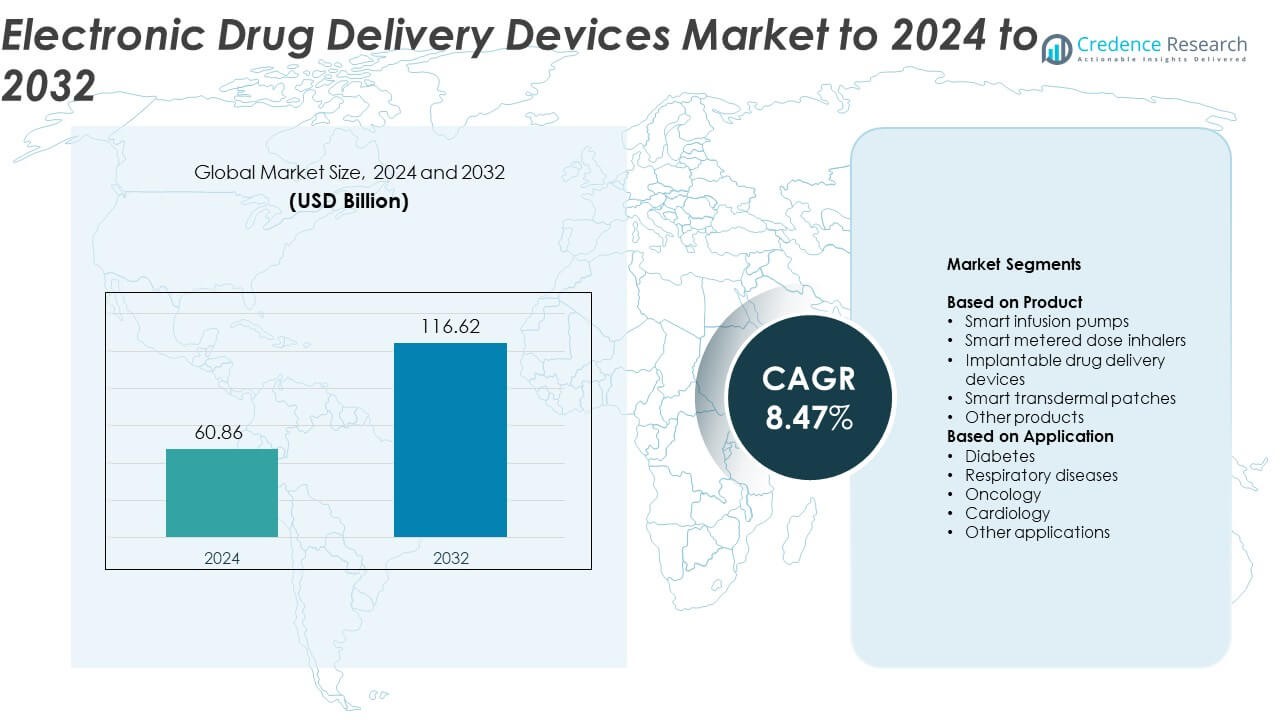
Electronic Drug Delivery Devices Market size was valued at USD 60.86 Billion in 2024 and is anticipated to reach USD 116.62 Billion by 2032, at a CAGR of 8.47% during the forecast period.
| REPORT ATTRIBUTE | DETAILS |
|---|---|
| Historical Period | 2020-2023 |
| Base Year | 2024 |
| Forecast Period | 2025-2032 |
| Electronic Drug Delivery Devices Market Size 2024 | USD 60.86 Billion |
| Electronic Drug Delivery Devices Market, CAGR | 8.47% |
| Electronic Drug Delivery Devices Market Size 2032 | USD 116.62 Billion |
The electronic drug delivery devices market is led by major players such as Medtronic, Haselmeier, Eli Lilly and Company, Gerresheimer, Abbott Laboratories, Nemera, Novo Nordisk, AstraZeneca, Becton, Dickinson and Company, and Insulet. These companies focus on advancing smart, connected, and patient-centric drug delivery solutions through innovation and strategic collaborations. North America dominates the global market with a 38.6% share in 2024, supported by strong healthcare infrastructure and rapid adoption of digital technologies. Europe follows with a 27.4% share, driven by regulatory support and rising chronic disease prevalence, while Asia Pacific emerges as a key growth region with expanding healthcare access and rising demand for self-administration devices.
Market Insights
- The electronic drug delivery devices market was valued at USD 60.86 Billion in 2024 and is projected to reach USD 116.62 Billion by 2032, growing at a CAGR of 8.47%.
- Rising prevalence of chronic diseases such as diabetes and respiratory disorders is a key driver, increasing demand for smart infusion pumps and connected insulin delivery systems.
- Growing adoption of wearable and AI-integrated drug delivery solutions is shaping new trends, improving treatment precision and patient adherence.
- The market is highly competitive, with leading companies focusing on miniaturization, digital connectivity, and personalized therapy systems to strengthen their global presence.
- North America leads with a 38.6% share in 2024, followed by Europe at 27.4% and Asia Pacific at 23.1%, while smart infusion pumps hold the dominant 36.4% product share supported by widespread use in hospital and homecare settings.
Market Segmentation Analysis:
By Product
Smart infusion pumps dominate the electronic drug delivery devices market, accounting for nearly 36.4% share in 2024. Their leadership stems from the rising adoption of automated infusion systems in hospitals and home care. These devices provide precise medication dosage control, reducing human error and improving patient safety. Advancements such as wireless connectivity and integration with electronic health records enhance workflow efficiency. Smart metered dose inhalers and implantable drug delivery devices are also expanding rapidly due to increasing use in chronic disease management and personalized drug delivery solutions.
- For instance, Tandem Diabetes Care had approximately 480,000 active users of its t:slim X2 pump by the end of 2021 and reported achieving a milestone of over 1 million insulin boluses delivered via its app feature in just one month in 2022.
By Application
The diabetes segment leads the market, holding around 41.2% share in 2024. This dominance is driven by the growing prevalence of diabetes and the widespread adoption of connected insulin pumps and smart injectors. Electronic delivery systems improve dosing accuracy and treatment adherence among patients. Rising adoption of continuous glucose monitoring integrated with insulin delivery supports further growth. Meanwhile, applications in oncology and respiratory diseases are gaining momentum with the development of targeted and controlled-release drug delivery technologies.
- For instance, Insulet disclosed approximately 500,000 active global Omnipod customers in 2024, including approximately 365,000 Omnipod 5 users, underscoring diabetes as the top application for their technology
Key Growth Drivers
Rising Prevalence of Chronic Diseases
The growing incidence of chronic conditions such as diabetes, asthma, and cardiovascular disorders is driving demand for electronic drug delivery devices. These technologies support continuous monitoring and accurate medication dosing, improving treatment outcomes. Increasing patient preference for self-administration and home-based care solutions further fuels market expansion. Manufacturers are focusing on smart, user-friendly designs that reduce hospital dependency and enhance patient compliance, reinforcing market growth worldwide.
- For instance, Dexcom closed 2024 with approximately 2.8–2.9 million global CGM users, reflecting rising chronic-disease monitoring.
Technological Advancements in Smart Drug Delivery Systems
Rapid innovation in connected and automated drug delivery technologies strengthens market performance. Integration of wireless communication, Bluetooth, and IoT capabilities allows real-time monitoring and dosage control. These systems improve medication accuracy, reduce wastage, and enable data-driven clinical decisions. Advancements in sensors and microelectronics also support the miniaturization of devices, making them more convenient for long-term use. Continuous R&D investment from leading manufacturers enhances product reliability and expands application areas.
- For instance, Abbott stated its FreeStyle Libre technology is used by more than 7 million people worldwide across over 60 countries, as reported in company press releases in August 2025.
Shift Toward Personalized and Home-Based Healthcare
Increasing emphasis on personalized medicine and home-based care is accelerating the adoption of smart delivery devices. Patients prefer self-administered, easy-to-use systems that reduce clinic visits and treatment costs. These devices improve adherence by tailoring dosage based on patient-specific requirements. The rise in telehealth and remote monitoring platforms further promotes adoption, enabling healthcare providers to track treatment progress efficiently. This shift aligns with global efforts to modernize chronic disease management.
Key Trends & Opportunities
Integration of AI and Digital Health Platforms
Artificial intelligence and digital health integration present major opportunities for electronic drug delivery devices. AI-enabled analytics help optimize dosing schedules, monitor patient adherence, and predict potential health issues. Digital platforms allow data synchronization with healthcare systems, improving clinical efficiency. The growing ecosystem of connected health devices creates new business models for continuous patient engagement and outcome-based healthcare delivery.
- For instance, Medtronic published real-world evidence showing 100,000+ MiniMed 780G users, highlighting AI-assisted automated insulin delivery at scale.
Emergence of Wearable and Connected Delivery Devices
Wearable electronic drug delivery systems are gaining popularity due to their convenience and continuous operation. Smart patches and portable injectors offer discreet, controlled medication release for chronic conditions. These devices improve patient mobility and compliance while enabling data collection for healthcare analytics. The expansion of wearable technology and sensor-based innovations provides a strong growth avenue for manufacturers targeting remote and preventive healthcare markets.
- For instance, Ypsomed has over 70 separate drug products based on its platforms already on the market around the world, with a further 150 projects moving through clinical trials or being prepared for commercial launch.
Key Challenges
High Development and Maintenance Costs The electronic drug delivery devices market faces challenges due to the high cost of technology development and product maintenance. Advanced components, sensor integration, and regulatory testing increase overall expenses. These costs limit affordability for patients in low- and middle-income regions. Additionally, frequent upgrades and software updates add to lifecycle costs, creating barriers for large-scale adoption in cost-sensitive healthcare systems.
Stringent Regulatory Requirements and Data Security Concerns
Strict approval processes and data privacy regulations pose significant hurdles for market players. Electronic drug delivery devices must comply with multiple regional safety and cybersecurity standards before commercialization. Data protection concerns, particularly with connected devices, can affect user trust and market adoption. Meeting these compliance demands requires extensive validation, slowing time-to-market and increasing operational costs for manufacturers.
Regional Analysis
North America
North America dominates the electronic drug delivery devices market, holding around 38.6% share in 2024. The region’s leadership is driven by advanced healthcare infrastructure, high adoption of smart medical technologies, and strong reimbursement frameworks. Rising cases of diabetes and respiratory disorders encourage demand for connected infusion and insulin delivery systems. The United States remains the largest contributor due to active product innovation and strong presence of major manufacturers. Ongoing integration of IoT and AI in healthcare settings further enhances regional growth and patient-centric treatment models.
Europe
Europe accounts for about 27.4% share of the global electronic drug delivery devices market in 2024. Increasing prevalence of chronic diseases and supportive regulatory standards for digital health solutions are driving regional expansion. The U.K., Germany, and France are key contributors due to investments in smart drug administration systems and digital patient monitoring tools. Growing focus on reducing medication errors and improving adherence supports device adoption across hospitals and home care settings. Rising collaborations between medtech firms and research institutions further promote innovation and market maturity.
Asia Pacific
Asia Pacific captures approximately 23.1% share of the electronic drug delivery devices market in 2024. The region’s growth is propelled by increasing healthcare spending, expanding chronic disease burden, and greater acceptance of smart medical devices. Countries such as China, Japan, and India are experiencing rapid adoption of connected insulin pumps and inhalers. The growing middle-class population and awareness of self-care solutions enhance product penetration. Government initiatives supporting digital healthcare and domestic manufacturing strengthen the region’s position as a key emerging market for electronic delivery systems.
Latin America
Latin America holds nearly 6.2% share in the electronic drug delivery devices market in 2024. The region’s progress is supported by rising healthcare modernization and increasing adoption of portable and cost-effective drug delivery systems. Brazil and Mexico are leading markets, driven by growing awareness of self-administration devices for chronic disease management. Limited access to advanced technologies and lower healthcare expenditure pose challenges. However, partnerships between local distributors and international manufacturers are improving product availability and enhancing adoption across hospitals and home-based care.
Middle East & Africa
The Middle East & Africa region accounts for around 4.7% share of the electronic drug delivery devices market in 2024. Market growth is supported by improving healthcare infrastructure and expanding access to chronic disease management programs. Countries like Saudi Arabia, the UAE, and South Africa are witnessing gradual adoption of smart infusion pumps and wearable delivery systems. Government investments in e-health and telemedicine encourage the use of digital and connected medical devices. However, limited reimbursement and regulatory complexities continue to restrict large-scale market penetration.
Market Segmentations:
By Product
- Smart infusion pumps
- Smart metered dose inhalers
- Implantable drug delivery devices
- Smart transdermal patches
- Other products
By Application
- Diabetes
- Respiratory diseases
- Oncology
- Cardiology
- Other applications
By Geography
- North America
- U.S.
- Canada
- Mexico
- Europe
- Germany
- France
- U.K.
- Italy
- Spain
- Rest of Europe
- Asia Pacific
- China
- Japan
- India
- South Korea
- South-east Asia
- Rest of Asia Pacific
- Latin America
- Brazil
- Argentina
- Rest of Latin America
- Middle East & Africa
- GCC Countries
- South Africa
- Rest of the Middle East and Africa
Competitive Landscape
Key players in the electronic drug delivery devices market include Medtronic, Haselmeier, Eli Lilly and Company, Gerresheimer, Abbott Laboratories, Nemera, Novo Nordisk, AstraZeneca, Becton, Dickinson and Company, and Insulet. The market is characterized by continuous technological innovation, strategic collaborations, and expansion into digital health ecosystems. Companies are investing heavily in smart, connected delivery systems integrating IoT, AI, and wireless technologies to improve dosing accuracy and patient adherence. Manufacturers are also focusing on miniaturization and wearable formats to enhance patient comfort and mobility. Partnerships between pharmaceutical and medical device firms are increasing, enabling development of combination therapies and personalized treatment solutions. The competitive environment remains dynamic, with firms emphasizing regulatory compliance, data security, and user-friendly design. Growing competition is driving innovation in sustainability, material optimization, and lifecycle management, ensuring long-term growth across hospital, homecare, and outpatient applications globally.
Key Player Analysis
- Medtronic
- Haselmeier
- Eli Lilly and Company
- Gerresheimer
- Abbott Laboratories
- Nemera
- Novo Nordisk
- AstraZeneca
- Becton, Dickinson and Company
- Insulet
Recent Developments
- In Aug 2025, Abbott India launched FreeStyle Libre 2 Plus, an advanced glucose monitoring device for diabetes management
- In 2025, Gerresheimer showcased its expanded portfolio of containment solutions and drug delivery systems at Pharmapack 2025 in Paris.
- In 2022, BD launched the BD Effivax™ Glass Prefillable Syringe, which is a next-generation prefillable syringe designed for reliability and efficiency in vaccine delivery.
Report Coverage
The research report offers an in-depth analysis based on Product, Application and Geography. It details leading market players, providing an overview of their business, product offerings, investments, revenue streams, and key applications. Additionally, the report includes insights into the competitive environment, SWOT analysis, current market trends, as well as the primary drivers and constraints. Furthermore, it discusses various factors that have driven market expansion in recent years. The report also explores market dynamics, regulatory scenarios, and technological advancements that are shaping the industry. It assesses the impact of external factors and global economic changes on market growth. Lastly, it provides strategic recommendations for new entrants and established companies to navigate the complexities of the market.
Future Outlook
- Adoption of AI-driven and connected drug delivery systems will continue to accelerate.
- Integration of cloud-based monitoring will enhance real-time patient management.
- Miniaturized and wearable devices will gain strong traction for chronic disease care.
- Demand for self-administration solutions will grow with rising home healthcare trends.
- Advances in biosensors will improve precision and adherence in medication delivery.
- Expansion of 5G networks will strengthen device connectivity and data transfer speed.
- Personalized drug delivery systems will become central to patient-centric therapies.
- Collaborations between medtech and pharmaceutical firms will increase product innovation.
- Emerging markets will witness faster adoption due to healthcare modernization.
- Regulatory harmonization will streamline global product approvals and commercialization.

Request a Free Sample
Fill in your details and we'll send you a free sample report.
- Sample data tables & charts
- Research methodology
Need a Custom Version of This Report?
Tailor the scope, geography, or segments to your exact requirements.
- Custom geography or segment scope
- Direct access to our analyst team
Frequently Asked Questions
What is the current market size for Electronic Drug Delivery Devices Market, and what is its projected size in 2032?
At what Compound Annual Growth Rate is the Electronic Drug Delivery Devices Market projected to grow between 2025 and 2032?
Which Electronic Drug Delivery Devices Market segment held the largest share in 2024?
What are the primary factors fueling the growth of the Electronic Drug Delivery Devices Market?
Who are the leading companies in the Electronic Drug Delivery Devices Market?
Which region commanded the largest share of the Electronic Drug Delivery Devices Market in 2024?
Table of Content
Chapter 1. Report Introduction
- 1.1 Report Description & Purpose
- 1.1.1 Report Title & Market Definition
- 1.1.2 Unique Selling Propositions (USP) & Key Differentiators
- 1.1.3 Value Proposition for Stakeholders
- 1.2 Research Objectives
- 1.2.1 Market Sizing Objectives (Volume & Revenue) (Volume Where Applicable)
- 1.2.2 Segmentation Objectives
- 1.2.3 Competitive Intelligence Objectives
- 1.2.4 Forecast & Scenario Objectives
- 1.3 Report Scope
- 1.3.1 Electronic Drug Delivery Devices Scope – Segments & Subsegments Covered
- 1.3.2 Geographic Scope – Regions & Countries Covered
- 1.3.3 Historical Period, Base Year & Forecast Period (2024; forecast to 2032)
- 1.3.4 Inclusions & Exclusions
- 1.4 Industry Classification & Applicable Codes
- 1.5 Currency, Measurement Units & Valuation Basis
- 1.6 Target Stakeholders
- 1.7 Limitations & Assumptions
Chapter 2. Executive Summary
- 2.1 Global Electronic Drug Delivery Devices Market Snapshot
- 2.1.1 Market Size – Historical (2024) & Forecast (2024-2032) (2024: USD 60.86 Billion → 2032: USD 116.62 Billion)
- 2.1.2 Volume & Revenue – Global Totals (Volume Where Applicable)
- 2.1.3 Key Market Highlights – Top Five Facts
- 2.2 Electronic Drug Delivery Devices Market Segmentation Snapshot
- 2.2.1 Market Split by Region – 2024 vs. 2032
- 2.3 Competitive Snapshot
- 2.3.1 Top 10 Players by Revenue Share – 2024
- 2.3.2 Top 10 Players by Volume Share – 2024 (Volume Where Applicable)
- 2.3.3 Recent Strategic Developments (18-Month Summary)
- 2.4 Key Investment Highlights & Strategic Conclusions
Chapter 3. Electronic Drug Delivery Devices Market Dynamics & Industry Analysis
- 3.1 Market Overview & Context
- 3.1.1 Electronic Drug Delivery Devices Market Position in the Broader Industry Value Chain
- 3.1.2 Demand Structure & Purchasing Dynamics
- 3.1.3 Market Maturity & Development Stage by Region
- 3.2 Electronic Drug Delivery Devices Market Drivers
- 3.3 Electronic Drug Delivery Devices Market Restraints & Challenges
- 3.4 Electronic Drug Delivery Devices Market Opportunities
- 3.5 Porter's Five Forces Analysis
- 3.5.1 Threat of New Entrants
- 3.5.2 Bargaining Power of Suppliers
- 3.5.3 Bargaining Power of Buyers
- 3.5.4 Threat of Substitutes
- 3.5.5 Competitive Rivalry – Intensity Assessment
- 3.6 Electronic Drug Delivery Devices Value Chain Analysis
- 3.6.1 Upstream – Key Inputs, Resources & Suppliers
- 3.6.1.1 Key Input/Resource 1
- 3.6.1.2 Key Input/Resource 2
- 3.6.1.3 Key Input/Resource 3
- 3.6.2 Midstream – Core Operations & Value Creation
- 3.6.2.1 Operating Model & Process Overview
- 3.6.2.2 Key Operating Locations & Capabilities by Company
- 3.6.3 Downstream – Market Channels & End Users
- 3.6.3.1 Direct Sales & Customer Engagement Channels
- 3.6.3.2 Indirect Sales, Intermediaries & Partner Channels
- 3.6.4 Value Chain Profitability Analysis
- 3.6.1 Upstream – Key Inputs, Resources & Suppliers
- 3.7 PESTEL Analysis
- 3.7.1 Political Factors
- 3.7.2 Economic Factors
- 3.7.3 Social Factors
- 3.7.4 Technological Factors
- 3.7.5 Environmental Factors
- 3.7.6 Legal Factors
- 3.8 Electronic Drug Delivery Devices Supply Chain Analysis
- 3.8.1 Critical Input & Resource Availability Risk Assessment
- 3.8.2 Supplier & Operational Concentration Risk (Geographic Exposure)
- 3.8.3 Supply & Service Disruption Impact Analysis
- 3.9 Regulatory & Policy Landscape
Note: The regulatory and policy landscape section covers regulations based on their applicability to the market, Electronic Drug Delivery Devices category, geography, and scope of the study. Only regulatory frameworks with a material impact on operations, compliance, trade, sustainability, or market access are analyzed in detail.
Chapter 4. Key Investment Pockets & Opportunity Analysis
- 4.1 Electronic Drug Delivery Devices Market Attractiveness Analysis
- 4.1.1 By Region – Investment Attractiveness Matrix (Market Size × CAGR)
- 4.2 Absolute Revenue Growth Opportunity
- 4.2.1 By Region – Absolute Revenue Growth Through 2032
- 4.3 Incremental Demand Opportunity
- 4.3.1 By Region – Incremental Demand Through 2032
- 4.3.2 Segment – Incremental Demand
- 4.4 Emerging Submarket Opportunity Deep Dive (Subject to Applicability)
- 4.5 Priority Market Opportunity Scorecards
- 4.5.1 United States
- 4.5.2 Europe
- 4.5.3 Asia
- 4.5.4 Middle East & Africa
Note: Priority market opportunity scorecards reflect the geographic scope and strategic relevance of the study. Listed markets are indicative and may be adapted to the industry.
Chapter 5. Electronic Drug Delivery Devices Cross-Border Trade & Market Access Analysis
- 5.1 International Trade & Cross-Border Activity Overview
- 5.1.1 Global Export Value by Country (2024)
- 5.1.2 Global Export Volume by Country (2024) (Volume Where Applicable)
- 5.1.3 Global Import Value by Country (2024)
- 5.1.4 Global Import Volume by Country (2024) (Volume Where Applicable)
- 5.1.5 Net Trade Balance by Country (2024)
- 5.2 Export Analysis – Segment
- 5.2.1 Category 1 (Applicable Classification Code)
- 5.2.2 Category 2 (Applicable Classification Code)
- 5.2.3 Category 3 (Applicable Classification Code)
- 5.2.4 Category 4 (Applicable Classification Code)
- 5.2.5 Category 5 (Applicable Classification Code)
- 5.3 Import Analysis – Segment
- 5.3.1 Category 1 (Applicable Classification Code)
- 5.3.2 Category 2 (Applicable Classification Code)
- 5.3.3 Category 3 (Applicable Classification Code)
- 5.3.4 Category 4 (Applicable Classification Code)
- 5.3.5 Category 5 (Applicable Classification Code)
- 5.4 Cross-Border Pricing & Transaction Benchmarks
- 5.4.1 Export Pricing – Segment & Country
- 5.4.2 Import Pricing – Segment & Source Country
- 5.4.3 Price Trends (2024)
- 5.5 Key Cross-Border Trade & Delivery Routes
- 5.5.1 Cross-Border Trade/Delivery Route 1
- 5.5.2 Cross-Border Trade/Delivery Route 2
- 5.5.3 Cross-Border Trade/Delivery Route 3
- 5.5.4 Cross-Border Trade/Delivery Route 4
- 5.5.5 Cross-Border Trade/Delivery Route 5
- 5.6 Trade Policy & Market Access Impact Assessment
- 5.6.1 Tariff & Non-Tariff Barriers
- 5.6.2 Regional Trade & Economic Integration Frameworks
- 5.6.3 Bilateral & Multilateral Trade Agreements
- 5.6.4 Cross-Border Operating, Licensing & Localization Requirements
Note: This chapter applies where cross-border trade or delivery is relevant to Electronic Drug Delivery Devices. Goods, services, and digital offerings are assessed using applicable classifications and transaction measures. Import-export volumes, trade balances, and route analyses are included only where meaningful to the market.
Chapter 6. Competitive Landscape & Company Benchmarking
- 6.1 Electronic Drug Delivery Devices Market Concentration & Structure
- 6.1.1 Herfindahl-Hirschman Index (HHI) – vs. 2024
- 6.1.2 Leading, Mid-Sized & Emerging Player Structure
- 6.1.3 Global, Regional & Local Player Dynamics
- 6.2 Electronic Drug Delivery Devices Market Share Analysis – 2024
- 6.2.1 Global Revenue Share by Company
- 6.2.2 Global Volume Share by Company (Volume Where Applicable)
- 6.2.3 Regional Revenue Share
- 6.2.4 Market Share Evolution ( vs. 2024)
- 6.2.5 Company Market Share by Key Segment
- 6.2.6 Company Market Share by Customer Group
- 6.3 Operating Scale, Capacity & Infrastructure Analysis
- 6.3.1 Global Operating Scale & Supply Capacity
- 6.3.2 Resource Utilization & Operating Efficiency
- 6.3.3 Output, Service Delivery & Activity Metrics
- 6.3.4 Operating Footprint & Infrastructure Map
- 6.3.5 Planned Operational & Capacity Expansion
- 6.4 Electronic Drug Delivery Devices Competitive Benchmarking Matrix
- 6.4.1 Revenue, Growth, Profitability & Operating Metric Comparison
- 6.4.2 Channel Revenue Mix
- 6.4.3 Geographic Revenue Exposure
- 6.4.4 R&D Intensity
- 6.4.5 Sustainability Maturity
- 6.5 Strategic Developments in Electronic Drug Delivery Devices (Last 24 Months)
- 6.5.1 Mergers, Acquisitions & Divestments
- 6.5.2 New Products, Services & Solutions in Electronic Drug Delivery Devices
- 6.5.3 Operational & Infrastructure Expansions
- 6.5.4 Strategic Alliances, Joint Ventures & Partnerships
- 6.5.5 Distribution Expansion & Market Entry
- 6.5.6 Sustainability & ESG Initiatives
- 6.6 Competitive Strategy Mapping
- 6.6.1 Leader, Challenger, Follower & Niche Classification
- 6.6.2 Pricing Strategy Comparison
- 6.6.3 Channel Strategy Matrix
Note: Strategic developments are included based on their materiality and the availability of reliable information.
Chapter 7. Global Electronic Drug Delivery Devices Market – By Sales & Delivery Channel
- 7.1 Segment Overview
- 7.1.1 Volume & Revenue Split by Channel (2024 & 2032) (Volume Where Applicable)
- 7.1.2 Channel Mix Evolution (2024-2032)
Chapter 8. Regional Market Analysis – Global Overview
- 8.1 Global Regional Overview
- 8.1.1 Regional Volume Share (Volume Where Applicable)
- 8.1.2 Regional Revenue Share
- 8.1.3 Regional Volume by Region (Volume Where Applicable)
- 8.1.4 Regional Revenue by Region
- 8.1.5 Regional Forecast Through 2032
- 8.2 Cross-Regional Segment Analysis
- 8.2.1 By Sales & Delivery Channel
- 8.2.2 By Competitive Positioning & Price Tier
Chapter 9. North America Electronic Drug Delivery Devices Market
- 9.1 United States
- 9.2 Canada
- 9.3 Mexico
Chapter 10. Europe Electronic Drug Delivery Devices Market
- 10.1 Germany
- 10.2 France
- 10.3 Italy
- 10.4 United Kingdom
- 10.5 Spain
- 10.6 Poland
- 10.7 Russia
- 10.8 Netherlands
- 10.9 Belgium
- 10.10 Sweden
- 10.11 Denmark
- 10.12 Norway
- 10.13 Rest of Europe
Chapter 11. Asia Pacific Electronic Drug Delivery Devices Market
- 11.1 China
- 11.2 India
- 11.3 Japan
- 11.4 South Korea
- 11.5 Thailand
- 11.6 Indonesia
- 11.7 Vietnam
- 11.8 Malaysia
- 11.9 Australia
- 11.10 Rest of Asia Pacific
Chapter 12. Latin America Electronic Drug Delivery Devices Market
- 12.1 Brazil
- 12.2 Argentina
- 12.3 Colombia
- 12.4 Chile
- 12.5 Rest of Latin America
Chapter 13. Middle East Electronic Drug Delivery Devices Market
- 13.1 Saudi Arabia
- 13.2 United Arab Emirates
- 13.3 Turkey
- 13.4 Israel
- 13.5 Iran
- 13.6 Rest of the Middle East
Chapter 14. Africa Electronic Drug Delivery Devices Market
- 14.1 South Africa
- 14.2 Egypt
- 14.3 Nigeria
- 14.4 Morocco
- 14.5 Rest of Africa
Chapter 15. Electronic Drug Delivery Devices Company Profiles
- 15.1 [Company 01]
- 15.1.1 Company Overview
- 15.1.2 Key Management Personnel
- 15.1.3 Products & Services Portfolio
- 15.1.4 Financial Performance
- 15.1.5 Key Market Focus & Geographic Presence
- 15.1.6 Recent Developments & Strategic Initiatives
Note: The company profile list is preliminary and may change based on research findings, market developments, data availability, and client requirements.
Chapter 16. Appendices
- Appendix A – List of Abbreviations & Acronyms
- Appendix B – Industry Classification Code Reference – Full Series
- Appendix C – Supply, Output & Operating Capacity Data Tables
- Appendix D – End-Use & Demand Base Tables
- Appendix E – Demand, Adoption & Usage Assumptions
- Appendix F – Pricing & Revenue Metric Reference Tables
- Appendix G – Company Operations & Infrastructure Database
- Appendix H – Cross-Border Trade & Activity Data Tables (Where Applicable)
- Appendix I – Regulatory Summary Tables
- Appendix J – Primary Research Participant List (Anonymized)
- Appendix K – Primary Research Questionnaire Framework
- Appendix L – Data Sources & Bibliography
- Appendix M – Market Size Divergence & Source Comparison
Chapter 17. Research Methodology
- 17.1 Research Framework & Philosophy
- 17.2 Secondary Research – Sources, Hierarchy & Data Extraction
- 17.3 Data Modeling – Bottom-Up & Top-Down Market Sizing
- 17.4 Primary Research – Stakeholder Framework, LOI & Sample Sizes
- 17.5 Forecast Methodology – Regression, Scenario & Sensitivity Analysis
- 17.6 Quality Control – Four-Layer Validation Framework
- 17.7 Limitations & Standard Assumptions
- 17.8 Disclaimer
