
| REPORT ATTRIBUTE | DETAILS |
|---|---|
| Historical Period | 2019-2022 |
| Base Year | 2023 |
| Forecast Period | 2024-2032 |
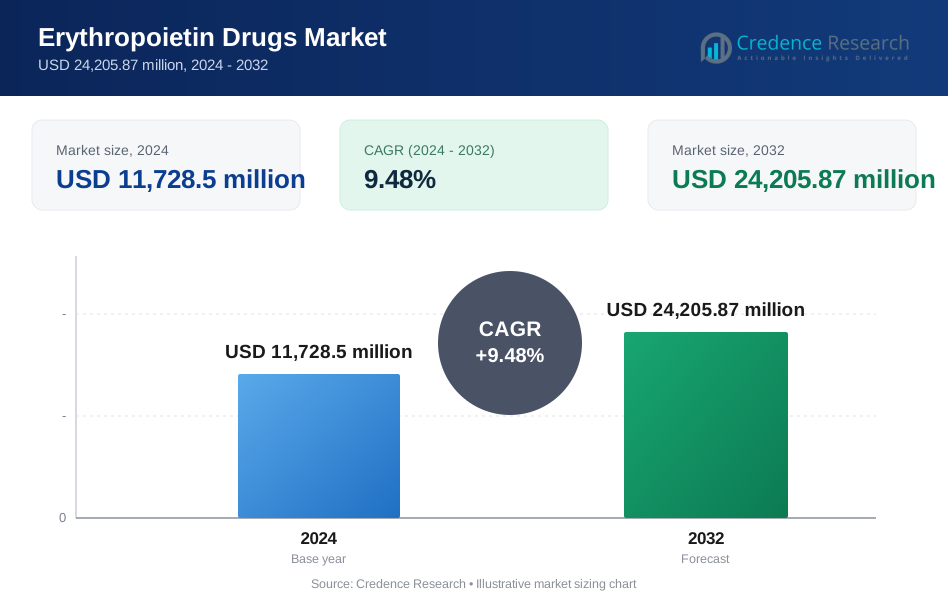
| Erythropoietin (EPO) Drug Market Size 2024 | USD 11,728.5 million |
| Erythropoietin (EPO) Drug Market, CAGR | 9.48% |
| Erythropoietin (EPO) Drug Market Size 2032 | USD 24,205.87 million |
Market Overview:
The Erythropoietin (EPO) drug market is poised for substantial growth, with its market size projected to expand from USD 11,728.5 million in 2024 to USD 24,205.87 million by 2032, reflecting a compound annual growth rate (CAGR) of 9.48%.
This significant increase underscores the growing demand for EPO drugs, driven by advancements in drug formulations and the rising prevalence of chronic diseases such as cancer and chronic kidney disease (CKD). The market’s expansion is indicative of the increasing adoption of EPO drugs to manage anemia associated with these conditions, thereby improving patient outcomes and quality of life.
Several key drivers are propelling the growth of the EPO drug market. The rising prevalence of chronic kidney disease (CKD) and cancer is a major factor driving the demand for EPO drugs. According to the Centres for Disease Control and Prevention (CDC), over 37 million individuals in the U.S. experienced CKD in 2021. EPO drugs stimulate red blood cell production, enhancing oxygen delivery and managing anemia associated with CKD and cancer treatments. Additionally, advancements in drug formulations, such as extended-release versions of EPO drugs, allow for less frequent dosing, improving patient compliance and convenience. The introduction of biosimilars has also provided cost-effective alternatives to original EPO drugs, further driving market growth.
Regionally, North America holds the largest share of the EPO drug market, driven by the high adoption rate of advanced drug formulations and the presence of major market players. The region accounted for a significant portion of the market share in 2023. Europe follows closely, with substantial growth attributed to increasing health awareness and supportive government policies. The Asia-Pacific region is expected to witness the highest growth rate during the forecast period, driven by the rising prevalence of CKD and cancer, increasing healthcare expenditure, and growing awareness of advanced drug formulations. Countries such as China and India are leading the growth in this region, supported by the expanding middle-class population and the increasing penetration of advanced medical treatments Latin America and the Middle East & Africa are also projected to experience substantial growth, supported by government initiatives to improve healthcare access and the strong presence of international pharmaceutical companies.
Market Drivers:
Rising Prevalence of Chronic Kidney Disease (CKD):
The increasing prevalence of chronic kidney disease (CKD) is a significant driver of the erythropoietin (EPO) drug market. CKD leads to diminished red blood cell production, causing anemia, which necessitates the use of EPO drugs to stimulate red blood cell production and enhance oxygen delivery. According to the Centres for Disease Control and Prevention (CDC), over 37 million individuals in the U.S. experienced CKD in 2021. This rising incidence underscores the growing demand for EPO drugs to manage anemia associated with CKD and improve patient outcomes.
Advancements in Drug Formulations:
Technological advancements in drug formulations are propelling the growth of the EPO drug market. Innovations such as extended-release versions of EPO drugs allow for less frequent dosing, improving patient compliance and convenience. For instance, darbepoetin-alfa, a long-acting EPO drug, has a longer half-life compared to epoetin-alfa, reducing the frequency of injections from weekly to once every two or three weeks. These advancements enhance the efficacy and safety of EPO therapies, making them more attractive to both patients and healthcare providers.
Increasing Incidence of Cancer:
The rising incidence of cancer is another key driver of the EPO drug market. Cancer treatments, such as chemotherapy, often lead to anemia, necessitating the use of EPO drugs to manage this condition. According to the World Health Organization (WHO), there were an estimated 20 million new cancer cases and 9.7 million cancer-related deaths worldwide in 2022. The growing prevalence of cancer underscores the need for effective anemia management solutions, driving the demand for EPO drugs in oncology.
Introduction of Biosimilars:
The introduction of biosimilars has provided cost-effective alternatives to original EPO drugs, further driving market growth. Biosimilars offer similar efficacy and safety profiles as their reference biologics but at a lower cost, making them more accessible to a broader patient population. For instance, the approval of biosimilar EPO drugs in various regions has led to increased competition and reduced prices, benefiting healthcare systems and patients alike. This trend is expected to continue, contributing to the robust growth of the EPO drug market.
Market Trends:
Development of Potent Formulations:
Recent trends in the erythropoietin (EPO) drug market indicate a rise in the development of more potent formulations to minimize dosage frequency. Manufacturers are focusing on creating extended-release versions of EPO drugs, which allow for less frequent dosing and improve patient compliance. For instance, darbepoetin-alfa, a long-acting EPO drug, has a longer half-life compared to epoetin-alfa, reducing the frequency of injections from weekly to once every two or three weeks. This trend is driven by the need to enhance the efficacy and convenience of EPO therapies.
Integration of Bio-Based Alternatives:
The integration of bio-based alternatives in EPO drug formulations is another emerging trend. Companies are exploring the use of bio-based materials to create more sustainable and cost-effective EPO drugs. For example, researchers are investigating the potential of plant-based erythropoietin, which could offer a more environmentally friendly and scalable production method. This trend aligns with the broader industry shift towards sustainability and the reduction of reliance on traditional manufacturing processes.
Novel Delivery Systems:
Innovations in drug delivery systems are also shaping the EPO drug market. Manufacturers are developing novel delivery methods to enhance patient convenience and improve therapeutic outcomes. For instance, the use of needle-free injectors and transdermal patches for EPO drug delivery is gaining traction. These delivery systems offer a less invasive and more comfortable alternative to traditional injections, making EPO therapies more accessible to a broader patient population.
Expansion of Biosimilars:
The expansion of biosimilars is a significant trend in the EPO drug market. Biosimilars offer similar efficacy and safety profiles as their reference biologics but at a lower cost, making them more accessible to patients. For example, the approval of biosimilar EPO drugs in various regions has led to increased competition and reduced prices. This trend is expected to continue, driving market growth and providing cost-effective alternatives to original EPO drugs.
Market Challenges Analysis:
High Cost of Erythropoietin Drugs:
One of the primary restraints in the erythropoietin (EPO) drug market is the high cost associated with these medications. The development, production, and distribution of EPO drugs involve significant expenses, which can make them unaffordable for some patients and healthcare providers. For instance, the cost of EPO drugs can range from hundreds to thousands of dollars per treatment cycle, posing a financial burden on patients, especially in developing and underdeveloped regions. This high cost limits the accessibility and widespread adoption of EPO therapies.
Potential Side Effects:
The potential side effects associated with EPO drugs presents another significant challenge. Common side effects include high blood pressure, iron deficiency, and influenza-like symptoms. In some cases, patients may experience more severe adverse reactions, such as arterial hypertension and thromboembolic events. These side effects necessitate careful monitoring and management, which can complicate treatment protocols and deter some patients from using EPO drugs.
Reimbursement and Insurance Issues:
Reimbursement and insurance coverage limitations also act as market growth restraints. In many regions, government reimbursement policies and insurance coverage for EPO drugs are inadequate, leading to out-of-pocket expenses for patients. This lack of financial support can hinder the adoption of EPO therapies, particularly among low-income populations. Addressing these reimbursement issues is crucial to improving the accessibility and affordability of EPO drugs.
Supply Chain Disruptions:
Supply chain disruptions, exacerbated by events such as the COVID-19 pandemic, have significantly impacted the production and distribution of EPO drugs. These disruptions can lead to shortages and delays in the availability of EPO medications, affecting patient care and treatment outcomes. Ensuring a stable and efficient supply chain is essential to maintaining the consistent availability of EPO drugs in the market.
Market Segmentation Analysis:
By Type
The Erythropoietin (EPO) drug market is segmented by type into Biologics and Biosimilars. Biologics, including well-known brands such as Procrit (Johnson & Johnson) and Epogen (Amgen), have historically dominated the market due to their high efficacy and established usage. However, the biosimilars segment is witnessing rapid growth, driven by the expiration of patents for major biologics and the introduction of cost-effective alternatives. Biosimilars offer similar therapeutic benefits at a lower cost, making them increasingly popular among healthcare providers and patients.
By Technology
Technological advancements play a crucial role in the EPO drug market. The market is segmented by technology into First Generation Formulation and Second-Generation Formulation. First Generation Formulations, such as epoetin-alfa and epoetin-beta, have been widely used for years. Second Generation Formulations, including darbepoetin-alfa, offer extended half-lives and reduced dosing frequencies, improving patient compliance and convenience. These advancements in drug formulations enhance the efficacy and safety of EPO therapies, making them more attractive to both patients and healthcare providers.
By End User
The end-user segment of the EPO drug market includes Hospitals, Clinics, Ambulatory Surgical Centers (ASCs), and Home Healthcare. Hospitals hold the largest share of the market due to their extensive reach and capability to handle large-scale treatment protocols. Clinics and ASCs also play a significant role, offering specialized services in a more cost-effective and patient-friendly environment. Home Healthcare is gaining traction, driven by the increasing preference for at-home treatments and the convenience it offers to patients, particularly those with chronic conditions.
Segmentation:
By Drug Type
- Biologics
- Biosimilars
By Product Type
- Epoetin-alfa
- Epoetin-beta
- Darbepoetin-alfa
- Others
By Application
- Haematology
- Kidney Disorder
- Cancer
- Others
By End User
- Hospitals
- Homecare
- Specialty Clinics
- Others
- North America
- U.S.
- Canada
- Mexico
- Europe
- Germany
- France
- U.K.
- Italy
- Spain
- Rest of Europe
- Asia Pacific
- China
- Japan
- India
- South Korea
- South-east Asia
- Rest of Asia Pacific
- Latin America
- Brazil
- Argentina
- Rest of Latin America
- Middle East & Africa
- GCC Countries
- South Africa
- Rest of the Middle East and Africa
Regional Analysis:
North America
North America holds a dominant position in the erythropoietin drug market, accounting for approximately 40.35% of the global market share in 2022. The region’s leadership is attributed to the high prevalence of chronic kidney disease (CKD) and cancer, which drive the demand for erythropoietin drugs. The presence of major pharmaceutical companies and advanced healthcare infrastructure further bolster market growth. Additionally, the introduction of biosimilar erythropoietin drugs and the impending patent expirations of key drugs like Aranesp are expected to influence market dynamics positively.
Europe
Europe is another significant market for erythropoietin drugs, with a substantial market share. The region benefits from a large patient pool, well-developed healthcare infrastructure, and favorable reimbursement policies. The less stringent regulatory environment compared to North America facilitates faster drug approvals, contributing to market growth. The introduction of biosimilars in Europe has intensified competition, leading to more affordable treatment options for patients. Countries such as Germany, France, and the United Kingdom are key contributors to the market’s growth in this region.
Asia-Pacific
The Asia-Pacific region is poised for remarkable growth in the erythropoietin drug market, driven by the high prevalence of anemia and CKD, particularly in countries like India and China. The region’s market share is expected to increase significantly due to the expanding healthcare infrastructure and rising awareness about anemia treatment. The less stringent regulatory environment and the commercialization of biosimilar erythropoietin drugs further support market expansion. Major pharmaceutical companies are increasingly focusing on this region to tap into the growing demand for erythropoietin drugs.
Latin America
Latin America presents a growing market for erythropoietin drugs, with countries like Brazil and Mexico leading the way. The region’s market growth is driven by the increasing prevalence of chronic diseases and improving healthcare access. However, the market share remains relatively smaller compared to North America and Europe due to economic constraints and limited healthcare infrastructure in some areas.
Middle East & Africa
The Middle East & Africa region holds a modest share of the global erythropoietin drug market. The market growth is primarily driven by the rising prevalence of anemia and CKD, along with improving healthcare infrastructure in countries like the UAE and South Africa. However, challenges such as limited access to advanced healthcare facilities and economic constraints hinder market expansion in this region.
Key Player Analysis:
- Amgen Inc.
- Johnson & Johnson
- F. Hoffmann-La Roche Ltd.
- Pfizer Inc.
- Novartis AG
- Biocon Limited
- Teva Pharmaceutical Industries Ltd.
- Dr. Reddy’s Laboratories Ltd.
- LG Life Sciences Ltd.
- Wockhardt Ltd.
Competitive Analysis:
The erythropoietin drug market is characterized by intense competition, driven by the presence of both established pharmaceutical giants and emerging biosimilar manufacturers. Key players such as Amgen Inc., Johnson & Johnson, and F. Hoffmann-La Roche Ltd. dominate the market with their flagship products like Epogen, Procrit, and Mircera. The introduction of biosimilars has intensified competition, leading to price reductions and increased accessibility. Companies like Biocon Limited and Dr. Reddy’s Laboratories Ltd. are gaining traction with their cost-effective biosimilar offerings. The market dynamics are further influenced by strategic collaborations, mergers, and acquisitions aimed at expanding product portfolios and geographic reach. The impending patent expirations of major erythropoietin drugs are expected to open new avenues for biosimilar manufacturers, thereby reshaping the competitive landscape. Overall, the market remains highly competitive, with innovation and cost-efficiency being key differentiators.
Recent Developments:
- In March 2022, Zydus received approval from the DCGI for OxemiaTM (Desidustat), marking India’s first oral treatment for anemia in chronic kidney disease (CKD) patients.
- By November 2022, Dong-A ST and Polifarma had formed a strategic partnership, granting Polifarma the rights to commercialize and develop the DA-3880 NESP biosimilar in Brazil, Mexico, and Turkey.
- Fast forward to October 2023, Genexine, a leading South Korean biopharmaceutical firm, and KGbio, a clinical-stage biotech company, secured the first market approval for their novel long-acting Erythropoietin, Efepoetin alfa, from Indonesia’s BPOM.
- Additionally, in October 2023, Sun Pharmaceutical Industries Ltd. and Zydus Lifesciences Ltd. collaborated to co-market Desidustat in India, aiming to transition from traditional injectable treatments to this innovative oral solution for CKD-related anemia.
Market Concentration & Characteristics:
The erythropoietin drug market is characterized by a high level of concentration, with a few key players dominating the market. Companies such as Amgen Inc., Johnson & Johnson, and F. Hoffmann-La Roche Ltd. hold significant market shares due to their established erythropoietin products like Epogen, Procrit, and Mircera. The market is also marked by the increasing presence of biosimilars, which offer cost-effective alternatives and intensify competition. The introduction of biosimilars has led to price reductions and increased accessibility, further shaping the market dynamics. Additionally, the market is driven by the rising prevalence of chronic diseases such as cancer and chronic kidney disease (CKD), which necessitate erythropoietin therapy. Advancements in drug formulations, including extended-release versions, have enhanced patient convenience and compliance, contributing to market growth. Overall, the erythropoietin drug market is competitive, with innovation and cost-efficiency being key differentiators.
Report Coverage:
The research report offers an in-depth analysis based on Drug Type, Product Type, Application, and End User. It details leading market players, providing an overview of their business, product offerings, investments, revenue streams, and key applications. Additionally, the report includes insights into the competitive environment, SWOT analysis, current market trends, as well as the primary drivers and constraints. Furthermore, it discusses various factors that have driven market expansion in recent years. The report also explores market dynamics, regulatory scenarios, and technological advancements that are shaping the industry. It assesses the impact of external factors and global economic changes on market growth. Lastly, it provides strategic recommendations for new entrants and established companies to navigate the complexities of the market.
Future Outlook:
- The erythropoietin drug market is projected to grow.
- The introduction and commercialization of biosimilar erythropoietin drugs will continue to drive market growth, offering cost-effective alternatives and increasing competition.
- Innovations in drug delivery systems, including extended-release formulations, will enhance patient compliance and treatment efficacy.
- Evolving regulatory frameworks will facilitate faster approvals of new erythropoietin drugs and biosimilars, positively impacting market dynamics.
- The increasing incidence of chronic kidney disease (CKD), cancer, and other conditions requiring erythropoietin therapy will boost market demand.
- Emerging markets in Asia-Pacific, Latin America, and the Middle East & Africa will present significant growth opportunities due to improving healthcare infrastructure and rising awareness.
- Partnerships and collaborations among pharmaceutical companies will lead to the development of new products and expansion of market reach.
- The impending patent expirations of major erythropoietin drugs will open new avenues for biosimilar manufacturers, intensifying market competition.
- Supportive governmental policies and reimbursement schemes will enhance market accessibility and affordability.
- Increased investment in R&D will lead to the discovery of novel erythropoietin formulations and applications, driving market innovation.
Request a Free Sample
Fill in your details and we'll send you a free sample report.
- Sample data tables & charts
- Research methodology
Market Dynamics
Rising Prevalence of Chronic Kidney Disease (CKD)
The increasing number of CKD cases globally, particularly in developed regions, is driving demand for erythropoietin drugs to manage anemia associated with kidney dysfunction, thereby boosting market growth.
Advancements in Drug Formulations
Innovations such as extended-release and long-acting erythropoietin drugs reduce dosing frequency, improve patient compliance, and enhance treatment outcomes, making these therapies more attractive to both patients and providers.
Increasing Incidence of Cancer
With cancer rates rising worldwide, especially in aging populations, the need for erythropoietin drugs to manage chemotherapy-induced anemia is expanding, supporting overall market growth.
Introduction and Expansion of Biosimilars
The entry of biosimilar erythropoietin drugs offers cost-effective alternatives to branded biologics, increasing accessibility for patients and driving adoption in both developed and emerging markets.
Growing Healthcare Infrastructure and Awareness in Emerging Markets
Improved healthcare infrastructure, rising awareness of anemia management, and increasing healthcare expenditure in regions like Asia-Pacific and Latin America are fueling demand for erythropoietin drugs.
Need a Custom Version of This Report?
Tailor the scope, geography, or segments to your exact requirements.
- Custom geography or segment scope
- Direct access to our analyst team
Frequently Asked Questions
What is the current size of the Erythropoietin Drug Market?
What factors are driving the growth of the Erythropoietin Drug Market?
What are some challenges faced by the Erythropoietin Drug Market?
Who are the major players in the Erythropoietin Drug Market?
Table of Content
Chapter 1 Market Segmentation
- 1.1 Segmentation Framework
- 1.1.1 Product and Service Classification
- 1.1.2 Application and End-Use Classification
- 1.1.3 Technology and Solution Classification
- 1.1.4 Customer and Distribution Channel Classification
- 1.1.5 Geographic Segmentation
- 1.1.6 Market Segment Definitions and Boundaries
- 1.2 By End User
- 1.2.1 Hospitals
- 1.2.2 Homecare
- 1.2.3 Specialty Clinics
- 1.2.4 Others
- 1.3 By Drug Type
- 1.3.1 Biologics
- 1.3.2 Biosimilars
- 1.4 By Application
- 1.4.1 Haematology
- 1.4.2 Kidney Disorder
- 1.4.3 Cancer
- 1.4.4 Others
- 1.5 By Product Type
- 1.5.1 Epoetin-alfa
- 1.5.2 Epoetin-beta
- 1.5.3 Darbepoetin-alfa
- 1.5.4 Others
Chapter 2 Introduction
- 2.1 Report Objectives and Scope
- 2.2 Product Definition and Industry Terminology
- 2.3 Market Inclusions and Exclusions
- 2.4 Research Process
- 2.4.1 Primary Research and Expert Interviews
- 2.4.2 Secondary Research and Source Review
- 2.4.3 Top-Down and Bottom-Up Estimation
- 2.4.4 Data Triangulation and Verification
- 2.5 Market Size Measurement Basis
- 2.5.1 2024: USD 11,728.5 million → 2032: USD 24,205.87 million
- 2.6 Historical and Forecast Reference Periods
- 2.6.1 Base Year: 2024
- 2.6.2 Forecast Period: 2024-2032
- 2.7 Research Assumptions and Limitations
Chapter 3 Executive Summary
- 3.1 Market Snapshot and Key Findings
- 3.2 Base-Year Market Size, 2024
- 3.3 Forecast Market Size, 2032
- 3.4 Revenue and Volume Growth Outlook
- 3.5 Key Demand and Supply Indicators
- 3.6 Leading Market Segments
- 3.7 Fastest-Growing Market Opportunities
- 3.8 Regional Performance Highlights
- 3.9 Technology and Industry Transformation
- 3.10 Competitive Landscape Summary
- 3.11 Analyst View and Strategic Implications
Chapter 4 Global Erythropoietin Drugs Market Trends and Developments
- 4.1 Historical Industry Development
- 4.2 Recent Market Trends and Developments
- 4.3 Demand and Customer Behavior Trends
- 4.4 Technology and Product Innovation
- 4.5 Artificial Intelligence, Automation and Digitalization
- 4.6 Local Manufacturing and Supply Chain Realignment
- 4.7 Industry Partnerships, Mergers and Acquisitions
- 4.8 Sustainability and Circular Economy Developments
- 4.9 Government and Private Sector Investment Trends
- 4.10 Emerging Business Models and Commercialization
- 4.11 Industry Developments and Announcements
Chapter 5 Global Erythropoietin Drugs Market Production, Supply and Demand Analysis
- 5.1 Demand Trend and Consumption Analysis
- 5.2 Demand Forecast, 2024-2032
- 5.3 Production and Output Trend
- 5.4 Production and Output Forecast, 2024-2032
- 5.5 Installed Capacity and Capacity Utilization
- 5.6 Company-Wise Production Plants and Statistics
- 5.6.1 Installed Production Capacity
- 5.6.2 Actual Production
- 5.6.3 Planned Capacity and Expansion Targets
- 5.7 Supply Chain Structure and Procurement Trends
- 5.8 Supply-Demand Gap and Bottlenecks
- 5.9 Import Dependence and Sourcing Structure
- 5.10 Contract Manufacturing and Outsourcing
- 5.11 Regional Supply and Demand Concentration
Chapter 6 Global Erythropoietin Drugs Market Pricing Analysis
- 6.1 Pricing Structure and Measurement
- 6.2 Historical Pricing Trends
- 6.3 Pricing Outlook, 2024-2032
- 6.4 Average Selling Price and Unit Economics
- 6.5 Pricing by Product and Market Segment
- 6.6 Geographic Pricing Differences
- 6.7 Key Input, Energy, Labor and Logistics Costs
- 6.8 Contract Pricing and Purchasing Models
- 6.9 Pricing Sensitivity and Competitive Positioning
- 6.10 Price, Margin and Profitability Implications
Chapter 7 Global Erythropoietin Drugs Market Dynamics
- 7.1 Market Growth Drivers
- 7.1.1 Demand-Side Drivers
- 7.1.2 Technology and Innovation Drivers
- 7.1.3 Infrastructure and Investment Drivers
- 7.1.4 Regulatory and Policy Drivers
- 7.2 Market Restraints
- 7.2.1 Cost and Affordability Constraints
- 7.2.2 Technology and Adoption Barriers
- 7.2.3 Supply Chain and Operational Constraints
- 7.3 Market Challenges
- 7.3.1 Competitive Pressure and Margin Erosion
- 7.3.2 Skills, Infrastructure and Implementation Gaps
- 7.4 Emerging Market Opportunities
- 7.5 Market Dynamics Impact and Time-Horizon Assessment
Chapter 8 Global Erythropoietin Drugs Value Chain Analysis
- 8.1 Industry Value Chain Overview
- 8.2 Upstream Suppliers and Critical Inputs
- 8.3 Technology and Component Providers
- 8.4 Manufacturing or Service Delivery
- 8.5 Distribution, Channel Partners and Integrators
- 8.6 Downstream Applications and End Users
- 8.7 Value Addition and Profit Pools
- 8.8 Vertical Integration and Outsourcing
- 8.9 Supplier Concentration and Risk
- 8.10 Supply Chain Localization and Resilience
Chapter 9 Global Erythropoietin Drugs Market Regulations and Policies
- 9.1 Relevant Laws, Standards and Compliance Frameworks
- 9.2 Product, Service, Safety and Quality Requirements
- 9.3 Government Policies, Incentives and Subsidies
- 9.4 Imports, Exports and Trade Barriers
- 9.5 Public Procurement and Local Content Requirements
- 9.6 Environmental and Sustainability Compliance
- 9.7 Upcoming Policy Changes and Market Implications
Chapter 10 Global Erythropoietin Drugs Market Hotspots and Opportunities
- 10.1 Market Opportunity Mapping and Growth Hotspots
- 10.2 High-Growth Applications and Customer Groups
- 10.3 Underserved Markets and White-Space Opportunities
- 10.4 Emerging Technology and Product Opportunities
- 10.5 New Capacity and Investment Hotspots
- 10.6 Market Entry and Expansion Opportunities
- 10.7 Distribution and Partnership Opportunities
- 10.8 Near-Term and Long-Term Commercial Potential
- 10.9 Opportunity Attractiveness and Execution Risks
Chapter 11 Global Erythropoietin Drugs Market Outlook, 2024-2032
- 11.1 Market Size and Analysis
- 11.1.1 Revenue (Market Measurement: 2024: USD 11,728.5 million → 2032: USD 24,205.87 million)
- 11.1.2 Market Volume and Quantity Sold
- 11.1.3 Historical Market Size
- 11.1.4 Base-Year Market Size, 2024
- 11.2 Market Forecast, 2024-2032
- 11.2.1 Revenue Forecast to 2032
- 11.2.2 Volume Forecast to 2032
- 11.2.3 CAGR and Year-on-Year Growth
- 11.2.4 Incremental Revenue Opportunity
- 11.3 Forecast Assumptions and Scenario Analysis
- 11.3.1 Base-Case Forecast
- 11.3.2 Optimistic and Conservative Scenarios
- 11.3.3 Technology, Pricing and Policy Sensitivities
- 11.4 Market Attractiveness and Growth Outlook
Chapter 12 Global Erythropoietin Drugs Market Segmentation and Outlook
- 12.1 Segmentation Summary and Market Shares, 2024
- 12.2 Largest and Fastest-Growing Segments
- 12.3 By End User - Market Size and Forecast, 2024-2032
- 12.3.1 Segment Definition and Scope
- 12.3.2 Historical Market Size
- 12.3.3 Revenue Forecast, 2024-2032
- 12.3.4 Volume Forecast, 2024-2032
- 12.3.5 Base-Year Market Share, 2024
- 12.3.6 Segment CAGR and Growth Drivers
- 12.3.7 Subsegment Market Size and Forecast
- 12.3.7.1 Hospitals
- 12.3.7.2 Homecare
- 12.3.7.3 Specialty Clinics
- 12.3.7.4 Others
- 12.3.8 Subsegment Pricing and Adoption Trends
- 12.3.9 Leading Suppliers and Competition
- 12.3.10 Regional Demand and Opportunities
- 12.4 By Drug Type - Market Size and Forecast, 2024-2032
- 12.4.1 Segment Definition and Scope
- 12.4.2 Historical Market Size
- 12.4.3 Revenue Forecast, 2024-2032
- 12.4.4 Volume Forecast, 2024-2032
- 12.4.5 Base-Year Market Share, 2024
- 12.4.6 Segment CAGR and Growth Drivers
- 12.4.7 Subsegment Market Size and Forecast
- 12.4.7.1 Biologics
- 12.4.7.2 Biosimilars
- 12.4.8 Subsegment Pricing and Adoption Trends
- 12.4.9 Leading Suppliers and Competition
- 12.4.10 Regional Demand and Opportunities
- 12.5 By Application - Market Size and Forecast, 2024-2032
- 12.5.1 Segment Definition and Scope
- 12.5.2 Historical Market Size
- 12.5.3 Revenue Forecast, 2024-2032
- 12.5.4 Volume Forecast, 2024-2032
- 12.5.5 Base-Year Market Share, 2024
- 12.5.6 Segment CAGR and Growth Drivers
- 12.5.7 Subsegment Market Size and Forecast
- 12.5.7.1 Haematology
- 12.5.7.2 Kidney Disorder
- 12.5.7.3 Cancer
- 12.5.7.4 Others
- 12.5.8 Subsegment Pricing and Adoption Trends
- 12.5.9 Leading Suppliers and Competition
- 12.5.10 Regional Demand and Opportunities
- 12.6 By Product Type - Market Size and Forecast, 2024-2032
- 12.6.1 Segment Definition and Scope
- 12.6.2 Historical Market Size
- 12.6.3 Revenue Forecast, 2024-2032
- 12.6.4 Volume Forecast, 2024-2032
- 12.6.5 Base-Year Market Share, 2024
- 12.6.6 Segment CAGR and Growth Drivers
- 12.6.7 Subsegment Market Size and Forecast
- 12.6.7.1 Epoetin-alfa
- 12.6.7.2 Epoetin-beta
- 12.6.7.3 Darbepoetin-alfa
- 12.6.7.4 Others
- 12.6.8 Subsegment Pricing and Adoption Trends
- 12.6.9 Leading Suppliers and Competition
- 12.6.10 Regional Demand and Opportunities
- 12.7 Segment Growth Comparison
- 12.8 Segment Attractiveness and Priority Matrix
Chapter 13 Global Erythropoietin Drugs End-Use and Application Market Outlook
- 13.1 End-Use Industry and Customer Demand Structure
- 13.2 Leading Applications and Customer Groups
- 13.3 End-Use Market Size, Share and Forecast
- 13.4 Major End-Use Industry Deep Dives
- 13.4.1 Customer Requirements and Use Cases
- 13.4.2 Demand and Replacement Cycles
- 13.4.3 Technical and Regulatory Considerations
- 13.4.4 Purchasing and Procurement Models
- 13.4.5 Leading Vendors and Distribution Channels
- 13.4.6 Forecast and Commercial Opportunities
- 13.5 Emerging Applications and Cross-Segment Demand
- 13.6 End-Use Industry Investment Priorities
Chapter 14 Global Erythropoietin Drugs Geographic Market Outlook, 2024-2032
- 14.1 Regional Market Size and Share, 2024
- 14.2 Regional Market Forecast, 2024-2032
- 14.3 Regional Pricing, Production and Demand Differences
- 14.4 North America
- 14.4.1 United States
- 14.4.2 Canada
- 14.4.3 Mexico
- 14.5 Europe
- 14.5.1 Germany
- 14.5.2 France
- 14.5.3 Italy
- 14.5.4 United Kingdom
- 14.5.5 Spain
- 14.5.6 Poland
- 14.5.7 Russia
- 14.5.8 Netherlands
- 14.5.9 Belgium
- 14.5.10 Sweden
- 14.5.11 Denmark
- 14.5.12 Norway
- 14.5.13 Rest of Europe
- 14.6 Asia Pacific
- 14.6.1 China
- 14.6.2 India
- 14.6.3 Japan
- 14.6.4 South Korea
- 14.6.5 Thailand
- 14.6.6 Indonesia
- 14.6.7 Vietnam
- 14.6.8 Malaysia
- 14.6.9 Australia
- 14.6.10 Rest of Asia Pacific
- 14.7 Latin America
- 14.7.1 Brazil
- 14.7.2 Argentina
- 14.7.3 Colombia
- 14.7.4 Chile
- 14.7.5 Rest of Latin America
- 14.8 Middle East
- 14.8.1 Saudi Arabia
- 14.8.2 United Arab Emirates
- 14.8.3 Turkey
- 14.8.4 Israel
- 14.8.5 Iran
- 14.8.6 Rest of the Middle East
- 14.9 Africa
- 14.9.1 South Africa
- 14.9.2 Egypt
- 14.9.3 Nigeria
- 14.9.4 Morocco
- 14.9.5 Rest of Africa
- 14.10 Regional Investment, Policy and Supply Chain Differences
- 14.11 Regional Competitive Landscape
- 14.12 Geographic Growth Hotspots
Chapter 15 Global Erythropoietin Drugs Technology, Innovation and Sustainability Outlook
- 15.1 Technology Landscape and Maturity
- 15.2 Product, Process and Service Innovation
- 15.3 AI, Automation and Digital Tools in the Industry
- 15.4 Technology Adoption and Performance Benchmarking
- 15.5 Innovation Pipeline and R&D Investment
- 15.6 Patent and Intellectual Property Trends
- 15.7 Energy Efficiency and Resource Management
- 15.8 Sustainability, Recycling and Circularity
- 15.9 Technology Roadmap, 2024-2032
- 15.10 Risks of Obsolescence and Technology Substitution
Chapter 16 Global Erythropoietin Drugs Market Key Strategic Imperatives
- 16.1 Growth and Market Entry Priorities
- 16.2 High-Return Products and Segments
- 16.3 Pricing, Profitability and Cost Optimization
- 16.4 Technology Investment and Product Differentiation
- 16.5 Supply Chain Localization and Resilience
- 16.6 Distribution and Customer Acquisition
- 16.7 Partnership, Acquisition and Capacity Strategy
- 16.8 Regional Expansion Priorities
- 16.9 Short-, Medium- and Long-Term Actions
Chapter 17 Competition Outlook
- 17.1 Industry Competition Characteristics
- 17.2 Market Structure and Concentration
- 17.3 Market Share and Competitive Positioning, 2024
- 17.4 Company-Wise Revenue and Product Benchmarking
- 17.5 Production and Service Capacity Benchmarking
- 17.6 Technology, Pricing and Differentiation
- 17.7 Regional Footprint and Distribution Strength
- 17.8 Mergers, Acquisitions and Strategic Alliances
- 17.9 New Entrants and Competitive Threats
- 17.10 Porter's Five Forces and Industry Attractiveness
- 17.11 Competitive Outlook, 2024-2032
Chapter 18 Company Profiles
- 18.1 Company Coverage and Selection Criteria
- 18.2 Amgen Inc.
- 18.2.1 Business Description
- 18.2.2 Company Ownership and Geographic Presence
- 18.2.3 Product and Service Portfolio
- 18.2.4 Manufacturing and Operating Footprint
- 18.2.5 Production Capacity and Expansion Plans
- 18.2.6 Financial Performance and Investment
- 18.2.7 Market Share and Competitive Position
- 18.2.8 Technology and Innovation Capabilities
- 18.2.9 Strategic Alliances or Partnerships
- 18.2.10 Recent Developments
- 18.2.11 Growth Strategy and Outlook
- 18.3 Johnson & Johnson
- 18.4 F. Hoffmann-La Roche Ltd.
- 18.5 Pfizer Inc.
- 18.6 Novartis AG
- 18.7 Biocon Limited
- 18.8 Teva Pharmaceutical Industries Ltd.
- 18.9 Dr. Reddy’s Laboratories Ltd.
- 18.10 LG Life Sciences Ltd.
- 18.11 Wockhardt Ltd.
- 18.12 Other Relevant Market Participants
Note: Every listed company is profiled on the structure shown under the first company. The company list is preliminary and may change based on research findings, market developments, data availability and client requirements.
Chapter 19 Disclaimer
- 19.1 Research and Forecast Disclaimer
- 19.2 Data Source and Estimation Limitations
Note: The depth of individual sections depends on data availability for this market. Volume, capacity, trade and other unit-based metrics are included where applicable.

