Market Overview
Europe Industrial Solvents market size was valued at USD 9,126.11 million in 2024 and is anticipated to reach USD 15,095.24 million by 2032, at a CAGR of 6.49% during the forecast period (2024-2032).
| REPORT ATTRIBUTE |
DETAILS |
| Historical Period |
2020-2023 |
| Base Year |
2024 |
| Forecast Period |
2025-2032 |
| Europe Industrial Solvents Market Size 2024 |
USD 6,913.96 million |
| Europe Industrial Solvents Market, CGR |
3.19% |
| Europe Industrial Solvents Market Size 2032 |
USD 9,109.21 million |
The European industrial solvents market is driven by the increasing demand for solvents in industries such as paints and coatings, pharmaceuticals, adhesives, and chemicals. The growth in automotive, construction, and manufacturing sectors is fueling the demand for solvents, particularly in the production of coatings and adhesives. Additionally, the rising emphasis on sustainable and eco-friendly solvents, in response to stringent environmental regulations, is pushing the market towards the adoption of bio-based and low-VOC (volatile organic compound) alternatives. Technological advancements in solvent recovery and recycling processes are also contributing to the market’s growth by enhancing operational efficiencies and reducing environmental impact. Furthermore, the expansion of end-user industries in emerging markets, coupled with the continuous development of new formulations for specialized applications, is boosting market expansion. These drivers, combined with ongoing regulatory shifts, are shaping the growth trajectory of the industrial solvents market in Europe.
The geographical analysis of the Europe industrial solvents market highlights a strong concentration of demand in key economies such as Germany, the United Kingdom, France, Italy, and Spain, driven by their robust industrial bases and advanced manufacturing sectors. Northern and Western Europe, in particular, are witnessing increased adoption of sustainable and bio-based solvents, supported by stringent environmental regulations and a strong focus on innovation. Meanwhile, Eastern European countries are gradually expanding their industrial solvent consumption due to growing investments in construction, automotive, and pharmaceutical sectors. Key players shaping the competitive landscape include BASF SE, Shell Chemicals, Solvay S.A., Arkema S.A., INEOS Group, Evonik Industries AG, Clariant AG, Synthomer plc, AkzoNobel N.V., and Perstorp Holding AB. These companies are actively focusing on product innovation, strategic partnerships, and expansion into eco-friendly solutions to meet evolving market demands and strengthen their presence across different regional markets in Europe.
Market Insights
- The Europe industrial solvents market was valued at USD 6,913.96 million in 2024 and is projected to reach USD 9,109.21 million by 2032, growing at a CAGR of 3.19% during the forecast period.
- The global industrial solvents market was valued at USD 34,660.50 million in 2024 and is expected to reach USD 60,647.79 million by 2032, growing at a CAGR of 7.24% during the forecast period (2024-2032).
- Rising demand from industries such as automotive, construction, and pharmaceuticals is a major driver boosting the use of industrial solvents across Europe.
- Increasing preference for bio-based and eco-friendly solvents is a key trend shaping the market’s evolution towards sustainable solutions.
- Leading players like BASF SE, Shell Chemicals, and Solvay S.A. are focusing on innovation, partnerships, and expansion of green solvent portfolios to strengthen their competitive edge.
- Stringent environmental regulations and fluctuating raw material prices pose significant restraints to the growth of the industrial solvents market in Europe.
- Germany, the United Kingdom, France, Italy, and Spain are major contributors to the market’s growth due to strong industrial activities and advanced manufacturing sectors.
- Investments in solvent recycling technologies and the growing demand for specialty solvents are opening new market opportunities across the region.
Report Scope
This report segments the Europe Industrial Solvents market as follows:
Market Drivers
Rising Demand from End-User Industries
The European industrial solvents market is experiencing significant growth due to increasing demand across key end-user industries. The automotive, construction, and manufacturing sectors are major contributors, with solvents being integral to the production of paints, coatings, adhesives, and lubricants. In the automotive industry, the demand for high-performance coatings and finishing products is driving the need for specialized industrial solvents. Similarly, the construction industry relies heavily on industrial solvents for adhesives, sealants, and paints, all of which are critical in the construction of durable, sustainable structures. As these industries expand and innovate, the need for industrial solvents is expected to continue growing, further propelling the market’s expansion in Europe.
Growth of the Pharmaceutical and Chemical Sectors
The pharmaceutical and chemical industries are crucial drivers of the European industrial solvents market. For instance, the Cefic Facts and Figures provides insights into the European chemical industry’s expansion, reinforcing the demand for solvents in synthesis and formulation processes. Solvents are vital in the production of active pharmaceutical ingredients (APIs), drug formulations, and chemical products. In the pharmaceutical sector, solvents are used in various stages of drug manufacturing, including extraction, purification, and crystallization processes. As the demand for pharmaceutical products, particularly in the areas of biotechnology and generic drugs, increases, the need for specialized solvents also rises. Similarly, the chemical industry’s reliance on solvents for synthesis, extraction, and formulation processes ensures continued growth in the sector. The expanding pharmaceutical and chemical industries in Europe, driven by research and development (R&D) activities, are expected to further boost the demand for industrial solvents in the coming years.
Environmental Regulations and Sustainability Initiatives
Increasing environmental awareness and stringent regulations in Europe are driving the shift toward more sustainable and eco-friendly solvents. For instance, the ECOBIOFOR Project developed bio-based solvents with lower emissions, supporting the EU’s sustainability goals. The European Union (EU) has implemented numerous directives aimed at reducing the environmental impact of industrial chemicals, particularly volatile organic compounds (VOCs) found in traditional solvents. As a result, there is growing demand for bio-based, low-VOC, and non-toxic solvents as alternatives to conventional chemicals. These eco-friendly solvents not only comply with regulations but also offer the added benefit of reduced health risks to workers and consumers. The market is witnessing a surge in the development of innovative solvent formulations, including those derived from renewable resources, as industries look to reduce their environmental footprint and meet evolving regulatory standards.
Technological Advancements in Solvent Recovery and Recycling
Technological innovations in solvent recovery and recycling are significantly contributing to the growth of the European industrial solvents market. As manufacturers seek to improve operational efficiencies and reduce waste, solvent recovery technologies are becoming increasingly important. Processes such as distillation and filtration allow for the reuse of solvents, which not only reduces operational costs but also minimizes environmental impact. In addition, advancements in solvent regeneration techniques are enabling companies to maintain the quality of solvents over multiple uses, further enhancing their sustainability. These technologies are particularly valuable in industries with high solvent usage, such as pharmaceuticals and chemicals, where maintaining solvent quality is essential for product consistency and regulatory compliance.
Market Trends
Shift Toward Bio-Based and Green Solvents
A prominent trend shaping the European industrial solvents market is the increasing shift toward bio-based and green solvents. Driven by strict environmental regulations and growing consumer awareness, industries are adopting sustainable alternatives to conventional petrochemical-based solvents. For instance, the European Commission has highlighted the need to reduce fossil dependency in the chemical sector, encouraging the adoption of bio-based solvents derived from renewable resources such as corn, sugarcane, and other biomass. Companies are investing heavily in research and development to create high-performance green solvents that can meet industrial requirements without compromising efficiency. This trend not only supports Europe’s broader sustainability goals but also provides manufacturers with opportunities to differentiate their products in an increasingly eco-conscious marketplace.
Technological Innovations in Solvent Applications
Advances in solvent technology are playing a critical role in transforming the industrial solvents market across Europe. Innovations such as low-VOC solvents, high-solubility solvents, and advanced solvent blends are enabling industries to meet both performance and regulatory demands. For instance, the European solvent market has seen a rise in water-based solvents replacing traditional formulations, particularly in paints and coatings, driven by the construction and automotive industries. New solvent formulations are being tailored to offer enhanced properties, including faster drying times, higher solubility, and improved compatibility with modern materials. These technological improvements are particularly important in sectors like automotive coatings, pharmaceuticals, and electronics, where precision and quality are paramount. As industries continue to prioritize efficiency and environmental safety, technological innovation is expected to remain a key trend influencing market development.
Rising Demand for Solvent Recycling Solutions
The demand for solvent recycling and recovery solutions is on the rise across Europe, driven by increasing environmental concerns and cost-saving initiatives. Industries are seeking sustainable practices that allow them to reuse solvents and minimize waste generation. Advanced solvent recycling systems, including distillation and membrane separation technologies, are being widely adopted to recover high-purity solvents from industrial processes. This trend not only supports environmental compliance but also helps companies significantly cut down raw material costs and waste management expenses. The circular economy model, which promotes resource efficiency and waste reduction, is strongly influencing solvent management practices, positioning solvent recycling as a key trend in the European market.
Growth in Demand for Specialty and High-Performance Solvents
There is a growing demand for specialty and high-performance solvents tailored for specific industrial applications. Sectors such as electronics, pharmaceuticals, and advanced materials require solvents with precise chemical properties, including high purity, selective solubility, and controlled evaporation rates. This need for customization is driving the development of solvents designed for niche applications, such as semiconductor manufacturing and biotechnology research. Additionally, the increasing complexity of manufacturing processes in industries like aerospace and medical devices is fueling demand for engineered solvent solutions. As a result, manufacturers are focusing on producing specialized solvent products that offer superior performance, safety, and compliance with stringent industry standards.
Market Challenges Analysis
Stringent Regulatory Framework and Compliance Challenges
One of the major challenges facing the European industrial solvents market is the increasingly stringent regulatory framework surrounding chemical usage and environmental protection. Regulations such as the Registration, Evaluation, Authorisation, and Restriction of Chemicals (REACH) and various EU directives on volatile organic compounds (VOCs) impose strict guidelines on the production, usage, and disposal of industrial solvents. For instance, the European Chemicals Agency (ECHA) has intensified enforcement measures, focusing on imports and online sales to ensure compliance with classification and labeling requirements for hazardous mixtures. Compliance with these evolving standards demands significant investment in research, reformulation, and process modifications, which can strain operational budgets, particularly for small and medium-sized enterprises (SMEs). Companies must continuously adapt to regulatory updates, leading to increased administrative burdens and the need for costly certifications and testing. The pressure to meet high environmental and safety standards while maintaining competitive pricing adds complexity to market operations and may slow down innovation and new product launches.
Volatility in Raw Material Prices and Supply Chain Disruptions
Fluctuating raw material prices present another critical challenge for the European industrial solvents market. The majority of industrial solvents are derived from petrochemical sources, making them highly sensitive to changes in crude oil prices and geopolitical tensions. Raw material cost volatility can significantly impact production expenses, erode profit margins, and create uncertainty for manufacturers. Additionally, supply chain disruptions, such as transportation delays, energy shortages, or political instability, further exacerbate market instability. The growing global demand for alternative energy sources and stricter sustainability targets can also limit the availability of certain feedstocks. Companies must develop resilient supply chain strategies and diversify sourcing to mitigate these risks, but doing so often results in additional operational costs and logistical complexities.
Market Opportunities
The Europe industrial solvents market presents significant opportunities driven by the growing emphasis on sustainable and eco-friendly products. As environmental regulations become stricter, the demand for bio-based and low-VOC solvents continues to rise, creating new avenues for manufacturers to innovate and expand their product portfolios. Companies that invest in the development of green solvents derived from renewable sources stand to gain a competitive advantage, especially as industries such as automotive, construction, and pharmaceuticals seek more sustainable alternatives. Additionally, the advancement of solvent recovery and recycling technologies offers further opportunities for growth, allowing industries to reduce waste, lower operational costs, and align with the circular economy model. The increasing preference for environmentally responsible solutions is expected to drive significant research and development activities, opening up new markets and partnerships across Europe.
Another promising opportunity lies in the expanding demand for specialty and high-performance solvents tailored to specific industrial applications. As industries like electronics, aerospace, and biotechnology grow more complex, the need for solvents with precise chemical properties is increasing. Manufacturers that can deliver highly specialized solvents offering superior purity, stability, and performance will be well-positioned to capture a greater share of the market. Furthermore, the ongoing digital transformation in manufacturing and the rise of advanced materials are creating new solvent requirements, particularly for precision cleaning, formulation, and processing. Companies that can adapt quickly to these evolving needs, offering customized and innovative solutions, will find significant growth opportunities. In parallel, collaborations with research institutions and end-user industries can further drive innovation and accelerate the adoption of next-generation solvents across the European market.
Market Segmentation Analysis:
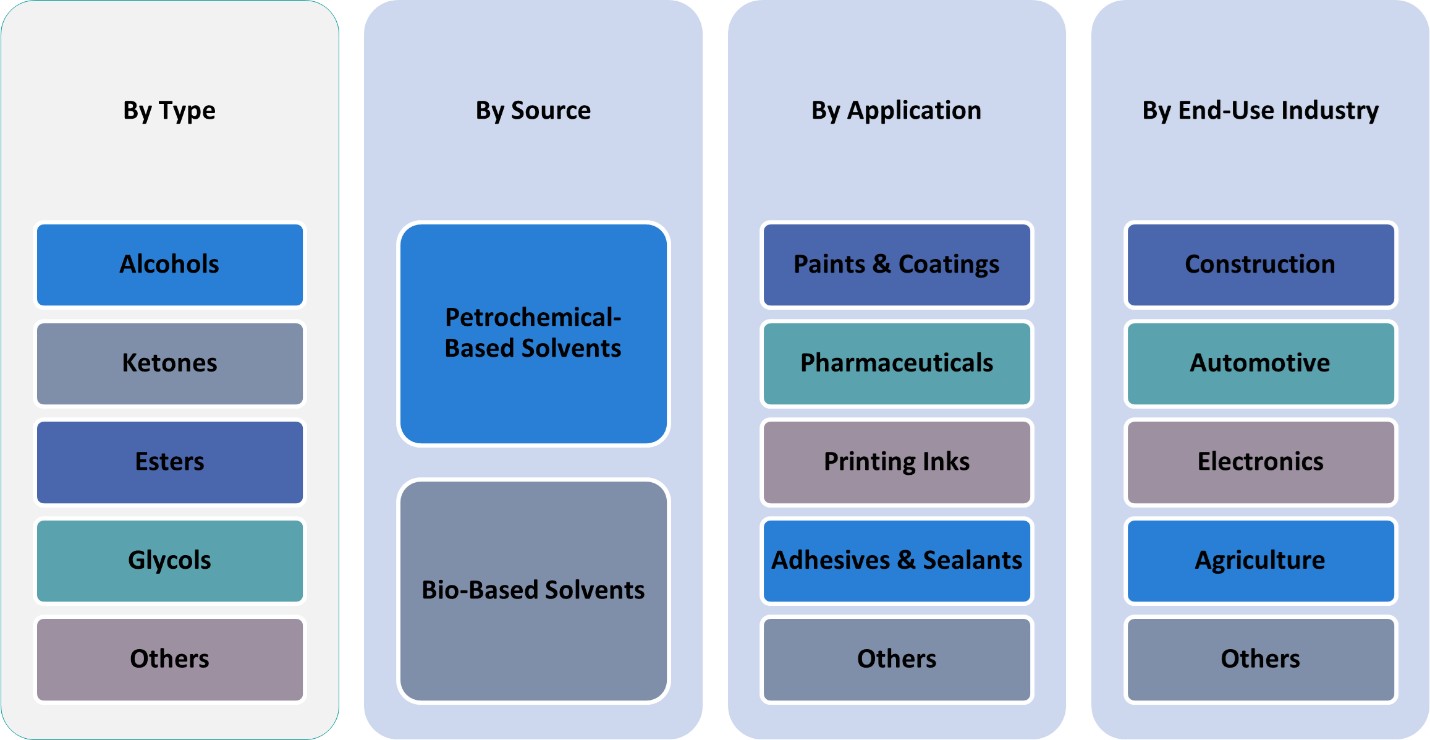
By Type:
The European industrial solvents market is segmented by type into alcohols, ketones, esters, glycols, and others. Alcohols, including ethanol and isopropanol, dominate the market due to their widespread usage across multiple industries, especially in paints, coatings, and pharmaceuticals. Their effectiveness as solvents and disinfectants, combined with growing demand for sanitization products, continues to drive this segment. Ketones, such as acetone and methyl ethyl ketone (MEK), are valued for their strong solvency power and rapid evaporation rates, making them essential in the production of paints, coatings, and adhesives. Esters are gaining popularity due to their application in environmentally friendly formulations and lower toxicity profiles, supporting the trend toward sustainable solutions. Glycols, primarily ethylene glycol and propylene glycol, are extensively used in applications requiring moisture retention and high solvency, notably in pharmaceuticals and personal care products. The “others” category, which includes hydrocarbons and chlorinated solvents, also contributes significantly, although regulatory pressures on volatile organic compounds are prompting a gradual shift toward greener alternatives.
By Application:
Based on application, the Europe industrial solvents market is segmented into paints and coatings, pharmaceuticals, printing inks, adhesives and sealants, and others. Paints and coatings represent the largest application segment, driven by robust demand in the construction, automotive, and industrial sectors. Solvents are critical in improving application properties and enhancing the durability and finish of coatings. The pharmaceutical sector is witnessing strong growth, fueled by increasing drug production and a heightened focus on healthcare innovation. Solvents play an essential role in drug formulation, synthesis, and purification processes. The printing inks segment benefits from the expansion of packaging industries, especially with the growth of e-commerce, requiring high-quality, solvent-based inks. In adhesives and sealants, solvents are vital for improving spreadability and adhesion properties, particularly in construction and automotive applications. Other applications, including chemical processing and personal care, also contribute steadily, supported by Europe’s focus on high-value specialty products and sustainable industrial practices.
Segments:
Based on Type:
- Alcohols
- Ketones
- Esters
- Glycols
- Others
Based on Application:
- Paints & Coatings
- Pharmaceuticals
- Printing Inks
- Adhesives & Sealants
- Others
Based on End- Use:
- Construction
- Automotive
- Electronics
- Agriculture
- Others
Based on Source:
- Petrochemical-Based Solvents
- Bio-Based Solvents
Based on the Geography:
- UK
- France
- Germany
- Italy
- Spain
- Russia
- Belgium
- Netherlands
- Austria
- Sweden
- Poland
- Denmark
- Switzerland
- Rest of Europe
Regional Analysis
Germany
Germany holding the largest market share at approximately 21% in 2024. As Europe’s leading manufacturing hub, Germany’s robust automotive, pharmaceutical, and chemical industries drive substantial demand for industrial solvents. The country’s commitment to technological innovation and strict adherence to environmental standards has also encouraged the adoption of bio-based and low-VOC solvents. Germany’s dynamic industrial base, combined with continuous investment in research and development, supports the growth of high-performance and specialty solvents. Furthermore, the expanding construction sector and increasing demand for advanced coatings and adhesives further strengthen Germany’s leadership position in the European market.
United Kingdom and France
The United Kingdom and France collectively account for a significant portion of the European industrial solvents market, with the UK holding a 13% share and France maintaining a 12% share. In the UK, a strong pharmaceutical and healthcare sector, along with developments in manufacturing and construction, fuels the demand for high-quality solvents. The country’s focus on sustainable and eco-friendly manufacturing practices also promotes the use of greener alternatives. France, on the other hand, benefits from a strong paints and coatings industry, supported by the growing automotive and aerospace sectors. Regulatory support for sustainable solutions and increasing investments in bio-based chemicals in France further provide opportunities for solvent manufacturers to expand their presence.
Italy and Spain
Italy and Spain represent another important region, with Italy accounting for 9% and Spain approximately 8% of the European industrial solvents market. In Italy, the growing industrial and manufacturing sectors, especially in automotive production and pharmaceuticals, continue to drive solvent consumption. The country’s proactive environmental policies are also pushing companies toward adopting eco-friendly solvent solutions. In Spain, the paints and coatings industry is a major consumer of industrial solvents, driven by growth in construction and infrastructure projects. Additionally, Spain’s chemical and pharmaceutical sectors are rapidly expanding, creating new opportunities for specialized and high-performance solvents across multiple industrial applications.
Rest of Europe
The Rest of Europe, which includes Russia, Belgium, the Netherlands, Austria, Sweden, Poland, Denmark, Switzerland, and other smaller markets, accounts for the remaining 37% of the European industrial solvents market. Russia stands out with its strong chemical manufacturing base, while Belgium and the Netherlands serve as important chemical and industrial hubs due to their strategic location and advanced logistics infrastructure. Countries like Sweden, Denmark, and Switzerland are increasingly emphasizing sustainable manufacturing practices, which is accelerating the adoption of green solvents. Overall, the Rest of Europe region benefits from a diversified industrial base and growing regulatory focus on environmental sustainability, which continues to shape solvent demand across a wide range of applications.
Key Player Analysis
- BASF SE
- Shell Chemicals
- Solvay S.A.
- Arkema S.A.
- INEOS Group
- Evonik Industries AG
- Clariant AG
- Synthomer plc
- AkzoNobel N.V.
- Perstorp Holding AB
Competitive Analysis
The competitive landscape of the Europe industrial solvents market is characterized by the presence of several prominent players, including BASF SE, Shell Chemicals, Solvay S.A., Arkema S.A., INEOS Group, Evonik Industries AG, Clariant AG, Synthomer plc, AkzoNobel N.V., and Perstorp Holding AB. These companies focus heavily on product innovation, sustainability, and strategic partnerships to maintain and expand their market positions. Many leading players are investing significantly in the development of bio-based and low-VOC solvents to align with Europe’s stringent environmental regulations and the rising demand for greener solutions. They are also enhancing their production capabilities and expanding their distribution networks across key European markets to cater to a broad range of industrial applications such as paints and coatings, pharmaceuticals, adhesives, and printing inks. Continuous research and development activities, mergers and acquisitions, and collaborations with local manufacturers are key strategies adopted by these companies to gain a competitive advantage and address the evolving needs of end-user industries.
Recent Developments
- In April 2025, Eastman announced off-list price increases for several EOD (Ethylene Oxide Derivatives) solvents, including Eastman™ DB Solvent, effective April 7, 2025, reflecting ongoing cost and market pressures.
- In March 2025, BASF reported generating approximately €11 billion in 2024 sales from products launched in the past five years, driven by R&D focused on sustainability, biodegradable materials, and digital transformation. The company filed 1,159 new patents in 2024, with 45% targeting sustainability. R&D investment in 2024 was €2.1 billion, with a similar budget planned for 2025.
- In March and April 2025, Shell is restructuring its global chemicals business to boost profitability and reduce capital spending by 2030. This includes exploring strategic partnerships in the U.S., potentially closing some European assets, and selling existing assets like the Singapore refinery and chemical complex. The company aims to streamline operations, focus on core businesses, and improve returns for shareholders.
- In March 2025, BASF is expanding its production capacity for aminic antioxidants at its Puebla, Mexico site, targeting the growing demand for long-life lubricants. The project is set for completion in 2026.
- In March 2025, ExxonMobil announced a $100 million upgrade to its Baton Rouge, Louisiana plant to produce ultra-high-purity (99.999%) isopropyl alcohol (IPA) for the semiconductor industry by 2027.
- In March 2024, Dow announced plans to invest in new ethylene derivatives capacity-including carbonate solvents-on the U.S. Gulf Coast. This investment, supported by the U.S. Department of Energy, aims to supply carbonate solvents for lithium-ion batteries, supporting the domestic EV and energy storage market. The facility will capture over 90% of CO₂ from ethylene oxide production, aligning with sustainability goals.
Market Concentration & Characteristics
The Europe industrial solvents market exhibits a moderate to high level of market concentration, with a few major multinational companies dominating a significant share of the industry. Key characteristics of the market include a strong focus on innovation, sustainability, and regulatory compliance, driven by Europe’s stringent environmental standards. The market is highly dynamic, with continuous developments in bio-based and low-VOC solvent technologies as companies respond to shifting consumer preferences and regulatory pressures. Large players leverage their extensive distribution networks, technological expertise, and financial strength to maintain a competitive edge, while smaller and regional manufacturers often focus on niche markets or specialized solvent solutions. Customer demand for high-performance, customized, and eco-friendly solvents shapes much of the competitive activity. Additionally, the market is influenced by broader industrial trends such as digitalization, circular economy initiatives, and increasing investment in research and development, making adaptability and innovation critical for sustained success in this evolving landscape
Report Coverage
The research report offers an in-depth analysis based on Type, Application, End-Use, Source and Geography. It details leading market players, providing an overview of their business, product offerings, investments, revenue streams, and key applications. Additionally, the report includes insights into the competitive environment, SWOT analysis, current market trends, as well as the primary drivers and constraints. Furthermore, it discusses various factors that have driven market expansion in recent years. The report also explores market dynamics, regulatory scenarios, and technological advancements that are shaping the industry. It assesses the impact of external factors and global economic changes on market growth. Lastly, it provides strategic recommendations for new entrants and established companies to navigate the complexities of the market.
Future Outlook
- The demand for industrial solvents in Europe is expected to grow steadily due to increasing applications in various industries such as automotive, pharmaceuticals, and paints.
- Regulatory pressure on the use of volatile organic compounds (VOCs) will likely drive innovations in solvent formulations with lower environmental impact.
- Rising emphasis on sustainability and green chemistry will promote the development of bio-based solvents as alternatives to conventional ones.
- The shift towards stricter environmental policies is likely to lead to greater adoption of low-emission and non-toxic solvents across industries.
- The ongoing trend toward automation and industrial digitization will increase the need for solvents in advanced manufacturing processes.
- The pharmaceutical industry’s growth will continue to be a significant driver, especially with the demand for solvents in drug formulation and production.
- Growing concern over health and safety will prompt manufacturers to prioritize solvents with reduced toxicity profiles.
- Increasing focus on eco-friendly production methods will push companies to explore water-based solvents and reduce reliance on organic solvents.
- Market growth in the paint and coatings sector will contribute significantly to the solvent industry, driven by the need for advanced finishes and coatings.
- Technological advancements in solvent recovery and recycling systems will improve solvent utilization, reducing waste and improving cost efficiency.


