Market Overview:
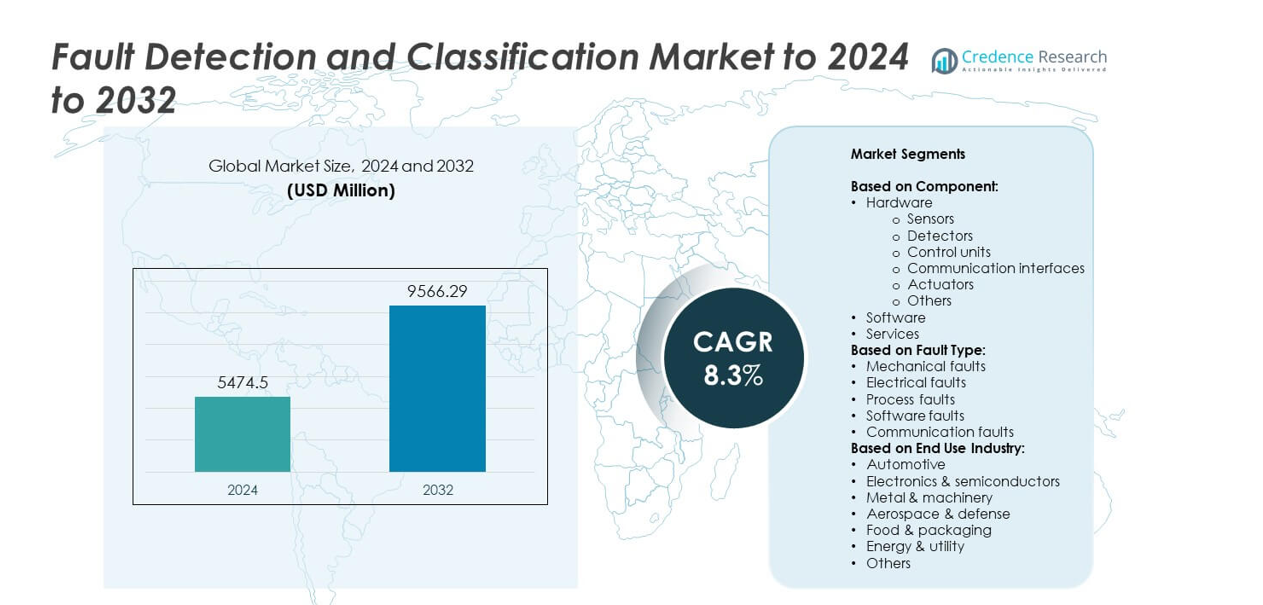
The Fault Detection and Classification market size was valued at USD 5,474.5 million in 2024 and is anticipated to reach USD 9,566.29 million by 2032, at a CAGR of 8.3% during the forecast period.
| REPORT ATTRIBUTE |
DETAILS |
| Historical Period |
2020-2023 |
| Base Year |
2024 |
| Forecast Period |
2025-2032 |
| Fault Detection and Classification Market Size 2024 |
USD 5,474.5 million |
| Fault Detection and Classification Market, CAGR |
8.3% |
| Fault Detection and Classification Market Size 2032 |
USD 9,566.29 million |
The fault detection and classification market is shaped by prominent players such as Synopsys, Siemens, Amazon Web Services, Teradyne, KLA Corporation, Applied Materials, Tokyo Electron, OMRON, and ADVANTEST. These companies drive innovation through AI-powered analytics, IoT-enabled monitoring, and advanced hardware and software solutions tailored for predictive maintenance and industrial automation. Strategic partnerships and R&D investments strengthen their market positions across diverse industries, including automotive, electronics, and energy. Regionally, North America led the market in 2024 with a 35% share, supported by strong adoption of Industry 4.0 and strict regulatory standards, while Europe held 28% and Asia Pacific followed with 25%, reflecting rapid industrial growth.
Market Insights
- The fault detection and classification market was valued at USD 5,474.5 million in 2024 and is projected to reach USD 9,566.29 million by 2032, growing at a CAGR of 8.3%.
- Rising demand for predictive maintenance, adoption of Industry 4.0, and strict quality regulations are the key drivers fueling market growth across industrial sectors.
- Integration of artificial intelligence and machine learning is a major trend, enabling accurate fault classification and improving efficiency in automotive, electronics, and semiconductor industries.
- The competitive landscape is shaped by global leaders investing in advanced sensors, software platforms, and AI-driven analytics to strengthen their presence across manufacturing, utilities, and aerospace.
- North America led the market with 35% share in 2024, followed by Europe with 28% and Asia Pacific with 25%, while the hardware segment, dominated by sensors, accounted for the largest share among components.
Access crucial information at unmatched prices!
Request your sample report today & start making informed decisions powered by Credence Research Inc.!
Download Sample
Market Segmentation Analysis:
By Component
The hardware segment dominated the fault detection and classification market in 2024, accounting for over 55% share. Within hardware, sensors emerged as the leading sub-segment, driven by their vital role in monitoring equipment performance, collecting real-time data, and enabling predictive maintenance. Expanding adoption of IoT and Industry 4.0 technologies further supports the demand for advanced sensors and detectors. Control units and actuators add to system efficiency, while communication interfaces ensure seamless connectivity. Growing investments in automation and smart manufacturing are strengthening hardware’s leadership, supported by the rising need for accurate, real-time fault monitoring solutions.
- For instance, Bosch Sensortec shipped over 1 billion MEMS sensors featuring integrated microcontrollers and software in 2024, as announced by the company during its 20th anniversary celebration.
By Fault Type
Mechanical faults held the dominant position in 2024, contributing nearly 40% of the overall market share. Their prevalence is tied to widespread machinery and equipment use across industries such as automotive, aerospace, and metal fabrication. Rising demand for predictive maintenance solutions has accelerated fault detection adoption to reduce downtime and extend machine lifecycles. Electrical and process faults also represent significant portions, driven by expanding use of electronics and industrial automation. However, mechanical faults remain the most monitored due to frequent wear, vibration, and failure risks, pushing industries toward integrated diagnostic and fault classification systems.
- For instance, GE Vernova tracks reliability across 1,350+ F-class gas turbines with 1.6 million starts and 91 million+ operating hours data informing maintenance.
By End Use Industry
The automotive sector led the market in 2024 with over 30% share, reflecting high reliance on fault detection for safety, performance, and reliability. Increasing vehicle complexity, use of embedded electronics, and the transition toward electric and autonomous vehicles fuel adoption. Advanced diagnostic tools and automated fault classification are now integral to reducing recalls and ensuring compliance with stringent safety standards. Electronics and semiconductors follow closely, driven by the need for precision and quality control. Despite growth in aerospace, defense, and energy sectors, automotive continues to dominate as manufacturers prioritize real-time monitoring and predictive maintenance technologies.
Key Growth Drivers
Rising Adoption of Industry 4.0 and Smart Manufacturing
Industry 4.0 integration is the key growth driver in the fault detection and classification market. Smart manufacturing relies on real-time monitoring, automation, and predictive analytics to improve efficiency. Advanced sensors, machine learning algorithms, and IoT-enabled systems ensure early fault detection and reduce downtime. Manufacturers are investing heavily in connected devices and digital twins to enhance operational reliability. This shift toward intelligent factories fuels strong demand for hardware, software, and services, making Industry 4.0 adoption the primary force accelerating market expansion.
- For instance, ABB Robotics has an installed base of 500,000+ robots worldwide, underscoring automation scale.
Increasing Demand for Predictive Maintenance
Predictive maintenance adoption is a major growth driver, enabling industries to forecast equipment failures and optimize performance. Fault detection and classification technologies identify anomalies before breakdowns occur, helping reduce repair costs and extend machinery lifespan. Sectors like automotive, energy, and aerospace benefit from reduced downtime and higher reliability. The shift from reactive to predictive approaches drives consistent investments in detection hardware and software. With industries prioritizing efficiency and cost savings, predictive maintenance solutions will remain a central growth pillar.
- For instance, Airbus Skywise had about 11,600–12,000 aircraft connected in late 2024–2025 for data-driven maintenance.
Stringent Quality and Safety Standards Across Industries
Rising global regulations and safety standards act as another strong growth driver. Industries such as automotive, aerospace, and electronics face strict compliance requirements, necessitating advanced fault detection systems to ensure reliability and product quality. The adoption of safety-focused frameworks compels companies to integrate automated fault classification into production lines. These systems help reduce recalls, enhance brand trust, and ensure regulatory adherence. With tightening standards worldwide, demand for advanced solutions is expected to escalate, reinforcing compliance as a critical driver of market growth.
Key Trends and Opportunities
Integration of Artificial Intelligence and Machine Learning
AI and machine learning integration is a key trend shaping the market. These technologies enhance fault detection accuracy by identifying hidden patterns and enabling adaptive learning models. Industries are adopting AI-based algorithms to classify faults with greater precision, leading to improved predictive maintenance. AI-driven analytics also support faster decision-making, reducing operational risks. The opportunity lies in deploying scalable AI solutions across sectors such as automotive and electronics, where high accuracy and efficiency are vital.
- For instance, Airbus reports that its Skywise data platform connects over 11,900 aircraft and serves over 48,000 users who analyze operational data for predictive maintenance and efficiency improvements.
Expansion in Energy and Utility Sector
The growing deployment of renewable energy and smart grids presents a significant opportunity. Energy and utility operators require reliable fault detection systems to manage grid stability and protect assets from unexpected failures. With rising investments in wind, solar, and distributed generation, fault detection technologies help ensure uninterrupted supply and operational safety. The opportunity is amplified by the global push for sustainable energy, making advanced detection and classification tools essential in modernizing power infrastructure.
- For instance, in June 2021, Landis+Gyr completed the initial deployment of a system with 28.4 million advanced meters for TEPCO. Following this, an upgrade to the existing infrastructure was completed in April 2025, allowing the system to communicate with nearly 30 million devices and achieving read rates that significantly exceeded historical performance metrics.
Key Challenges
High Implementation and Maintenance Costs
One of the key challenges is the high cost associated with adopting advanced fault detection systems. Initial investments in hardware, AI-enabled software, and skilled workforce training remain substantial, especially for small and medium enterprises. Maintenance and system upgrades add to recurring expenses, creating barriers to widespread adoption. Although large enterprises readily invest in such technologies, cost sensitivity among smaller players may restrict broader market penetration, slowing down overall growth in price-sensitive regions.
Complexity in System Integration
Integrating fault detection and classification solutions with existing industrial systems is another major challenge. Diverse equipment, legacy systems, and varying communication protocols complicate seamless deployment. Industries often face compatibility issues that require customization, increasing time and cost. The challenge intensifies with multi-vendor environments where interoperability becomes critical. Limited technical expertise in some regions further hampers adoption. Overcoming these integration hurdles is essential for industries to achieve the full potential of automated fault detection and predictive analytics solutions.
Regional Analysis
North America
North America held the largest share of the fault detection and classification market in 2024, accounting for around 35%. The region benefits from advanced manufacturing industries, widespread adoption of Industry 4.0, and strong investment in automation technologies. High regulatory standards in automotive, aerospace, and electronics further support adoption of fault detection solutions. The United States leads the region, driven by extensive use of AI, machine learning, and predictive maintenance systems. Canada also contributes significantly through its energy and utility projects, reinforcing North America’s dominance in fault detection and classification technologies.
Europe
Europe captured approximately 28% of the market share in 2024, supported by strict quality standards and strong industrial automation across Germany, the U.K., and France. Automotive and aerospace sectors are major contributors, given the emphasis on safety, efficiency, and compliance with EU regulations. Investments in renewable energy and smart grid projects also fuel adoption of advanced fault detection systems. Europe’s well-established electronics and semiconductor industries further expand demand for real-time fault monitoring solutions. With sustainability goals and innovation-driven policies, Europe maintains a strong position in the global market.
Asia Pacific
Asia Pacific accounted for nearly 25% of the global market share in 2024, driven by rapid industrialization, large-scale manufacturing, and rising adoption of automation in China, Japan, South Korea, and India. Expanding automotive production and semiconductor manufacturing in the region increase demand for advanced fault detection solutions. Government initiatives promoting smart factories and digital transformation also contribute to growth. China leads with its strong industrial base, while Japan and South Korea drive innovation in electronics and machinery. Asia Pacific remains the fastest-growing region, supported by cost-effective manufacturing and technological advancements.
Latin America
Latin America held a market share of around 7% in 2024, supported by gradual industrial modernization and increasing adoption of predictive maintenance. Brazil and Mexico are the primary contributors, with growth in automotive, food processing, and energy sectors driving demand for fault detection systems. Regional manufacturers are investing in automation technologies to improve efficiency and reduce downtime. However, limited technical expertise and budget constraints among small enterprises hinder faster adoption. Despite these challenges, Latin America is steadily integrating fault detection and classification solutions, supported by expanding industrial activities.
Middle East and Africa
The Middle East and Africa accounted for nearly 5% of the global market share in 2024, driven by rising investments in energy, oil and gas, and utilities. Countries such as Saudi Arabia and the United Arab Emirates are adopting advanced monitoring systems to ensure operational safety and efficiency. Africa shows gradual adoption, with South Africa focusing on manufacturing and mining industries. Budget limitations and slower technological adoption remain challenges, but growing infrastructure projects and diversification efforts in the Gulf states are expected to strengthen demand for fault detection solutions in the coming years.
Market Segmentations:
By Component:
- Hardware
- Sensors
- Detectors
- Control units
- Communication interfaces
- Actuators
- Others
- Software
- Services
By Fault Type:
- Mechanical faults
- Electrical faults
- Process faults
- Software faults
- Communication faults
By End Use Industry:
- Automotive
- Electronics & semiconductors
- Metal & machinery
- Aerospace & defense
- Food & packaging
- Energy & utility
- Others
By Geography
- North America
- Europe
- Germany
- France
- U.K.
- Italy
- Spain
- Rest of Europe
- Asia Pacific
- China
- Japan
- India
- South Korea
- South-east Asia
- Rest of Asia Pacific
- Latin America
- Brazil
- Argentina
- Rest of Latin America
- Middle East & Africa
- GCC Countries
- South Africa
- Rest of the Middle East and Africa
Competitive Landscape
The competitive landscape of the fault detection and classification market is shaped by leading players such as Synopsys, Inc., Siemens AG, Amazon Web Services, Inc., Teradyne Inc., Qualitas Technologies, MobiDev, INFICON, Tokyo Electron Limited, OMRON Corporation, SAMSUNG SDS, Applied Materials, Inc., einnoSys Technologies Inc., KLA Corporation, Microsoft, CIM Environmental Pty Ltd., KILI TECHNOLOGY, Cognex Corporation, and ADVANTEST CORPORATION. These companies compete through innovation in hardware, software, and service offerings, focusing on accuracy, scalability, and integration with advanced technologies. The market is marked by heavy investment in artificial intelligence, machine learning, and IoT-based platforms to enhance predictive maintenance and improve operational efficiency. Partnerships with manufacturing and energy industries play a critical role in strengthening customer reach and expanding global footprints. Continuous R&D efforts, product differentiation, and regulatory compliance support competitive advantages, while high entry barriers due to capital-intensive technologies limit new entrants. This dynamic environment drives strong innovation-led growth across multiple industries.
Shape Your Report to Specific Countries or Regions & Enjoy 30% Off!
Key Player Analysis
- Synopsys, Inc.
- Siemens AG
- Amazon Web Services, Inc.
- Teradyne Inc.
- Qualitas Technologies
- MobiDev
- INFICON
- Tokyo Electron Limited
- OMRON Corporation
- SAMSUNG SDS
- Applied Materials, Inc.
- einnoSys Technologies Inc.
- KLA Corporation
- Microsoft
- CIM Environmental Pty Ltd.
- KILI TECHNOLOGY
- Cognex Corporation
- ADVANTEST CORPORATION
Recent Developments
- In 2025, Siemens’s generative AI assistant became more established as an “Industrial Copilot,” assisting shop-floor employees in their maintenance decisions and improving overall productivity.
- In 2023, ADVANTEST CORPORATION Launched several new memory wafer test products, including the T5230 memory wafer test solution, the STM32G NAND system-level test module for the T5851 memory tester, and the T5835 high-speed wafer-sort interface option.
- In 2023, SAMSUNG SDS Launched an AI-powered FDC solution for the transportation sector to detect and classify faults in vehicles and infrastructure, thereby boosting safety and efficiency
Report Coverage
The research report offers an in-depth analysis based on Component, Fault Type, End-Use Industry and Geography. It details leading market players, providing an overview of their business, product offerings, investments, revenue streams, and key applications. Additionally, the report includes insights into the competitive environment, SWOT analysis, current market trends, as well as the primary drivers and constraints. Furthermore, it discusses various factors that have driven market expansion in recent years. The report also explores market dynamics, regulatory scenarios, and technological advancements that are shaping the industry. It assesses the impact of external factors and global economic changes on market growth. Lastly, it provides strategic recommendations for new entrants and established companies to navigate the complexities of the market.
Future Outlook
- The market will expand steadily, supported by adoption of Industry 4.0 technologies.
- Predictive maintenance solutions will gain wider use across manufacturing and utilities.
- AI and machine learning will enhance accuracy and fault classification efficiency.
- Automotive and electronics industries will continue leading adoption of fault detection systems.
- Energy and utility sectors will create new growth opportunities with renewable integration.
- Hardware components like sensors will remain dominant due to their critical monitoring role.
- Software solutions will grow faster with rising demand for analytics and real-time monitoring.
- Asia Pacific will emerge as the fastest-growing regional market.
- High implementation costs will challenge adoption among small and medium enterprises.
- Integration with digital twins and IoT ecosystems will define future advancements.


