Market Overview:
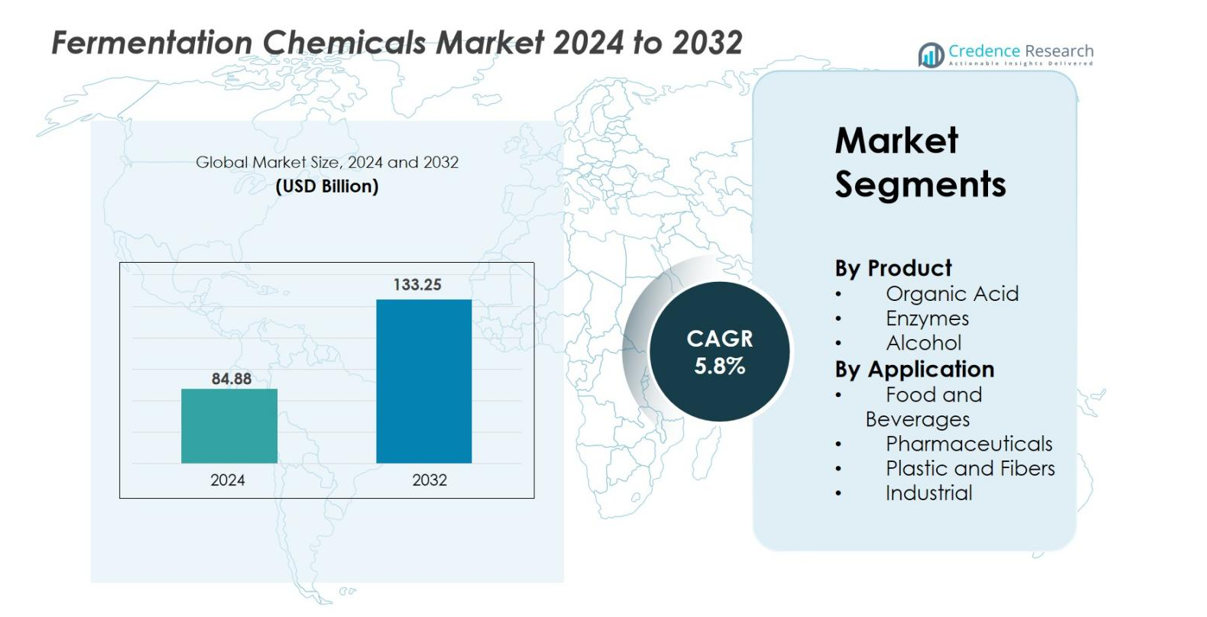
The Fermentation Chemicals Market size was valued at USD 84.88 Billion in 2024 and is anticipated to reach USD 133.25 Billion by 2032, at a CAGR of 5.8% during the forecast period.
| REPORT ATTRIBUTE |
DETAILS |
| Historical Period |
2020-2023 |
| Base Year |
2024 |
| Forecast Period |
2025-2032 |
| Fermentation Chemicals Market Size 2024 |
USD 84.88 Billion |
| Fermentation Chemicals Market, CAGR |
5.8% |
| Fermentation Chemicals Market Size 2032 |
USD 133.25 Billion |
The Fermentation Chemicals market is led by key players such as BASF SE, Cargill, ADM, Ajinomoto, and Chr. Hansen A/S, who leverage advanced bioprocessing technologies and extensive production networks. These companies dominate through diversified product portfolios in organic acids, enzymes, and alcohols, addressing the pharmaceutical, food, and industrial sectors. Asia-Pacific holds the leading regional position with approximately 35% market share in 2024, driven by large-scale manufacturing, supportive government policies, and rising demand for bio-based chemicals. North America follows closely with around 32% share, benefiting from strong biotechnology infrastructure and high adoption in food and pharmaceuticals.
Market Insights
- The Fermentation Chemicals market was valued at USD 84.88 Billion in 2024 and is projected to reach USD 133.25 Billion by 2032, registering a CAGR of 5.8% during the forecast period.
- Strong demand for bio-based products in food & beverages and pharmaceuticals is driving market growth, supported by advancements in fermentation process efficiencies and eco-friendly production methods.
- Key trends include the rising adoption of fermentation in bioplastics, sustainable packaging, and the increasing shift toward industrial biotechnology and biorefineries.
- The market is moderately consolidated, with leading companies like BASF SE, ADM, Cargill, Ajinomoto, and Chr. Hansen A/S innovating through R&D investment and strategic partnerships; however, high production costs and scalability challenges remain significant barriers.
- Asia-Pacific leads with 35% market share, followed by North America with 32% and Europe with 28%; the Organic Acid segment dominates product-wise with around 46% share, while Food & Beverages hold the top application share of nearly 38%.
Access crucial information at unmatched prices!
Request your sample report today & start making informed decisions powered by Credence Research Inc.!
Download Sample
Market Segmentation Analysis
By Product
In the Fermentation Chemicals market, the Organic Acid segment dominates with approximately 46% market share in 2024, driven by its extensive use in food preservation, pharmaceuticals, and industrial applications. These acids, including citric, lactic, and acetic acids, are gaining traction due to their eco-friendly and biodegradable nature. The enzymes segment is also experiencing steady growth due to expanding applications in biofuel production and detergents, while alcohols continue to serve as critical inputs in beverages and chemical synthesis. The shift toward bio-based products further supports demand for fermentation-derived chemicals.
- For instance, NatureWorks LLC, a joint venture between Cargill and PTT Global Chemical, operates the world’s first and largest polylactic acid (PLA) manufacturing plant in Blair, Nebraska, with an annual production capacity of 150,000 metric tons. This integrated facility, located within the larger Cargill Biorefinery Campus, produces Ingeo biopolymer resins, enabling industrial-scale supply for bioplastics and personal care applications.
By Application
The Food and Beverages segment holds the leading position with nearly 38% market share in 2024, as fermentation-derived products are integral to food processing, preservation, and flavor enhancement. High demand for clean-label and naturally processed foods is a major driver in this segment. Pharmaceuticals also represent a significant application area, fueled by rising use of fermentation in antibiotic and vitamin production. Meanwhile, the plastics and fibers segment is gaining momentum as industries increasingly adopt bio-based raw materials for sustainable manufacturing solutions.
- For instance, Chr. Hansen A/S developed its third-generation bioprotective cultures that have proven to extend dairy shelf life by up to 10 days, reducing food waste significantly.
Key Growth Drivers
Increasing Demand for Bio-Based Chemicals
The rising preference for sustainable and eco-friendly chemicals is a core growth driver in the Fermentation Chemicals market. Industries across food, pharmaceuticals, agriculture, and plastics are shifting toward bio-based alternatives to reduce environmental impact and comply with stricter regulations. Fermentation enables the production of biodegradable chemicals like organic acids, alcohols, and enzymes with lower carbon footprints. The push for circular economy practices and decreasing reliance on petrochemical-based products is accelerating adoption. Government incentives for bioeconomy development and increasing investment in fermentation technology startups are further boosting market demand. Additionally, innovations in microbial strain engineering and process optimization are enhancing production efficiencies, making bio-based chemicals a cost-effective and scalable alternative. This transition aligns with global sustainability goals, making fermentation-based products more competitive.
- For instance, Corbion has invested in a 125,000-ton per year lactic acid plant in Thailand, significantly expanding bio-based polymer and food ingredient production.
Growing Application Scope in Pharmaceuticals and Nutraceuticals
The expansion of fermentation chemicals in pharmaceuticals and nutraceuticals is driving significant market growth. Fermentation plays a critical role in producing essential compounds like antibiotics, vitamins, amino acids, and probiotics. As health awareness grows worldwide, demand for functional foods and supplements is surging, particularly those containing naturally derived metabolites. Pharmaceutical manufacturing is also increasingly reliant on fermentation-based processes due to their precision and ability to produce complex molecules. Advances in biotechnology, including recombinant DNA and metabolic engineering, are enabling the creation of high-quality ingredients at competitive costs. Moreover, the rise of chronic diseases and the aging population are boosting demand for biopharmaceuticals and nutraceuticals, further expanding market opportunities for fermentation chemicals across these high-value sectors.
- For instance, Yakult Honsha’s global fermentation facilities produce the Lactobacillus casei Shirota strain in quantities sufficient to provide over 40 million bottles of Yakult, which are consumed daily across 40 countries and regions. Each individual bottle contains billions of the probiotic cultures (e.g., more than 6.5 billion in some markets and a minimum of 20 billion in others).
Technological Advancements and Process Optimization
Technological innovation is a fundamental growth driver in the fermentation chemicals industry. Continuous improvements in bioprocess engineering, genetic modification, and digital monitoring have significantly enhanced the efficiency and yield of fermentation processes. The integration of AI and data analytics in fermentation allows real-time optimization of variables like temperature, pH, and nutrient flow, leading to higher product consistency and reduced operational costs. The adoption of continuous fermentation over traditional batch operations is also improving scalability for industrial applications. Furthermore, innovations in biomass utilization and the use of renewable substrates are lowering feedstock costs. These advancements are enabling manufacturers to meet growing demand across industries like textiles, biofuels, and plastics while maintaining profitability. Enhanced production efficiency and sustainability give fermentation-based solutions a competitive edge over traditional chemical synthesis methods.
Key Trends & Opportunities
Rise of Industrial Biotechnology and Biorefineries
The shift toward industrial biotechnology and biorefinery models is a major trend in the fermentation chemicals market. Biorefineries allow for the integrated production of chemicals, fuels, and energy from biomass using fermentation techniques. This model enhances resource efficiency and reduces waste, aligning with global sustainability and circular economy goals. Industries are increasingly investing in biorefinery infrastructure to convert agricultural residues, food waste, and lignocellulosic biomass into high-value fermentation chemicals. Collaboration between research institutions and chemical manufacturers is accelerating the development of cost-effective feedstocks and advanced microbial strains. Additionally, policies promoting renewable energy and low-carbon technologies are creating a favorable environment for biorefinery expansion. As a result, the trend is unlocking new revenue streams and enabling manufacturers to optimize fermentation outputs for diverse industrial uses.
- For instance, TotalEnergies Corbion has developed biopolymer technology capable of producing over 75,000 tons per year of polylactic acid from sugarcane fermentation at its Thailand plant.
Expansion of Fermentation in Sustainable Packaging and Bioplastics
The growing demand for biodegradable and bio-based packaging materials is creating new opportunities for fermentation-derived chemicals. Biopolymers like polylactic acid (PLA) and polyhydroxyalkanoates (PHA), produced through microbial fermentation, are gaining traction as alternatives to conventional plastics. Companies in the consumer goods, food packaging, and textile industries are adopting bioplastic materials to meet sustainability goals and respond to regulatory pressure. Increased investment in R&D for scalable production and lower-cost fermentation processes is making bioplastics more accessible. This trend is further supported by brands’ commitment to carbon neutrality and waste reduction. As public awareness of environmental pollution rises, the role of fermentation in producing eco-friendly materials becomes central to market evolution. The opportunity lies in expanding production capacities and reducing price barriers to mainstream adoption.
- For instance, NatureWorks manufactures more than 150,000 tons of Ingeo™ PLA annually at its Nebraska facility, supplying bioplastic solutions to over 500 customers globally.
Key Challenges
High Production Costs and Scale-Up Limitations
Despite its advantages, fermentation-based chemical production faces challenges related to high operational costs and scale-up complexity. Fermentation requires precise environmental control, specialized equipment, and energy-intensive processes that can increase overall production expenses. Feedstock availability and cost also significantly influence profitability, especially when relying on refined sugars or agricultural inputs subject to price volatility. Scaling fermentation from lab to industrial level presents technical hurdles, including contamination risks and process inconsistencies. These challenges make it difficult for smaller manufacturers to compete with synthetic chemical producers. To address these issues, industry stakeholders are investing in cost-effective feedstocks like lignocellulosic biomass and optimizing continuous fermentation systems. However, overcoming these barriers remains essential to achieving wider adoption and cost parity with traditional chemical production.
Regulatory Constraints and Quality Standardization
The fermentation chemicals market operates under stringent regulatory frameworks that require high-quality, consistent output, especially in pharmaceuticals, food, and cosmetics. Meeting global and regional compliance standards can significantly increase research and production costs. Inconsistent quality control across fermentation batches creates additional challenges for standardization, particularly in complex chemical synthesis. Regulatory approval processes for new fermentation-based products can also be lengthy and demanding, slowing time-to-market for innovations. Manufacturers must invest heavily in quality management systems, documentation, and traceability to ensure compliance. Navigating varied international regulations adds another layer of complexity. While regulatory compliance assures product safety and reliability, it can also hinder rapid commercialization and scalability, particularly for emerging players and innovative product formulations.
Regional Analysis
North America
North America holds a substantial share of the Fermentation Chemicals market, accounting for 32% in 2024. The U.S. leads the region due to strong demand from the pharmaceutical, food, and biofuel sectors. Advanced biotechnology infrastructure, high R&D investments, and the presence of key market players further support regional dominance. Regulatory support for sustainable chemicals and increasing demand for bio-based products contribute to growth. Expanding production of fermentation-derived enzymes and organic acids in industrial applications such as textiles and personal care also strengthens market expansion.
Europe
Europe represents 28% of the global Fermentation Chemicals market in 2024, driven by stringent environmental regulations and a strong shift toward bio-based and biodegradable alternatives. Countries like Germany, France, and the Nordics lead in adopting fermentation-based processes for food, pharmaceuticals, and bioplastics. The EU’s Green Deal initiatives and circular economy policies encourage sustainable chemical production, creating a favorable environment. Significant investments in industrial biotechnology and innovation in microbial fermentation processes enhance regional production capacity and reduce reliance on petrochemicals, reinforcing Europe’s role as a key market.
Asia-Pacific
The Asia-Pacific region holds the largest share of the global market with 35% in 2024, driven by high demand from food processing, pharmaceuticals, and industrial applications. China, India, and Japan dominate due to expanding manufacturing bases, growing population, and rising preference for sustainable raw materials. Favorable government policies for biotechnological development and low-cost production capabilities further enhance regional competitiveness. Increasing adoption of fermentation chemicals in agriculture, textile, and packaging applications, along with strong export potential for organic acids and enzymes, makes Asia-Pacific the fastest-growing regional market.
Latin America
Latin America accounts for 3% of the Fermentation Chemicals market in 2024. Growth is primarily driven by Brazil and Mexico due to their expanding food and beverage industries and growing focus on sustainable bio-based products. Investments in sugarcane-based ethanol production and increased awareness of green chemicals support market expansion. Despite relatively slower technology adoption compared to developed regions, rising industrialization, agricultural output, and the presence of local fermentation-based producers provide opportunities for market development.
Middle East & Africa
The Middle East & Africa region represents 2% of the global Fermentation Chemicals market in 2024, with growth anchored in the food, beverage, and pharmaceutical industries. Increasing urbanization and rising disposable incomes are boosting demand for processed food and personal care products that rely on fermentation-derived ingredients. While the region lacks extensive production infrastructure, increasing investments in biotechnology and the presence of multinational companies are gradually expanding market awareness. Opportunities exist in biofuel production and industrial applications as sustainability initiatives grow across key countries like South Africa and the UAE.
Market Segmentations
By Product
- Organic Acid
- Enzymes
- Alcohol
By Application
- Food and Beverages
- Pharmaceuticals
- Plastic and Fibers
- Industrial
By Geography
- North America
- Europe
- Germany
- France
- U.K.
- Italy
- Spain
- Rest of Europe
- Asia Pacific
- China
- Japan
- India
- South Korea
- South-east Asia
- Rest of Asia Pacific
- Latin America
- Brazil
- Argentina
- Rest of Latin America
- Middle East & Africa
- GCC Countries
- South Africa
- Rest of the Middle East and Africa
Competitive Landscape
The competitive landscape of the Fermentation Chemicals market is characterized by the presence of prominent global players alongside regional manufacturers, resulting in a moderately consolidated structure. Key companies such as BASF SE, Cargill, ADM, Ajinomoto, and Chr. Hansen A/S dominate the market through extensive product portfolios, global distribution networks, and continuous investment in biotechnological innovation. These players focus on expanding production capacities, optimizing fermentation processes, and enhancing sustainability through bio-based raw materials. Strategic collaborations, mergers, and acquisitions are common as companies seek to strengthen their market position and diversify applications across food, pharmaceuticals, and industrial sectors. Emerging players like Corbion NV and Amano Enzymes are contributing to market disruption through specialized product offerings and rapid advancements in enzyme and organic acid production. Increasing R&D efforts aimed at improving yield efficiency, reducing costs, and leveraging advanced strain engineering are key strategies shaping the competitive dynamics in this evolving sector.
Shape Your Report to Specific Countries or Regions & Enjoy 30% Off!
Key Player Analysis
- BASF SE
- Chr. Hansen A/S
- AB Enzymes
- Ajinomoto
- Corbion NV
- ADM
- Amano Enzymes
- Dow Chemical
- Cargill
- Ashland Global Holdings
Recent Developments
- In November 2025, Chromologics (a Danish biotech firm producing fermentation-based natural colours) raised €7 million to support regulatory submissions and scale-up of its fermentation-derived natural colour “Natu.Red®”.
- In September 2025, Evonik Industries AG launched its “VECOLLAN®” recombinant collagen (a fermentation-based biomaterial) for use in clinical-grade medical device development.
Report Coverage
The research report offers an in-depth analysis based on Product, Application and Geography. It details leading market players, providing an overview of their business, product offerings, investments, revenue streams, and key applications. Additionally, the report includes insights into the competitive environment, SWOT analysis, current market trends, as well as the primary drivers and constraints. Furthermore, it discusses various factors that have driven market expansion in recent years. The report also explores market dynamics, regulatory scenarios, and technological advancements that are shaping the industry. It assesses the impact of external factors and global economic changes on market growth. Lastly, it provides strategic recommendations for new entrants and established companies to navigate the complexities of the market.
Future Outlook
- Demand for bio-based and sustainable chemicals will accelerate as industries shift from petrochemical dependence.
- Innovations in microbial strain engineering will enhance yield and efficiency across fermentation processes.
- Integration of AI and automation will improve real-time monitoring and process optimization.
- Expansion of biorefinery models will enable efficient biomass conversion for multi-product outputs.
- Fermentation chemicals will find increased use in bioplastics and sustainable packaging solutions.
- Growth in pharmaceuticals and nutraceuticals will continue to boost fermentation-based ingredient demand.
- Investments in R&D will expand applications in agriculture, textiles, and personal care.
- High potential exists for commercialization of fermentation chemicals in emerging economies.
- Collaborative ventures between biotech firms and chemical manufacturers will drive capacity expansion.
- Regulatory support for low-carbon and biodegradable products will enhance market penetration globally.


