Market Overview
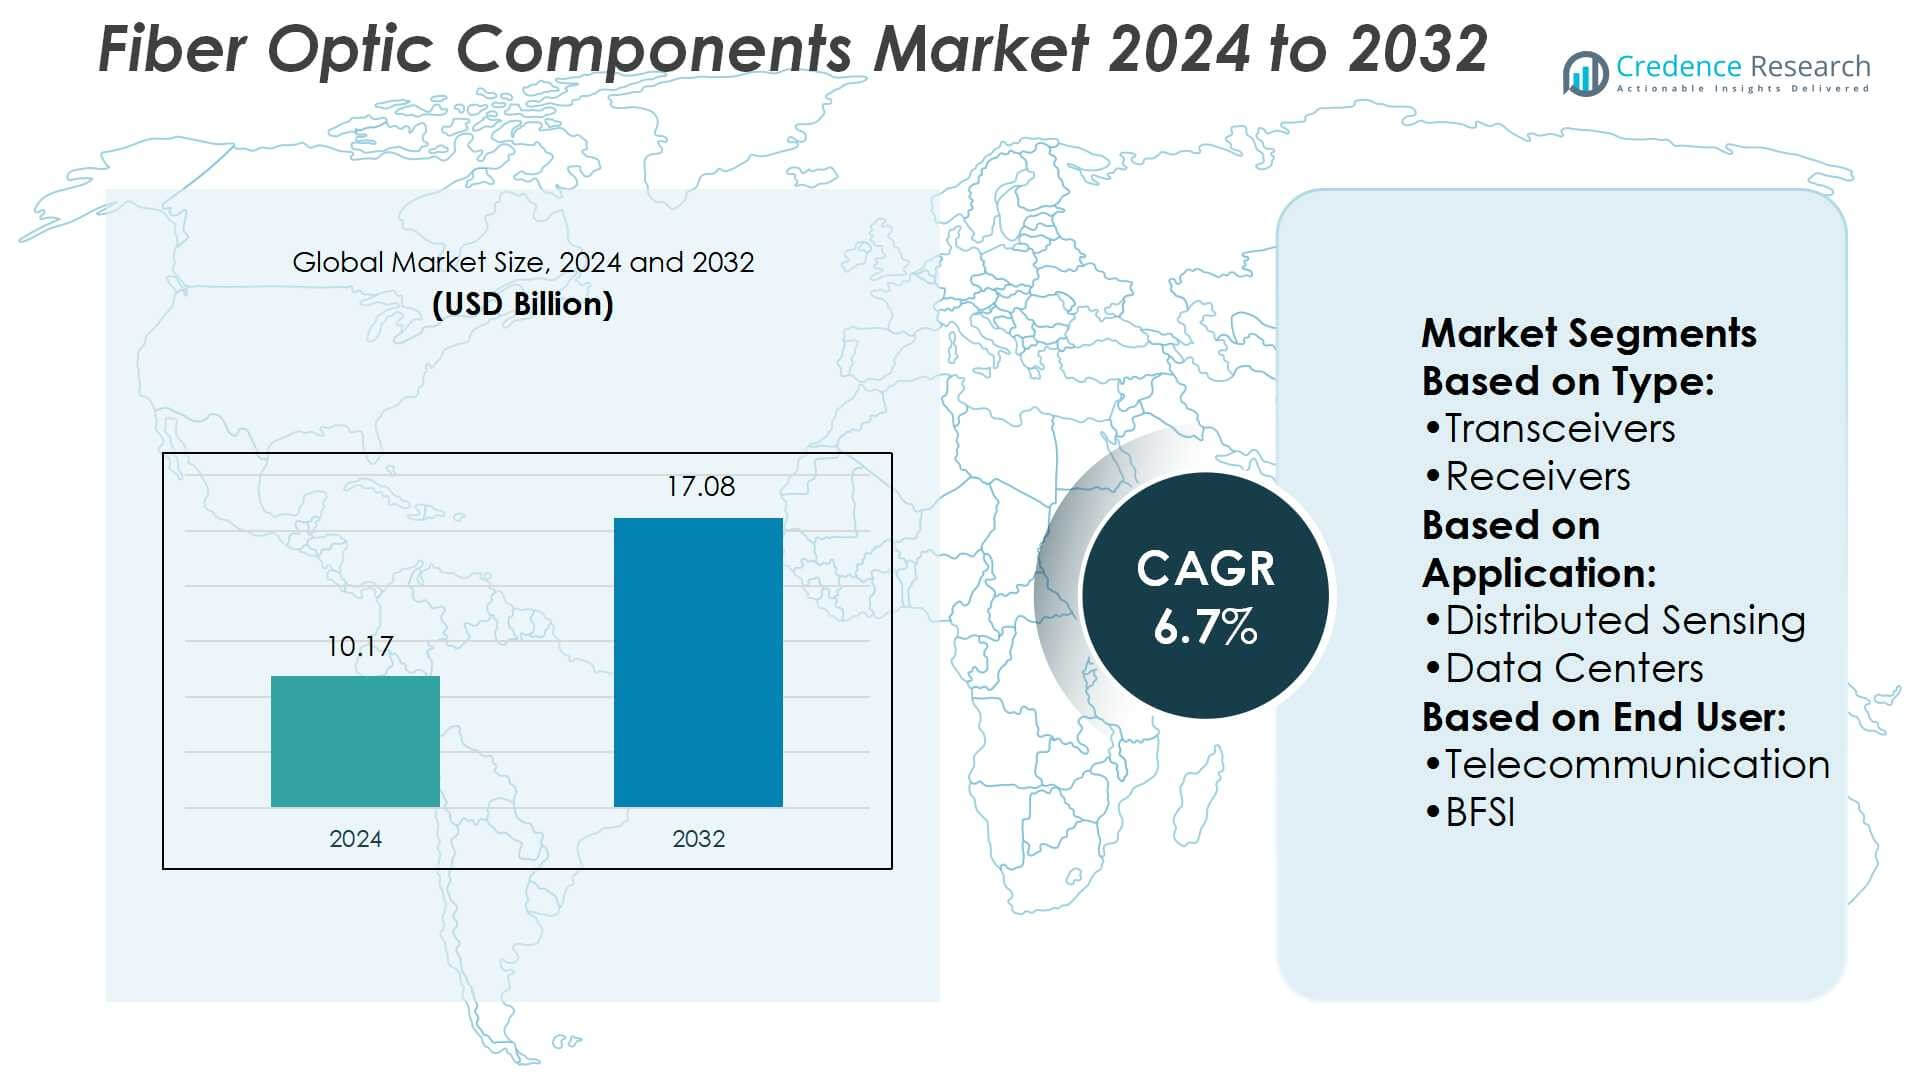
Fiber Optic Components Market size was valued USD 10.17 billion in 2024 and is anticipated to reach USD 17.08 billion by 2032, at a CAGR of 6.7% during the forecast period.
| REPORT ATTRIBUTE |
DETAILS |
| Historical Period |
2020-2023 |
| Base Year |
2024 |
| Forecast Period |
2025-2032 |
| Fiber Optic Components Market Size 2024 |
USD 10.17 Billion |
| Fiber Optic Components Market, CAGR |
6.7% |
| Fiber Optic Components Market Size 2032 |
USD 17.08 Billion |
The fiber optic components market is shaped by major players such as Broadex Technologies, Cisco Systems, 3M, Corning, Ciena, Fujikura, Broadcom, Amphenol, Accelink Technologies, and CommScope, each contributing through innovation, product diversification, and global supply networks. These companies compete by advancing high-speed transceivers, durable cables, and energy-efficient connectors to meet rising demand from data centers, telecommunications, and industrial sectors. Asia-Pacific leads the global market with a 34% share, driven by large-scale 5G deployment, rapid digitalization, and significant investments in cloud infrastructure. This regional dominance highlights its critical role in shaping future market growth.
Access crucial information at unmatched prices!
Request your sample report today & start making informed decisions powered by Credence Research Inc.!
Download Sample
Market Insights
- The fiber optic components market was valued at USD 10.17 billion in 2024 and is projected to reach USD 17.08 billion by 2032, growing at a CAGR of 6.7%.
- Rising demand for high-speed internet, 5G deployment, and cloud expansion are major drivers boosting adoption across telecom, data centers, and industrial applications.
- Key trends include growing use of 400G and 800G transceivers, sustainability-focused fiber solutions, and integration of fiber optics in healthcare, aerospace, and distributed sensing applications.
- Intense competition among players such as Broadcom, Cisco, Corning, and Ciena emphasizes innovation in product performance, but high initial deployment costs and complex integration with legacy systems act as market restraints.
- Asia-Pacific leads with a 34% share due to large-scale digitalization and 5G investments, while North America holds 29% driven by advanced data centers; transceivers remain the largest segment with 34% share, reflecting their central role in high-capacity networks.
 Market Segmentation Analysis:
By Type
In the fiber optic components market, transceivers hold the dominant share at 34%. Their leadership stems from rising adoption in data centers, 5G deployments, and cloud computing networks that require high-speed data transmission. Transceivers enable efficient bidirectional communication and support bandwidth-heavy applications, making them critical to modern infrastructure. Continuous innovation in compact designs and higher data rates, such as 400G and 800G modules, strengthens their position. Other types, including cables, connectors, and amplifiers, remain essential but primarily serve as complementary components to transceivers’ growing demand.
- For instance, Broadex Technologies is sampling 400G QSFP-DD DR4 transceivers in both 500 m and 2 km variants based on a silicon-photonic platform using 7 nm DSP chips, achieving a bit error rate of 10⁻⁹ without forward error correction and a TDECQ as low as 0.6 dB.
By Application
Data centers represent the largest application segment, accounting for 38% of the market share. The surge in cloud services, IoT devices, and AI-driven workloads is driving strong demand for high-capacity, low-latency optical connections. Fiber optic components in this sector support rapid data transfer and energy-efficient operations across hyperscale facilities. Investments in colocation services and green data centers are further propelling adoption. While FTTX and distributed sensing are gaining traction, the concentration of global digital activity in data centers keeps this sub-segment ahead.
- For instance, The Cisco Systems’ 400G Digital Coherent QSFP-DD optical module can transmit a single 400G wavelength up to 120 km in point-to-point links under the ZR specification, typically with the use of optical amplification.
By End-User
The telecommunication industry leads with a 41% market share, driven by 5G rollouts, broadband expansion, and rising video streaming needs. Operators rely heavily on fiber optic components to deliver high-speed, reliable connectivity across urban and rural networks. Government initiatives promoting digital infrastructure and private investments in fiber-to-the-home projects continue to accelerate uptake. The segment’s growth also reflects the demand for network upgrades to support cloud, IoT, and edge computing. Other industries like healthcare, aerospace, and BFSI contribute steadily but remain secondary to telecom dominance.
Key Growth Drivers
Rising Demand for High-Speed Internet and 5G Deployment
The rapid expansion of high-speed internet and global 5G rollouts drives strong demand for fiber optic components. Network operators require transceivers, cables, and connectors to handle growing data volumes with low latency. Fiber optics offer unmatched bandwidth and reliability, essential for supporting mobile networks, IoT ecosystems, and real-time applications. Telecom providers and governments are heavily investing in fiber-to-the-home (FTTH) and fiber-to-the-x (FTTX) projects, reinforcing market growth. This surge in digital connectivity is solidifying fiber optics as the backbone of next-generation communication networks.
- For instance, Corning’s SMF-28® Ultra optical fiber offers high performance, including industry-leading low attenuation. The Corning SMF-28® ULL (Ultra-Low-Loss) fiber, a variant specifically designed for long-haul and high-data-rate networks, can achieve a typical attenuation as low as 0.16 dB/km at 1550 nm.
Data Center Expansion and Cloud Services Growth
The growing reliance on cloud computing, AI, and big data analytics is fueling the need for advanced fiber optic components in data centers. Hyperscale operators prioritize fiber for its ability to support massive data transfer and energy efficiency. Rising demand for colocation services and edge data centers further amplifies the requirement for high-speed transceivers and amplifiers. With companies digitizing operations and adopting hybrid cloud models, the data center industry continues to expand globally. This expansion creates sustained opportunities for fiber optic component manufacturers.
- For instance, Ciena’s WL6e uses state-of-the-art 3nm silicon to drive significant economic benefits for operators, including a 50% reduction in space and power per bit.
Advancements in Optical Technologies and Integration
Continuous innovation in optical technologies significantly drives market growth. Developments such as compact 400G and 800G transceivers, wavelength division multiplexing (WDM), and integration of photonics into silicon platforms enhance performance. These innovations enable higher bandwidth, reduced power consumption, and improved cost efficiency for service providers and enterprises. The integration of fiber optics into medical imaging, industrial sensing, and aerospace systems also widens application scope. By offering scalable and efficient solutions, technological advancements are ensuring long-term adoption of fiber optic components across multiple industries.
Key Trends & Opportunities
Adoption of Green and Energy-Efficient Fiber Solutions
Sustainability has become a key trend, with rising adoption of energy-efficient fiber optic components in data centers and telecom networks. Green fiber solutions reduce power consumption and optimize cooling, addressing both cost and environmental concerns. Growing regulatory emphasis on eco-friendly infrastructure and the push for net-zero emissions amplify this shift. Companies offering low-carbon and recyclable fiber solutions stand to gain a competitive advantage. This trend positions fiber optics not only as a high-performance technology but also as a sustainable backbone for global digital infrastructure.
- For instance, Fujikura’s “Green PLUS” product line includes a small-diameter, high-density optical fiber cable whose fiber count is packaged using 200 µm diameter fibers instead of the conventional 250 µm, increasing fiber count per cross-section.
Integration of Fiber Optics in Emerging Applications
Opportunities are expanding as fiber optics find increasing use beyond telecom and data centers. Industries such as healthcare employ fiber optics in medical imaging and surgical equipment, while aerospace and defense utilize them for secure, high-speed communications. Distributed sensing using fiber optics is also gaining traction in oil and gas and smart infrastructure monitoring. These applications create new revenue streams for component suppliers. By diversifying into specialized verticals, companies can reduce dependence on telecom and data centers while capturing emerging market growth.
- For instance, Broadcom’s the Gen 3 CPO technology increases the optical line rate to 200G per lane. CPO is the process of integrating optical engines with the switch ASIC onto a single package, improving performance and energy efficiency.
Key Challenges
High Initial Investment and Deployment Costs
One of the major challenges in the fiber optic components market is the high cost of deployment. Building extensive fiber networks requires significant capital for installation, infrastructure upgrades, and skilled labor. For many regions, particularly developing economies, these costs slow adoption and limit large-scale rollouts. Service providers often face difficulties in justifying upfront investments despite long-term benefits. This challenge creates barriers to entry for smaller operators and delays market expansion, especially in areas with lower population density or difficult terrains.
Complexities in Network Integration and Maintenance
The integration of fiber optic components into existing networks presents technical complexities. Legacy infrastructure often requires costly upgrades, and maintaining compatibility with diverse systems is challenging. Additionally, fiber optic cables are sensitive to physical damage and require careful handling during installation and operation. These challenges increase the need for skilled technicians and specialized tools, raising operational costs. Network operators must also address maintenance and repair issues quickly to avoid service disruptions. Such complexities slow down deployments and hinder smooth scalability of fiber-based systems.
Regional Analysis
North America
North America holds a 29% share of the fiber optic components market, driven by advanced telecom infrastructure and rapid 5G deployment. The U.S. leads adoption, supported by investments from major telecom operators and cloud service providers. Rising data traffic from video streaming, IoT, and enterprise digitalization strengthens demand. Data center expansions in regions like Virginia and Texas further push uptake of high-speed transceivers and cables. Canada also contributes through national broadband projects targeting rural connectivity. Strong R&D activity and early adoption of advanced optical technologies keep North America a key revenue contributor.
Europe
Europe accounts for 23% of the global market, with growth supported by extensive fiber-to-the-home (FTTH) rollouts and digital transformation initiatives. Countries like Germany, France, and the U.K. drive adoption through government-backed broadband expansion projects. Rising demand for secure, high-speed connectivity in BFSI and healthcare industries supports steady growth. Data centers across the region increasingly rely on fiber components to meet growing cloud computing and AI requirements. Strong emphasis on sustainability encourages adoption of energy-efficient fiber solutions. Europe’s position is reinforced by established telecom vendors and a clear regulatory framework promoting digital infrastructure.
Asia-Pacific
Asia-Pacific dominates the fiber optic components market with a 34% share, supported by large-scale infrastructure development and rising internet penetration. China leads the region with massive investments in 5G networks, smart cities, and hyperscale data centers. India’s digital initiatives and Japan’s technological advancements further accelerate adoption. Expanding demand for cloud services and increasing industrial automation boost component usage across diverse sectors. Regional growth is also supported by manufacturing hubs that drive cost efficiency and innovation. Asia-Pacific remains the fastest-growing region due to strong government support, population-driven demand, and continuous expansion of digital ecosystems.
Latin America
Latin America holds a 7% share of the fiber optic components market, with growth concentrated in Brazil and Mexico. Expanding broadband penetration and rising smartphone usage drive strong demand for high-speed networks. Governments are actively investing in telecom infrastructure upgrades, particularly fiber-to-the-home (FTTH) projects in urban areas. Cloud adoption and the emergence of local data centers further support component deployment. However, limited capital investments and uneven infrastructure development across rural areas restrain faster adoption. Despite these challenges, the region presents opportunities as operators focus on bridging connectivity gaps and strengthening digital economies.
Middle East & Africa
The Middle East & Africa region accounts for 7% of the market, supported by digital transformation programs and rapid urbanization. Gulf countries, led by the UAE and Saudi Arabia, are investing heavily in 5G networks, smart cities, and data centers. Africa’s growth is driven by expanding mobile penetration and government-backed fiber deployment projects aimed at improving connectivity. Rising demand from banking and industrial sectors is also contributing to adoption. Despite infrastructure and cost challenges, ongoing initiatives to modernize networks and strengthen cloud ecosystems ensure steady growth potential for fiber optic components in the region.
Market Segmentations:
By Type:
By Application:
- Distributed Sensing
- Data Centers
By End User:
By Geography
- North America
- Europe
- UK
- France
- Germany
- Italy
- Spain
- Russia
- Rest of Europe
- Asia Pacific
- China
- Japan
- South Korea
- India
- Australia
- Southeast Asia
- Rest of Asia Pacific
- Latin America
- Brazil
- Argentina
- Rest of Latin America
- Middle East
- GCC Countries
- Israel
- Turkey
- Rest of Middle East
- Africa
- South Africa
- Egypt
- Rest of Africa
Competitive Landscape
The fiber optic components market players including Broadex Technologies, Cisco Systems, 3M, Corning, Ciena, Fujikura, Broadcom, Amphenol, Accelink Technologies, and CommScope. The fiber optic components market is highly competitive, driven by rapid technological advancements and growing demand across telecommunications, data centers, and industrial applications. Companies are focusing on expanding product portfolios, enhancing high-speed transceivers, and developing energy-efficient solutions to meet rising bandwidth needs. Strategic partnerships, mergers, and acquisitions are common as firms aim to strengthen their global presence and capture emerging opportunities in 5G deployment, cloud services, and smart infrastructure. Sustainability initiatives and investments in research and development remain key competitive strategies, ensuring continuous innovation and long-term market relevance in a fast-evolving digital landscape.
Shape Your Report to Specific Countries or Regions & Enjoy 30% Off!
Key Player Analysis
- Broadex Technologies
- Cisco Systems
- 3M
- Corning
- Ciena
- Fujikura
- Broadcom
- Amphenol
- Accelink Technologies
- CommScope
Recent Developments
- In June 2025, TE Connectivity Unveils MULTIGIG Transceiver Platform for Improved Data Transmission. This highly modular solution offers design engineers in aerospace, defense and marine applications more flexibility to place fiber optic transceivers for optimal performance.
- In April 2025, Lumentum introduced new 400/800G ZR+ pluggable transceivers, specifically in the L-band, which will double the capacity of existing fiber infrastructure for data center interconnect, metro, and long-haul networks.
- In September 2024, Focuslight Technologies announced the successful acquisition of Ams OSRAM AG’s optical components. These businesses include the acquisition of research and development, production and intellectual property assets related to Ams OSRAM’s facilities in Singapore and Switzerland.
- In January 2024, PI expanded its range of mechanical alignment systems to enhance the support for quality assurance, assembly, and packaging of Silicon Photonics (SiPh) chips. The company also showcased new solutions, such as air-bearing stages and entry-level systems.
- In January 2024, Nokia collaborated with Zayo, and set a new North American record for an 800Gb/s speed transmission over 1866 km using a single wavelength on a live network, utilizing the company’s sixth-generation Photonic Service Engine super-coherent optics.
Report Coverage
The research report offers an in-depth analysis based on Type, Application, End-User and Geography. It details leading market players, providing an overview of their business, product offerings, investments, revenue streams, and key applications. Additionally, the report includes insights into the competitive environment, SWOT analysis, current market trends, as well as the primary drivers and constraints. Furthermore, it discusses various factors that have driven market expansion in recent years. The report also explores market dynamics, regulatory scenarios, and technological advancements that are shaping the industry. It assesses the impact of external factors and global economic changes on market growth. Lastly, it provides strategic recommendations for new entrants and established companies to navigate the complexities of the market.
Future Outlook
- The market will expand with the growing adoption of 5G networks worldwide.
- Rising demand for cloud services will drive investments in high-speed optical components.
- Data centers will continue to dominate demand for transceivers and cables.
- Fiber-to-the-home projects will accelerate adoption in urban and rural areas.
- Advanced transceivers supporting 400G and 800G speeds will gain wider deployment.
- Sustainability initiatives will increase demand for energy-efficient fiber optic solutions.
- Healthcare and aerospace applications will create new growth opportunities.
- Distributed sensing will expand usage in oil, gas, and infrastructure monitoring.
- Strategic alliances and mergers will reshape the competitive landscape.
- Asia-Pacific will remain the fastest-growing region with strong infrastructure investments.


