Market Overview
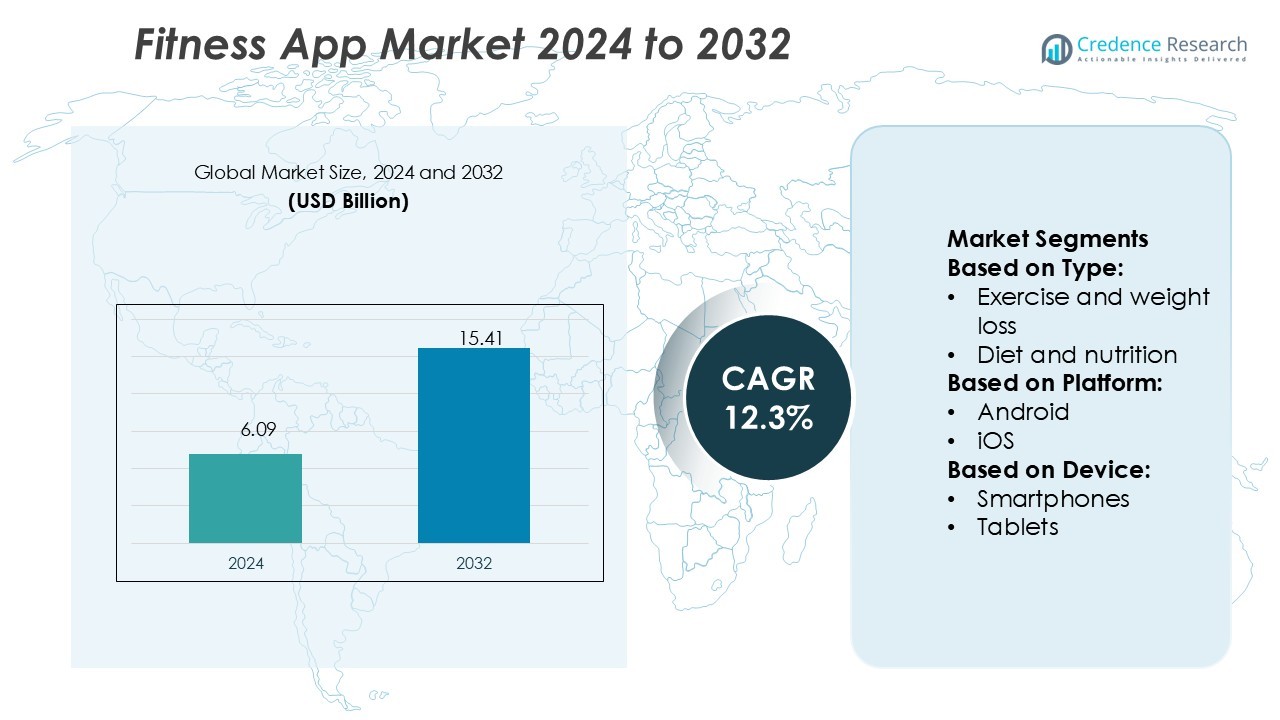
Fitness App Market size was valued USD 6.09 billion in 2024 and is anticipated to reach USD 15.41 billion by 2032, at a CAGR of 12.3% during the forecast period.
| REPORT ATTRIBUTE |
DETAILS |
| Historical Period |
2020-2023 |
| Base Year |
2024 |
| Forecast Period |
2025-2032 |
| Fitness App Market Size 2024 |
USD 6.09 Billion |
| Fitness App Market, CAGR |
12.3% |
| Fitness App Market Size 2032 |
USD 15.41 Billion |
The fitness app market is highly competitive, with top players including Nike, Inc., Fitbit, Inc., Peloton Interactive, Inc., MyFitnessPal, Inc., Noom, Inc., Freeletics GmbH, Azumio Inc., Maple Media LLC, Polar Electro, and Pear Health Labs, Inc. These companies strengthen their positions through innovation in AI-driven personalization, wearable integration, and hybrid fitness offerings. North America emerges as the leading region, capturing 38% of the global market share, driven by high smartphone penetration, advanced digital infrastructure, and strong consumer demand for preventive healthcare and subscription-based fitness solutions.
Access crucial information at unmatched prices!
Request your sample report today & start making informed decisions powered by Credence Research Inc.!
Download Sample
Market Insights
- The fitness app market size was valued at USD 6.09 billion in 2024 and is projected to reach USD 15.41 billion by 2032, growing at a CAGR of 12.3% during the forecast period.
- Rising health awareness, increasing prevalence of lifestyle diseases, and adoption of AI-driven personalized coaching remain the key market drivers boosting user engagement and subscription growth.
- A major trend is the integration of wearable devices with apps, enabling real-time health tracking, hybrid fitness models, and expansion into corporate wellness programs, driving long-term opportunities.
- Market restraints include data privacy and security concerns along with high competition from free and freemium models, which challenge user retention and profitability for premium service providers.
- North America leads with 38% market share, while smartphones dominate the device segment with 65%, supported by affordability and widespread adoption, positioning the region and segment as key growth contributors.
Market Segmentation Analysis:
By Type
The exercise and weight loss segment holds the dominant share of the fitness app market with over 40%. This dominance stems from the rising demand for guided workouts, personalized training plans, and weight management tools. Increasing obesity rates and growing health awareness further accelerate adoption. The integration of AI-driven coaching, real-time performance tracking, and gamification features strengthens user engagement. These apps often offer subscription-based premium content, driving revenue growth. The market benefits from fitness influencers and online communities, which encourage users to stay active and track progress through structured digital platforms.
- For instance, Nike, Inc. offers the Nike Training Club (NTC) app, which provides a growing library of over 200 free, on-demand workouts and personalized training plans from world-class trainers and athletes.
By Platform
Android leads the market with a share of 55%, supported by its vast global user base and affordability. The dominance of Android arises from widespread adoption in emerging economies such as India, Brazil, and Southeast Asia. Availability of cost-effective smartphones and diverse app ecosystems strengthens its position. Developers prioritize Android due to flexible distribution channels and integration with multiple wearable devices. Meanwhile, iOS captures a premium segment, driven by strong health-focused hardware integration and loyal customer adoption. Other platforms hold a minor share, often limited by compatibility challenges and restricted app availability.
- For instance, Beachbody Shakeology Chocolate Vegan shake, one serving (40g), delivers 16g of protein per serving from a plant-based blend that includes pea, flax, rice, and quinoa. The Chocolate Vegan formula also provides 6g of dietary fiber per serving.
By Device
Smartphones dominate the device segment with a market share of 65%, fueled by their ubiquity and portability. Consumers prefer smartphones for real-time tracking, access to video tutorials, and personalized reminders. Growing reliance on app-based subscription models further strengthens smartphone usage. Wearable devices such as smartwatches and fitness bands are witnessing rapid growth, driven by demand for continuous health monitoring and biometric tracking. Tablets occupy a smaller share, largely limited to guided sessions and larger screen experiences. Overall, device choice is shaped by convenience, affordability, and integration with health ecosystems.
Key Growth Drivers
Rising Health Awareness and Lifestyle Diseases
The fitness app market is fueled by increasing health awareness and the growing burden of lifestyle diseases. Consumers are actively seeking digital solutions for weight management, chronic disease prevention, and healthier living. The rising incidence of obesity, diabetes, and cardiovascular conditions has amplified demand for guided exercise and diet management apps. Governments and healthcare organizations also promote preventive care, encouraging fitness adoption. This shift in consumer priorities positions fitness apps as essential tools for maintaining long-term health and wellness across both developed and emerging markets.
- For instance, Glanbia Nutritionals developed OptiSol® 1007, a heat-stable whey protein concentrate designed to solve the thermal instability that often occurs in neutral-pH beverages. The product’s stability aids in decreasing sedimentation and prevents age-related gelation.
Integration of AI and Personalization
Artificial intelligence has become a critical driver of fitness app growth, enabling personalized recommendations and advanced analytics. Features such as AI-driven workout guidance, adaptive nutrition plans, and predictive health insights enhance user engagement. Apps now use machine learning to analyze user performance data, offering customized progress reports and motivational nudges. Personalization increases user satisfaction and reduces churn, strengthening subscription-based models. This capability differentiates platforms in a highly competitive market, as consumers increasingly value tailored solutions that align with their fitness levels, goals, and lifestyle patterns.
- For instance, NutriSport Pharmacal has delivered contract manufacturing services since 1997 in the US, with its facility being FDA-inspected and cGMP / Part 111 compliant, verified by third-party audits (e.g. NSF, Natural Product Association).
Wearable Device Adoption and Ecosystem Expansion
The rapid adoption of wearable devices such as smartwatches and fitness bands is driving market expansion. Seamless integration between wearables and apps allows real-time monitoring of steps, calories, heart rate, and sleep patterns. These insights encourage users to engage consistently with fitness platforms. The growing ecosystem of connected health devices, including smart scales and IoT-enabled gym equipment, further enhances value. Partnerships between app developers and hardware manufacturers strengthen customer loyalty. As wearables become mainstream, their role in providing holistic fitness tracking will significantly boost demand for app-based health solutions.
Key Trends & Opportunities
Shift Toward Hybrid Fitness Models
A prominent trend is the rise of hybrid fitness models, blending in-person and virtual training experiences. Fitness apps increasingly offer live-streamed classes, on-demand workouts, and integration with gym memberships. This model caters to consumers who prefer flexibility, allowing them to switch between home and studio sessions. Opportunities lie in expanding subscription offerings, enabling users to access both digital and offline services. As hybrid fitness evolves, apps that provide seamless scheduling, tracking, and performance insights across channels will gain a strong competitive advantage.
- For instance, Ajinomoto published the ANPS-Meal system,The study evaluated 1,816 meals to test and validate the new model.The ANPS-Meal system scores are based on four key components: protein and vegetables (for encouraged intake) and saturated fatty acids and sodium (for limited intake).
Expansion into Corporate Wellness Programs
Fitness apps are entering corporate wellness as organizations prioritize employee health and productivity. Companies increasingly invest in digital wellness solutions that provide fitness tracking, stress management, and lifestyle coaching. Fitness apps integrated with corporate health programs create opportunities for bulk subscriptions and long-term contracts. This expansion helps employers reduce healthcare costs while improving workplace well-being. Vendors offering customization, gamified challenges, and real-time reporting for enterprises are expected to capture significant demand in this growing niche, strengthening recurring revenue streams for fitness app providers.
- For instance, Abbott’s Medical Devices segment generated approximately US 19 billion in sales, representing around 45% of Abbott’s total revenue. The company reported that the Medical Devices segment has had a strong run of organic sales growth.
Key Challenges
Data Privacy and Security Concerns
The fitness app market faces major challenges around data privacy and user trust. Apps collect sensitive health information, including biometrics, location data, and lifestyle patterns. Breaches or misuse of such data can undermine consumer confidence and invite regulatory scrutiny. With stricter global data protection laws like GDPR and HIPAA, compliance becomes critical. Ensuring secure data storage, encryption, and transparent privacy policies is essential. Companies failing to address these issues risk reputational damage and customer loss, making data security a top barrier to sustainable growth.
High Market Competition and User Retention
The market is highly competitive, with numerous free and paid apps vying for consumer attention. User retention remains a challenge as customers often switch between platforms due to cost, functionality, or novelty fatigue. Free apps offering similar features further pressure paid subscription models. Maintaining engagement requires continuous innovation, regular feature updates, and strong community support. High marketing costs to acquire and retain users also limit profitability for smaller players. Companies must focus on differentiation through unique value propositions to sustain long-term growth.
Regional Analysis
North America
North America leads the fitness app market with a 38% share, driven by high smartphone penetration, widespread wearable adoption, and strong consumer awareness of preventive healthcare. The U.S. accounts for the largest revenue contribution, supported by well-developed digital infrastructure and high spending on fitness services. Corporate wellness initiatives, coupled with rising demand for personalized training solutions, further strengthen market expansion. Leading companies like Fitbit, Apple, and MyFitnessPal dominate through innovation and robust subscription models. Increasing health concerns such as obesity and diabetes continue to push users toward digital fitness platforms, ensuring sustained regional dominance.
Europe
Europe holds a 27% market share, supported by growing health awareness, aging populations, and expanding government-backed wellness programs. Countries such as Germany, the UK, and France lead adoption, with consumers favoring apps that integrate nutrition, exercise, and mental health. Rising gym memberships paired with hybrid fitness models drive demand for multi-functional applications. The region benefits from strong regulatory frameworks ensuring data security, which improves consumer trust. Strategic collaborations between app developers and healthcare providers enhance engagement. Wearable device usage is also accelerating, further fueling adoption of fitness apps as part of a broader digital health ecosystem.
Asia-Pacific
Asia-Pacific commands a 22% share and represents the fastest-growing region in the fitness app market. Rapid smartphone adoption, low-cost internet, and increasing health awareness in emerging economies such as India, China, and Indonesia drive growth. Urbanization and sedentary lifestyles have spurred higher interest in weight management and digital wellness platforms. Local startups and global players expand aggressively with affordable subscription models and localized content. Integration with popular wearables like Xiaomi and Huawei strengthens adoption. Rising disposable income and government promotion of fitness initiatives contribute to making Asia-Pacific a highly lucrative market with strong future potential.
Latin America
Latin America accounts for an 8% share of the global fitness app market, supported by increasing smartphone penetration and growing interest in health and wellness. Brazil and Mexico lead adoption, with rising fitness-conscious youth populations driving downloads. Economic constraints limit premium subscriptions, but free and freemium models maintain strong traction. Social media influencers and online fitness communities significantly boost app engagement. Partnerships with gyms and fitness trainers expand hybrid model adoption. While challenges like inconsistent internet access persist in rural areas, urban populations provide a steady demand base for fitness tracking and exercise apps.
Middle East & Africa
The Middle East & Africa region captures a 5% market share, with growth supported by increasing digitalization and rising awareness of lifestyle-related diseases. Gulf countries such as the UAE and Saudi Arabia drive regional demand, driven by government-backed fitness campaigns and high smartphone penetration. South Africa also emerges as a key market due to growing adoption of affordable fitness solutions. Wearable usage is expanding, especially among young urban professionals. However, price sensitivity and limited access in remote areas pose barriers. Despite challenges, rising health consciousness and digital innovation create opportunities for fitness app expansion across the region.
Market Segmentations:
By Type:
- Exercise and weight loss
- Diet and nutrition
By Platform:
By Device:
By Geography
- North America
- Europe
- Germany
- France
- U.K.
- Italy
- Spain
- Rest of Europe
- Asia Pacific
- China
- Japan
- India
- South Korea
- South-east Asia
- Rest of Asia Pacific
- Latin America
- Brazil
- Argentina
- Rest of Latin America
- Middle East & Africa
- GCC Countries
- South Africa
- Rest of the Middle East and Africa
Competitive Landscape
The competitive landscape of the fitness app market features key players such as Maple Media LLC, Nike, Inc., MyFitnessPal, Inc., Azumio Inc., Peloton Interactive, Inc., Noom, Inc., Fitbit, Inc., Freeletics GmbH, Pear Health Labs, Inc., and Polar Electro. The fitness app market is defined by rapid innovation, evolving user preferences, and the integration of advanced technologies. Companies focus on expanding subscription models, introducing AI-driven personalization, and enhancing connectivity with wearable devices to differentiate their offerings. Partnerships with healthcare providers, gyms, and corporate wellness programs are becoming common strategies to broaden customer bases and strengthen engagement. Competition is also shaped by the balance between free, freemium, and premium models, with user retention and long-term loyalty emerging as key challenges. Continuous updates, hybrid fitness options, and data-driven insights remain critical factors driving success.
Shape Your Report to Specific Countries or Regions & Enjoy 30% Off!
Key Player Analysis
- Maple Media LLC
- Nike, Inc.
- MyFitnessPal, Inc.
- Azumio Inc.
- Peloton Interactive, Inc.
- Noom, Inc.
- Fitbit, Inc.
- Freeletics GmbH
- Pear Health Labs, Inc.
- Polar Electro
Recent Developments
- In July 2025, PitPat and DeerRun launched an innovative fitness equipment series, including rowing machines and multifunctional treadmills, designed for seamless integration with PitPat’s global online competition platform, enabling users to participate in interactive events and track real-time performance data from anywhere.
- In June 2025, Peloton launched the Repowered resale marketplace for used bikes and treadmills, initially available in New York City, Boston, and Washington D.C., with nationwide expansion planned. According to the brand, the platform offers AI-assisted pricing, 70% seller revenue share, and reduced activation fees for buyers, addressing the 16% year-over-year growth in members purchasing used equipment.
- In April 2025, Interactive Strength Inc. signed a binding agreement to acquire Wattbike, a leading indoor performance training bike brand, in a deal expected to enhance growth in the United States, Germany, and the United Kingdom markets. According to the company, the acquisition is projected to close in Q2 2025 and be immediately accretive to financial results.
- In June 2024, Talkspace, a prominent online behavioral healthcare provider, partnered with FitOn, the leading fitness app and digital health & wellness platform. This collaboration aims to offer companies a comprehensive solution that integrates mental health and physical fitness, demonstrating the significance of combining these elements in daily life.
Report Coverage
The research report offers an in-depth analysis based on Type, Platform, Device and Geography. It details leading market players, providing an overview of their business, product offerings, investments, revenue streams, and key applications. Additionally, the report includes insights into the competitive environment, SWOT analysis, current market trends, as well as the primary drivers and constraints. Furthermore, it discusses various factors that have driven market expansion in recent years. The report also explores market dynamics, regulatory scenarios, and technological advancements that are shaping the industry. It assesses the impact of external factors and global economic changes on market growth. Lastly, it provides strategic recommendations for new entrants and established companies to navigate the complexities of the market.
Future Outlook
- The fitness app market will continue expanding with rising health and wellness awareness.
- Integration of AI and machine learning will improve personalization and user engagement.
- Wearable device adoption will accelerate, strengthening real-time health monitoring features.
- Hybrid fitness models will grow, combining digital platforms with in-person experiences.
- Corporate wellness programs will increasingly adopt fitness apps for employee health management.
- Data privacy and security measures will become central to sustaining user trust.
- Partnerships with healthcare providers will expand preventive care and remote monitoring solutions.
- Gamification and social community features will boost retention and user motivation.
- Emerging markets will drive growth with affordable smartphone access and localized apps.
- Continuous innovation in nutrition, activity tracking, and mental wellness will broaden market scope.


