Safety rules push routine flight data review beyond airlines
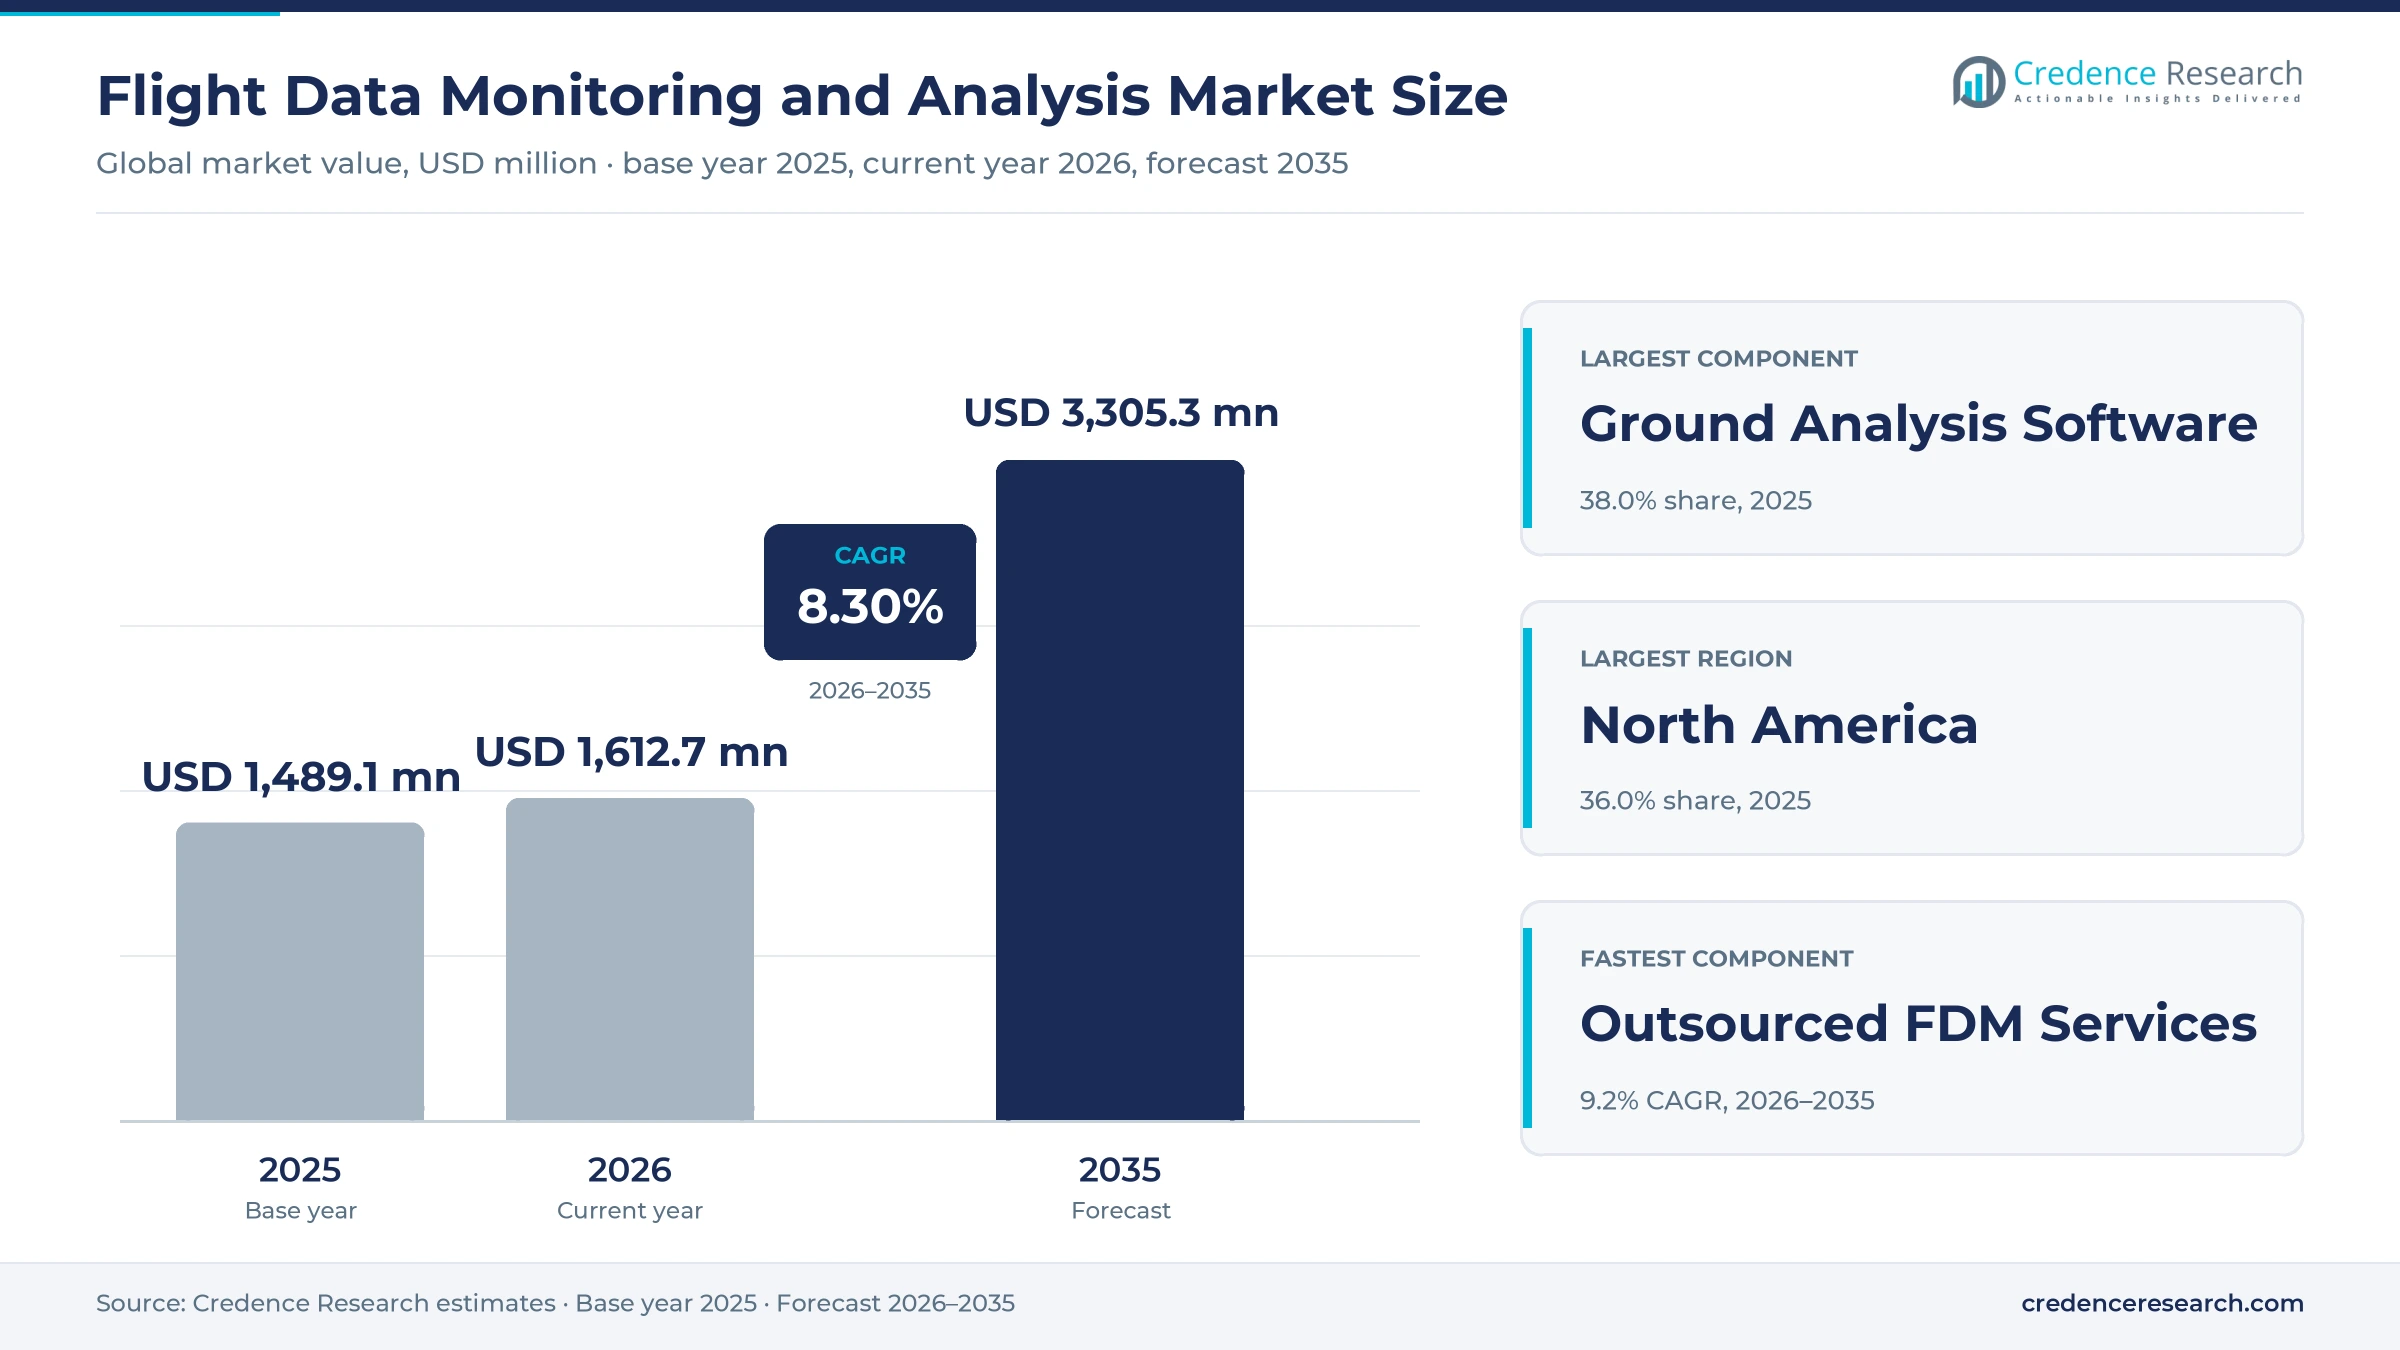
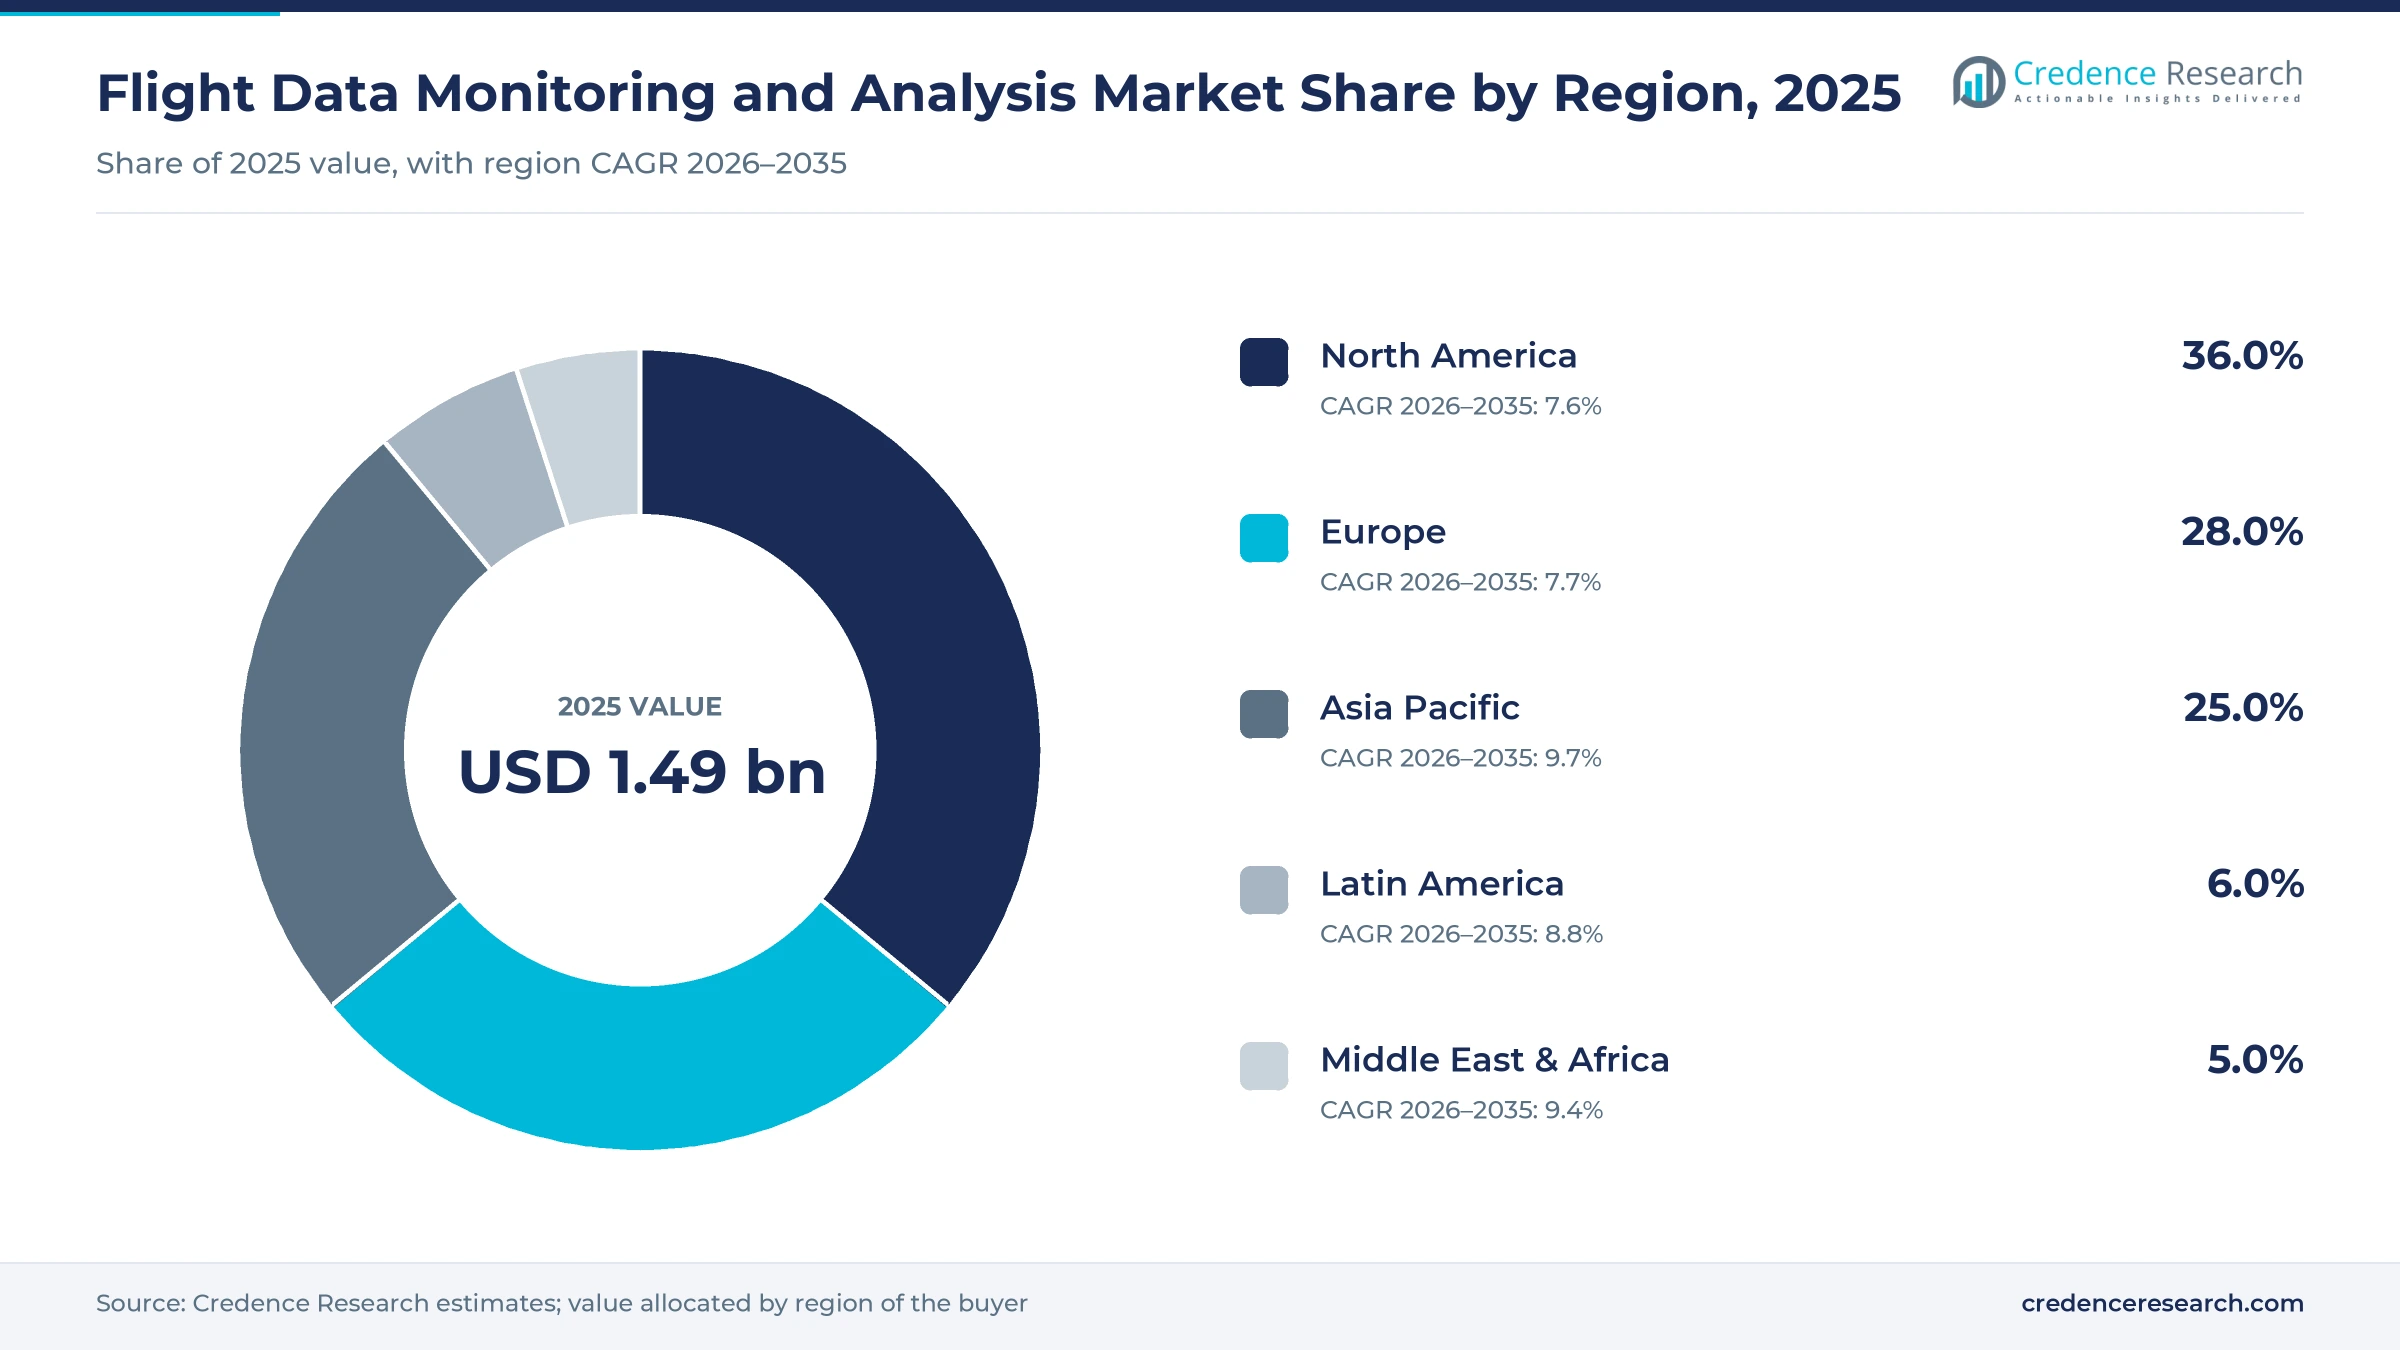
The global flight data monitoring and analysis market was valued at USD 1.49 billion in 2025 and is projected to increase from USD 1.61 billion in 2026 to USD 3.31 billion by 2035, registering a CAGR of 8.30% during 2026–2035. Demand comes from airlines, charter and business jet operators, helicopter operators and air forces that must review routine flight data to find unsafe trends before they cause accidents. North America held the largest regional share, 36.0% in 2025, because the FAA framework and large U.S. airline and business jet fleets created the deepest installed base of analysis programs. Asia Pacific is the fastest-growing region at 9.7% a year, as airlines there take delivery of new narrowbody fleets and adopt fleet-wide analysis contracts. The main commercial change is the spread of safety management rules to smaller operators, which turns flight data review from a large-airline practice into a requirement for charter and helicopter fleets as well.
Airlines buy event detection, not just recorded parameters
The market counts onboard data acquisition units and quick access recorders that capture flight parameters, the ground software that decodes those parameters and flags exceedances, and outsourced services in which a supplier runs the program for the operator. Airlines usually buy fleet-wide software licenses or multi-year service contracts priced per aircraft, while smaller operators buy bundled hardware and analysis subscriptions.
Crash-protected flight data recorders, cockpit voice recorders and rotorcraft health and usage monitoring systems are excluded unless they feed a monitoring program directly. Value sits increasingly in the event libraries, analyst support and pilot-facing applications, because recorded parameters have little worth until software turns them into trends that safety, training and maintenance teams can act on.
Flight Data Monitoring and Analysis Market Insights
- The global flight data monitoring and analysis market was valued at USD 1.49 billion in 2025 and is projected to reach USD 3.31 billion by 2035, growing at an 8.30% CAGR during 2026–2035.
- North America held 36.0% of 2025 value, supported by FAA safety management rules and large airline, charter and business jet fleets.
- Ground analysis software held 38.0% of 2025 value, because airlines license fleet-wide event detection platforms from a few suppliers.
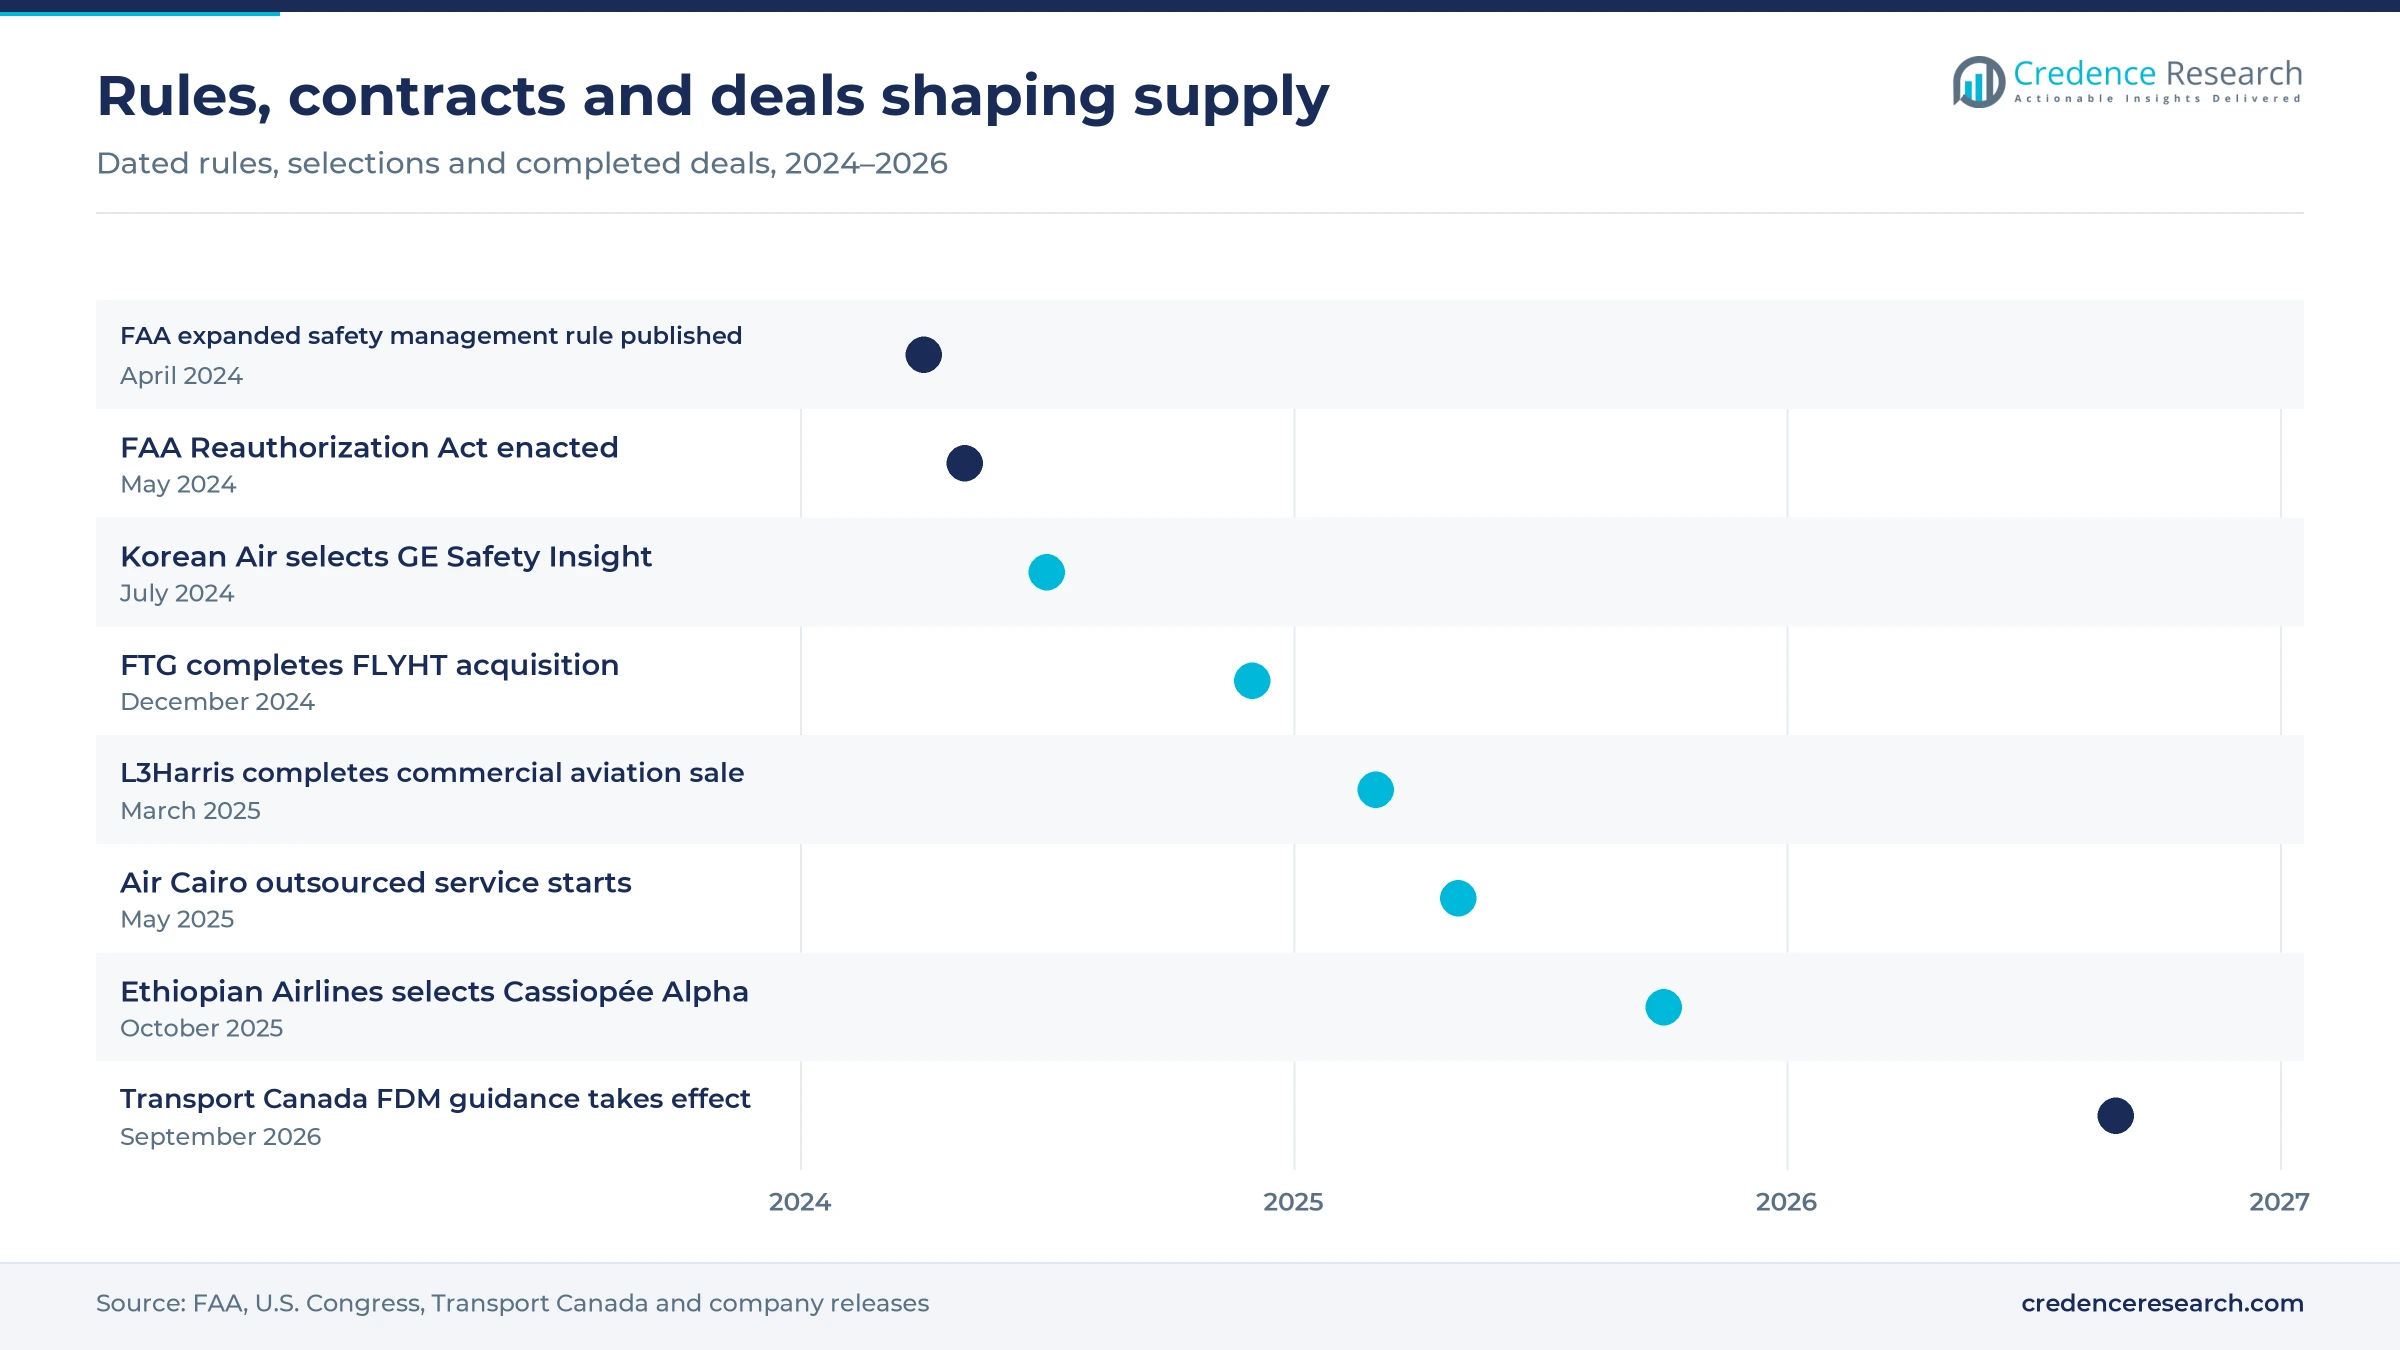
- The FAA published its expanded safety management rule on April 26, 2024, and Part 135 operators must declare compliance by May 28, 2027.
- GE Aerospace, Safran and Acron Aviation compete for fleet-wide airline contracts, with recent wins at flydubai, Ethiopian Airlines and Air Cairo.
Software leads spend while outsourced services grow fastest
Large aeroplanes lead while helicopters grow from a low base
Based on aircraft type, the market is categorized into fixed wing and rotary wing aircraft. Fixed Wing led with 81.0% of 2025 value because the ICAO standard, adopted in Europe under ORO.AOC.130, requires a monitoring program for commercial aeroplanes above 27,000 kg, which covers nearly every jet airliner. Rotary Wing grows fastest at 9.3% a year as programs spread from offshore helicopters, already covered by EASA rule SPA.HOFO.145, toward heavier helicopters that Transport Canada lists under an ICAO recommended practice above 7,000 kg. Rotary programs remain smaller per aircraft, so volume rather than price drives that growth.
Civil operators lead while air forces widen fleet coverage
Based on end use, the market is categorized into civil and military operators. Civil operators led with 73.0% of 2025 value because airlines buy fleet-wide programs, as Korean Air did in July 2024 when it selected GE Aerospace's Safety Insight system for its 159 aircraft and for its low-cost carrier Jin Air. Military programs grow fastest at 8.7% a year as air forces extend routine data review from a few fleets to whole inventories, and the U.S. Air Force program described in the drivers already spans 14 fleets without any mandate.
Software leads spend as outsourced programs gain airlines
Based on component, the market is categorized into onboard data acquisition hardware, ground analysis software and outsourced FDM services. Ground Analysis Software led with 38.0% of 2025 value because airlines license fleet-wide platforms, and Safran says its Cassiopée Alpha software is used by more than 150 airlines. Outsourced FDM Services grow fastest at 9.2% a year as carriers without large safety departments hand the whole program to a supplier, and Air Cairo moved its 36 ATR, Embraer and Airbus aircraft to a fully outsourced Acron Aviation service that started on May 1, 2025.
| Segment Group | Leading Sub-segment | Share, 2025 | Fastest-growing Sub-segment | CAGR, 2026–2035 |
|---|---|---|---|---|
| By Aircraft Type | Fixed Wing | 81.0% | Rotary Wing | 9.3% |
| By End Use | Civil | 73.0% | Military | 8.7% |
| By Component | Ground Analysis Software | 38.0% | Outsourced FDM Services | 9.2% |
Per-aircraft fees and hourly plans set program cost
Airline programs are priced per aircraft a year, either as a software license run by the airline's own analysts or as an outsourced service that includes analysts and reports. Wireless recorders are a one-time cost per aircraft, falling sharply when installed at the factory rather than retrofitted. Smaller operators increasingly pay by the flight hour, which turns hardware into a lease and lowers the entry barrier. Prices fall for large fleets and rise with added modules for pilots, fuel and maintenance, so bundled contracts protect supplier margins. Public airline contract prices are rarely disclosed, so the airline rows are Credence Research estimates.
| Offer or segment | Typical price or fee | Basis |
|---|---|---|
| Light aircraft FOQA hardware, self-installed | Under USD 1,999 fly-away cost per aircraft | AirSync list price, 2026 |
| Light aircraft FOQA plan with hardware lease | USD 2.50 per flight hour, about USD 167 a month at 800 hours | AirSync list price, 2026 |
| Airline ground analysis software license | USD 12,000 to 22,000 per aircraft a year | Credence Research estimate from fleet coverage and contract scope |
| Fully outsourced airline FDM service | USD 20,000 to 35,000 per aircraft a year | Credence Research estimate from service scope and analyst staffing |
| Wireless quick access recorder, retrofit | USD 15,000 to 30,000 per aircraft installed | Credence Research estimate from hardware and certification inputs |
Request a Free Sample
Fill in your details and we'll send you a free sample report.
- Sample data tables & charts
- Research methodology
New mandates and larger fleets widen FDM coverage
Safety management rules reach charter and air tour fleets
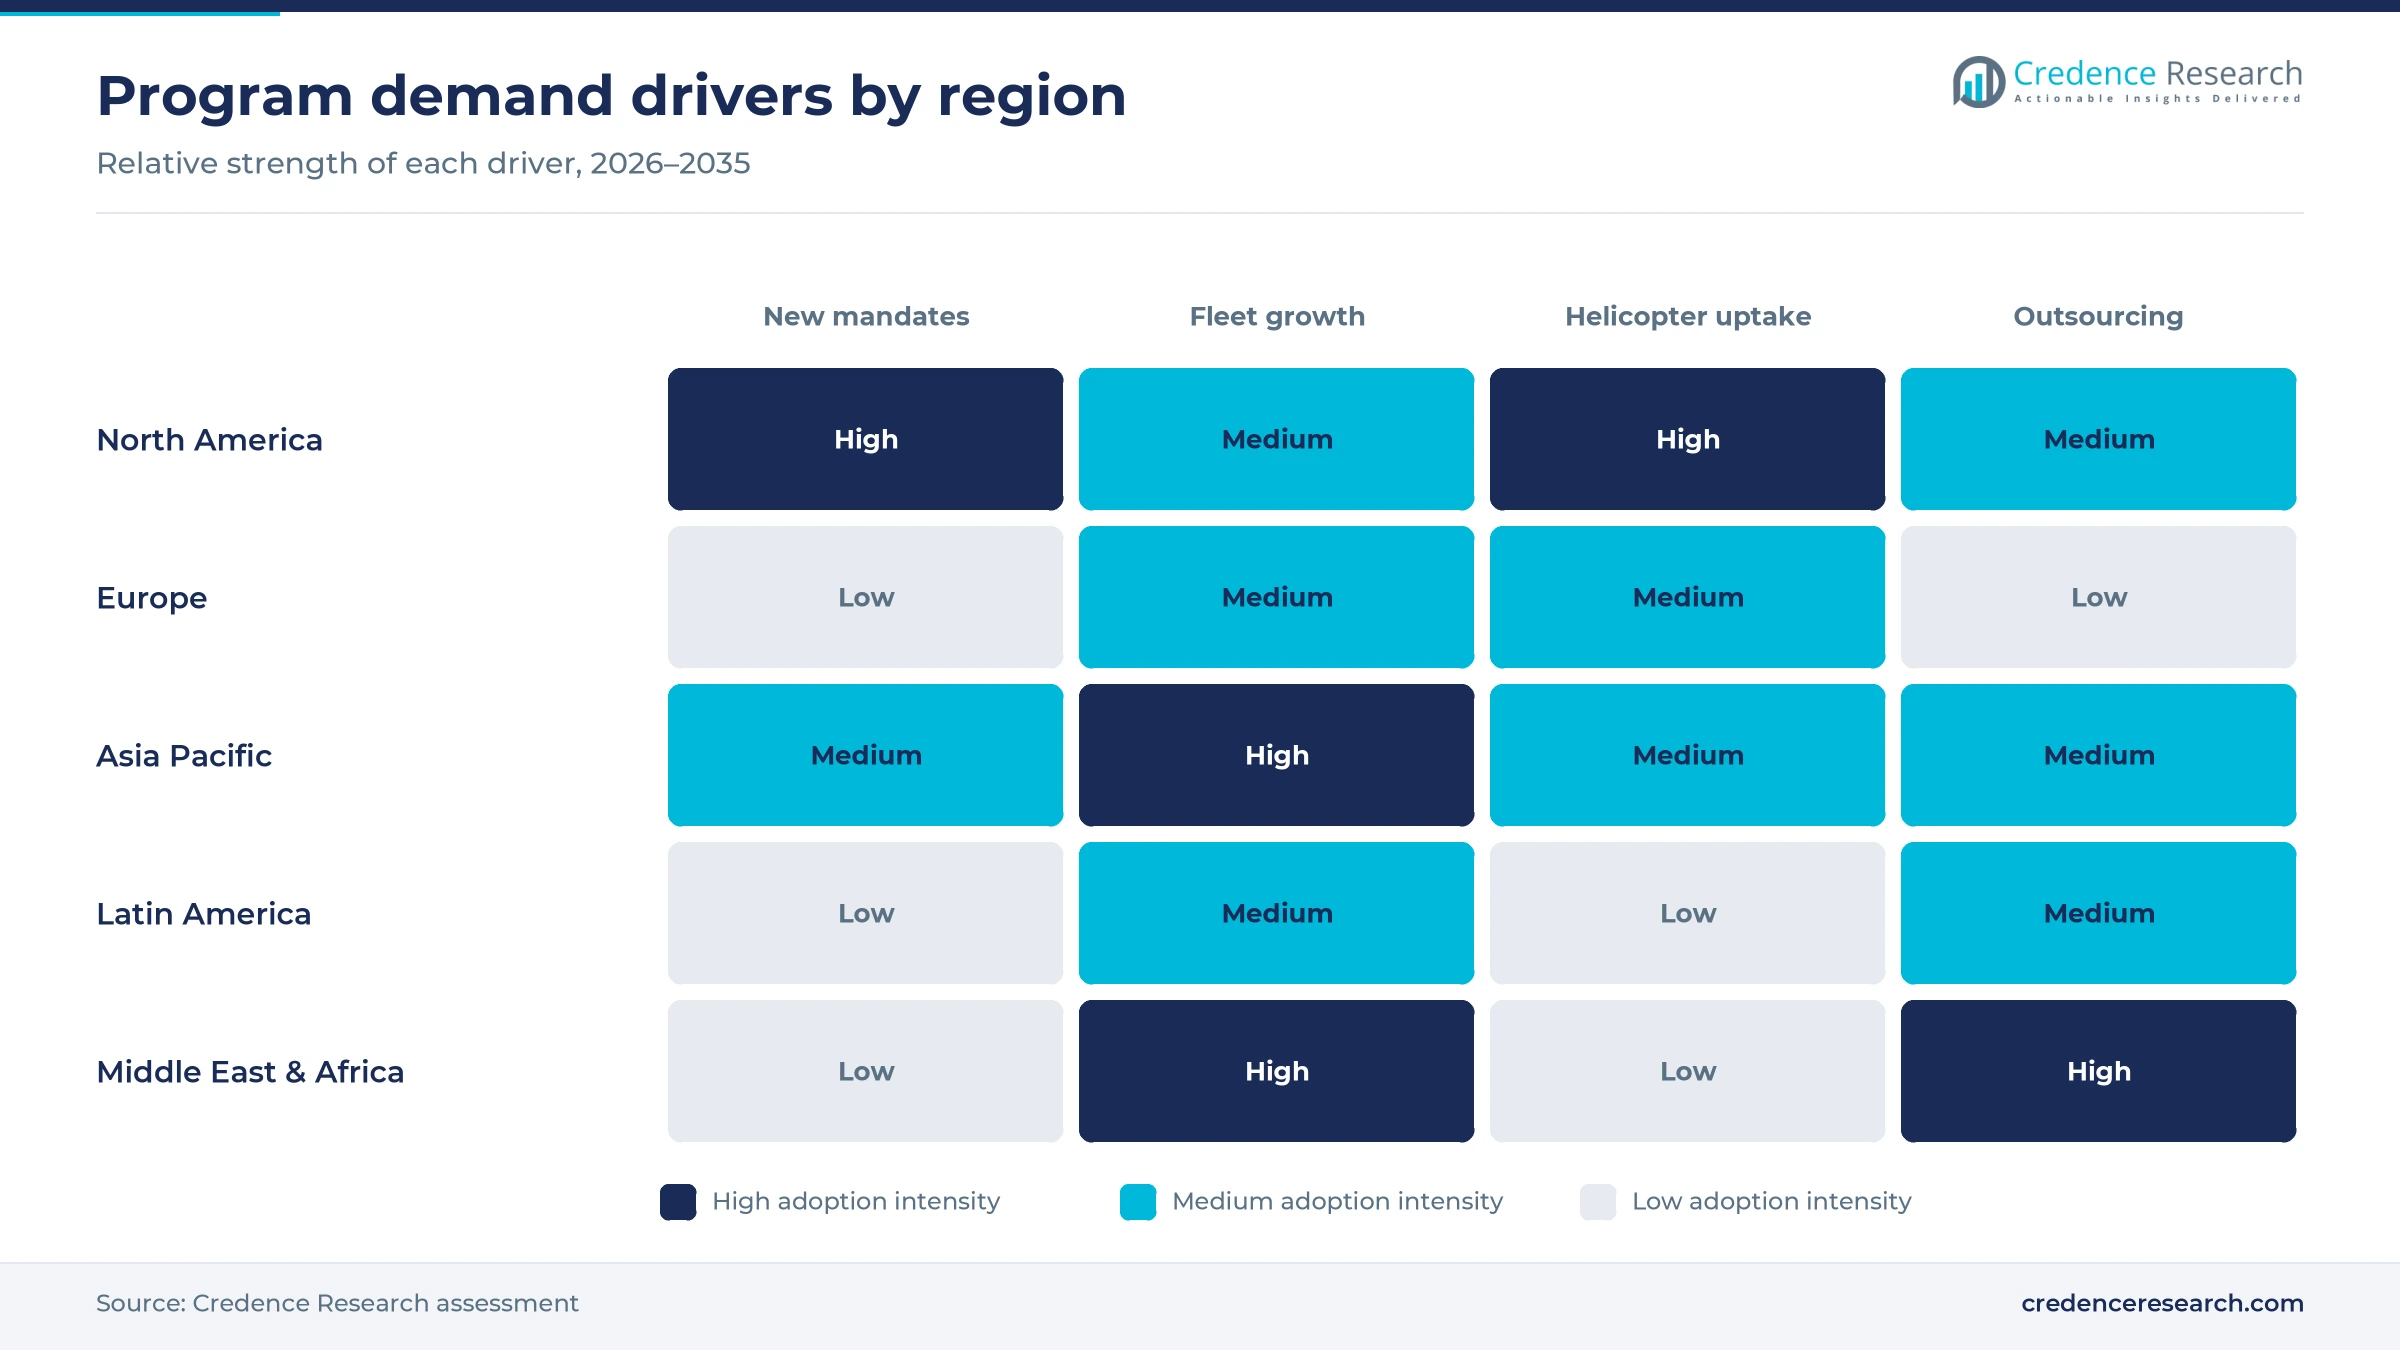
Regulators are extending structured safety programs beyond large airlines, which turns flight data review into a practical requirement for charter, air tour and smaller commercial operators. The FAA published its expanded Part 5 safety management rule on April 26, 2024, and Part 135 operators must submit a declaration of compliance by May 28, 2027. The FAA Reauthorization Act of 2024 directs the agency to consider a flight data monitoring standard for all commercial air tour operators and to require approved monitoring systems on air tour helicopters. Transport Canada adopted the ICAO standard for Subpart 705 international operators in 2026, with an advisory circular effective Sept. 15, 2026. Suppliers that sell low-cost bundles to small fleets gain most.
A worse 2025 accident record raises scrutiny of routine data
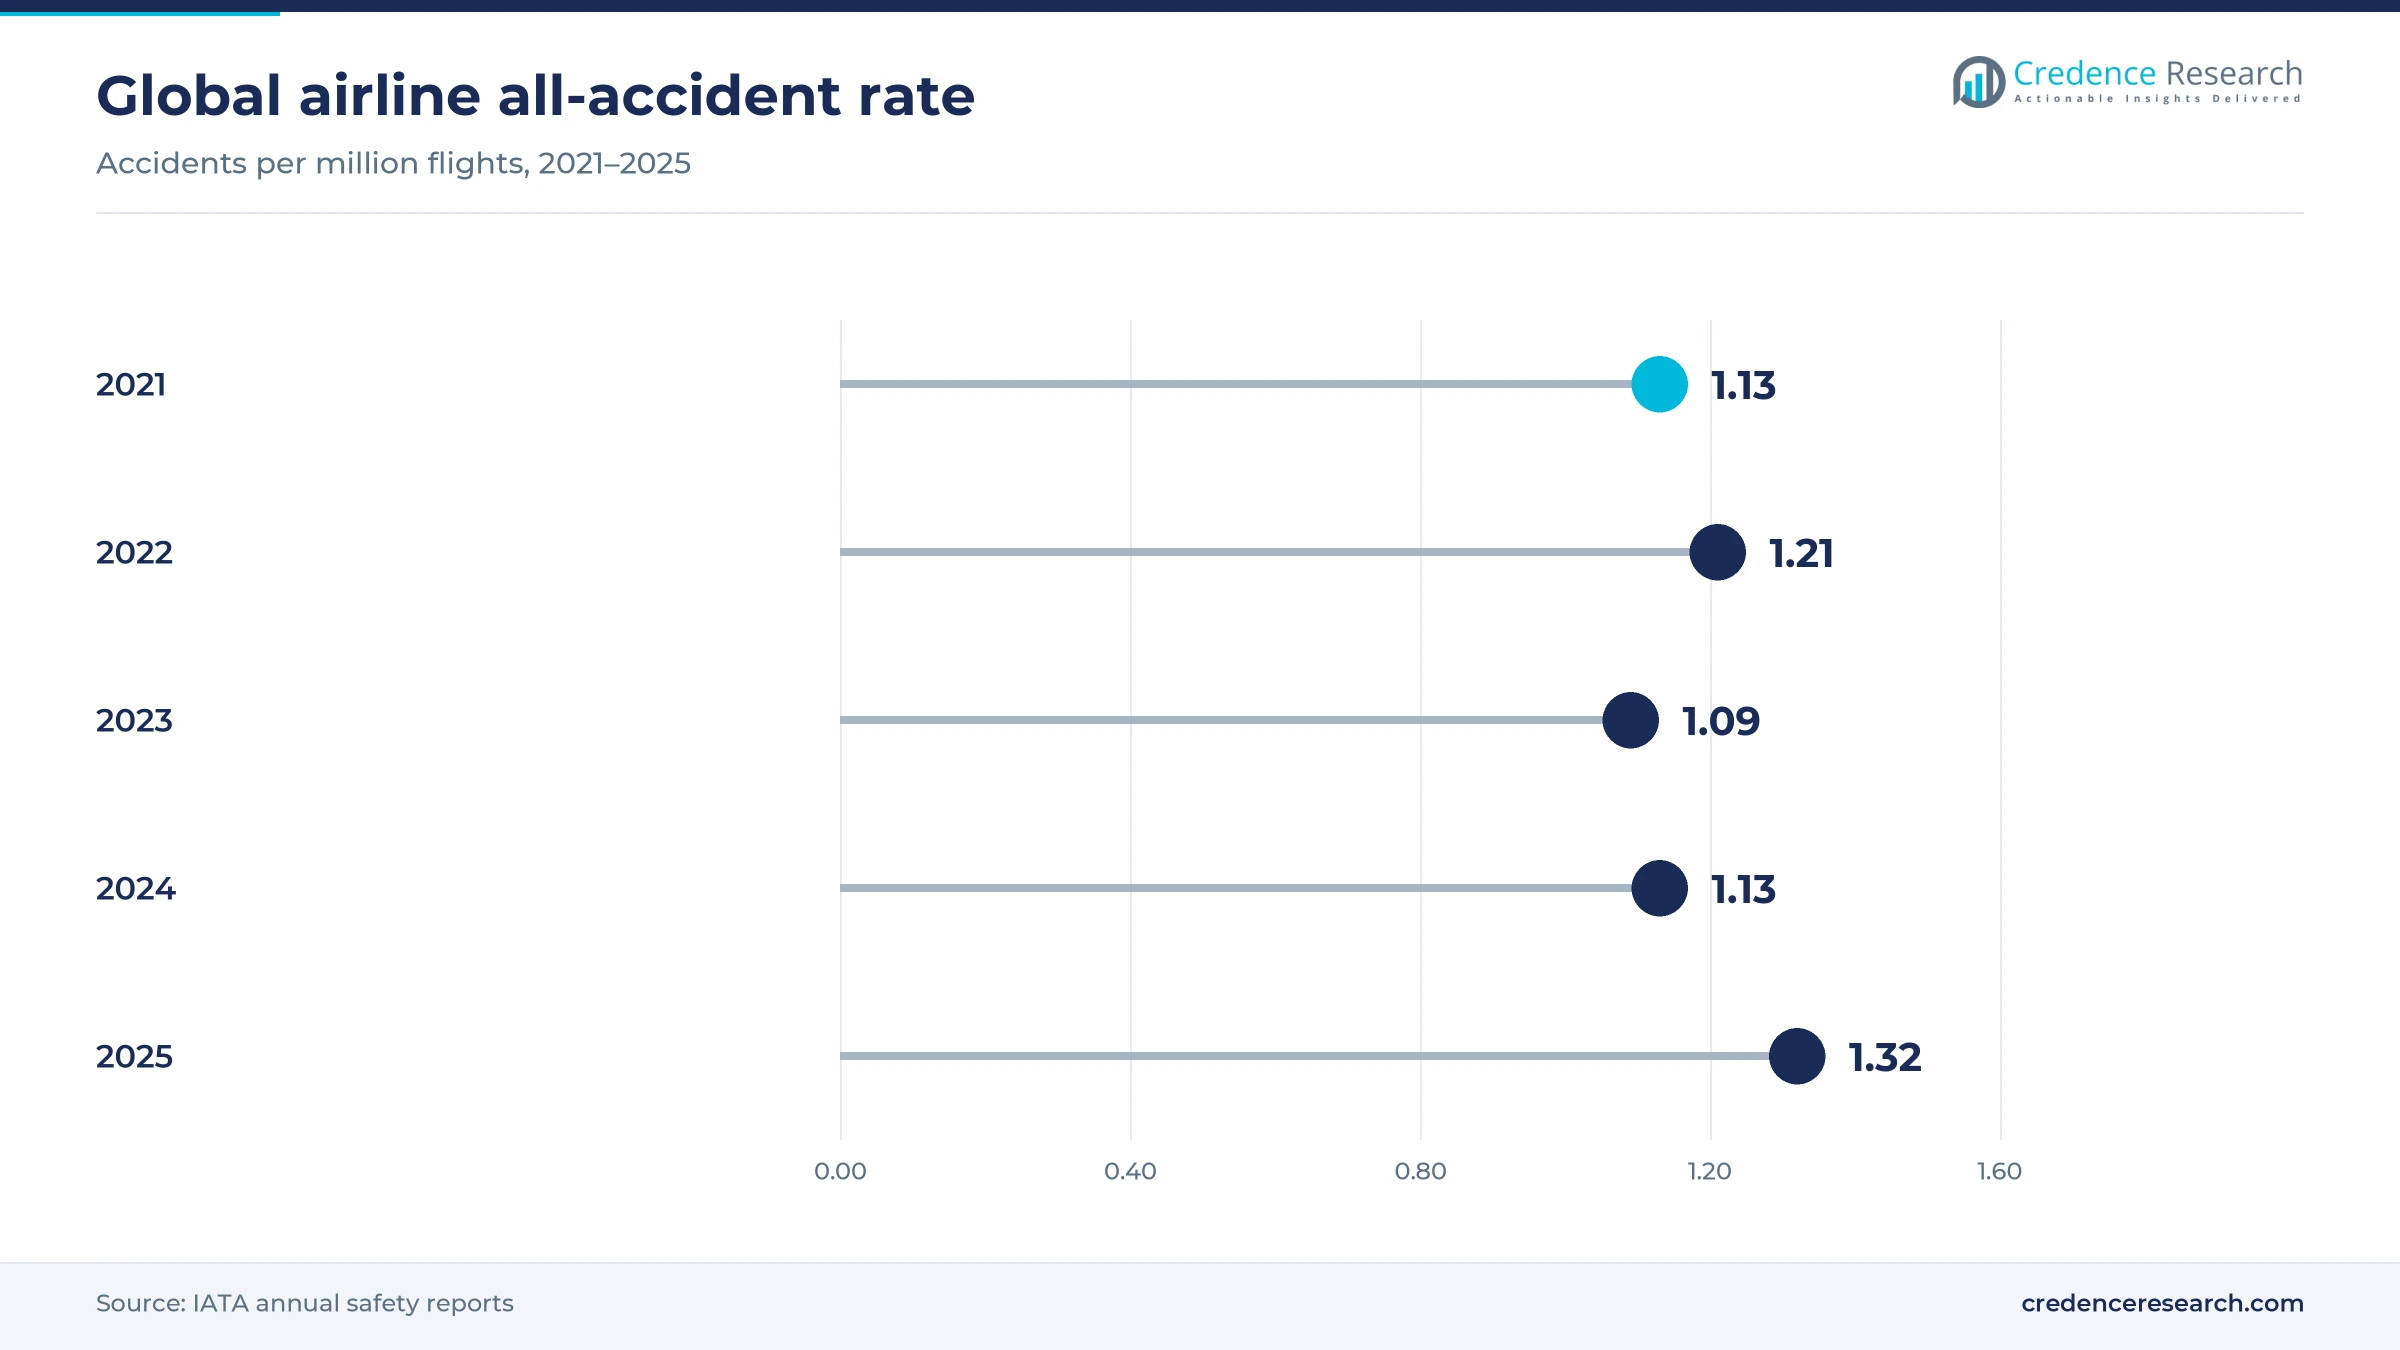
Airline safety performance weakened in 2025, which strengthens the case for programs that detect unstable approaches, runway excursions and other precursors before they become accidents. IATA reported an all-accident rate of 1.32 per million flights in 2025, with eight fatal accidents across 38.7 million flights. That compared with 1.13 per million flights in 2024, according to IATA's 2024 safety report, and with a five-year average of 1.27 for 2021 to 2025. Such reversals give airline safety departments stronger grounds to request analysis budgets, so carriers running basic exceedance programs become prospects for deeper analysis and pilot feedback tools.
Fleet growth adds aircraft that arrive ready for data capture
Every new commercial aircraft enters a monitoring program, so fleet growth adds recurring per-aircraft fees for software and service suppliers. Boeing expects the global fleet to nearly double to more than 49,600 commercial airplanes by 2044, which requires 43,600 new deliveries, according to its Commercial Market Outlook published on June 15, 2025. Single-aisle airplanes account for 33,285 of those deliveries, which concentrates new program demand in low-cost and short-haul fleets that fly many sectors a day. New aircraft carry digital data buses and wireless links from the factory, which lowers installation cost and lets airlines start programs on delivery, so suppliers with line-fit approvals win early.
Air forces turn flight data into a fleet safety baseline
Military operators use routine flight data to set baselines for normal operations and to find drift in crew and aircraft behavior, which creates a large and steady buyer group for analysis software and data handling. The U.S. Air Force Safety Center says its Military Flight Operations Quality Assurance program covers more than 2,200 aircraft in 14 fleets, from the T-6 trainer to the B-1B bomber. The program analyzes more than 37,000 flights and about 3.7 terabytes of data each month. Participation is still voluntary for system program offices, so coverage can widen without new mandates, which favors suppliers with secure data handling and defense approvals.
Wireless downloads and pilot apps change how data is used
Wireless recorders are shifting downloads away from manual card pulls
Airlines are shifting toward automatic wireless offload after every landing to shorten the time between a flight and its analysis, creating openings for wireless recorders across narrowbody fleets. Teledyne Controls says its GroundLink Comm+ system already downloads flight data automatically on more than 14,000 aircraft, about 6,500 of them A320-family jets. Acron Aviation signed a partnership with Flight Data Technologies in September 2025 to add that firm's wireless quick access recorder to its analysis service. Firan Technology Group completed its purchase of FLYHT on Dec. 20, 2024, bringing the AFIRS Edge cellular recorder line into a larger avionics group. Faster offload raises the value of software that returns results within minutes.
Pilot-facing apps and fuel modules are rising inside safety programs
Analysis suppliers are shifting from safety-office reports toward applications that give each pilot personal trends, which lets airlines use one data stream for safety, training and fuel savings. GE Aerospace says its FlightPulse application is used by 60,000 pilots, a 156% increase since 2022, and flydubai agreed in November 2025 to deploy Safety Insight and FlightPulse across 96 Boeing 737 aircraft. Ethiopian Airlines selected Safran's Cassiopée Alpha in October 2025 with Pilot in the Loop debriefing and Green fuel modules. Bundled modules raise revenue per aircraft and make suppliers harder to replace, because pilots and fuel teams depend on them daily.
Helicopter and air medical fleets offer an underserved opening
Most helicopter operators sit outside monitoring mandates, since European rules cover only offshore flights and ICAO treats helicopters above 7,000 kg as a recommended practice, which gives suppliers an opening in air medical, offshore and tour flying where accident costs are high. SKYTRAC and Airbus Helicopters launched a factory-installed real-time alerting option for the H135, H145, H160 and H175 in November 2025, sending exceedance and position data over the Iridium network. HALO-Flight selected Brazos Safety Systems for an FDM-based safety program for its air medical fleet in June 2025. The Vertical Aviation International association added a member flight data program with Truth Data Insights in June 2024, which lowers entry cost for commercial helicopter operators with small fleets.
Engine shops are opening a second paying user for the same data
Maintenance providers want the same full-flight data that safety teams already collect, which opens a second paying user for each download and moves monitoring budgets toward maintenance savings. MTU Maintenance and Teledyne Controls agreed in October 2025 to send airline-approved engine parameters directly to MTU analytics, with Viva Aerobus as the launch customer for A320 aircraft with V2500 engines. Safran's Vietnam Airlines agreement, announced in June 2025 for 2026 to 2030, includes a Tech Profile module for maintenance analysis. Engine overhauls are among the largest cost items in aircraft maintenance, so even small savings from earlier fault detection justify shared data feeds for airlines and engine shops.
Mandate gaps and vendor churn slow smaller operators
European mandates still stop at large aeroplanes
European rules still require programs only for commercial aeroplanes above 27,000 kg and for offshore helicopters, which leaves regional turboprops and smaller jets outside the mandate. EASA's proposal NPA 2024-02, published in April 2024, improved how programs are run but did not extend them to aeroplanes between 15,000 kg and 27,000 kg, because ICAO had not adopted that change. Suppliers selling to regional carriers must therefore win on safety and fuel savings rather than compliance, which lengthens sales cycles.
Long-standing installations make airlines slow to switch
Airlines rarely replace a monitoring platform, because event definitions, historic trends and staff training are built around one system. Vietnam Airlines used Safran's earlier Cassiopée AGS software for about 20 years, and its June 2025 memorandum to move to Cassiopée Alpha for 2026 to 2030 still awaited contract signing at announcement. Challengers must fund data migration and parallel running to win such fleets, which raises their acquisition cost and protects incumbents from price pressure.
Ownership changes create support risk for buyers
Several suppliers changed owners within months, which forces buyers to check product roadmaps and support commitments before signing multi-year contracts. L3Harris completed the USD 800 million sale of its commercial aviation business, including flight data analytics, to an affiliate of TJC on March 31, 2025, and the unit now trades as Acron Aviation. FLYHT became a Firan Technology Group subsidiary in December 2024. Operators with long contracts are most exposed if a new owner retires a product line or changes service terms.
New recovery rules add certification work for recorders
A new U.S. rule on overwater data recovery will add certification and bandwidth costs for recorder and connectivity suppliers. The 2024 FAA reauthorization requires the agency to finish a rulemaking within 18 months so that applicable airliners made on or after Jan. 1, 2028, can recover mandatory flight parameters without retrieving recorders from the sea floor. Small suppliers without certification teams are most exposed, while airlines face added equipment cost per new aircraft until volumes lower unit prices.
North America leads as Asia Pacific adds new fleets
| Region | Value, 2025 (USD billion) | Share, 2025 | CAGR, 2026–2035 |
|---|---|---|---|
| North America | 0.54 | 36.0% | 7.5% |
| Europe | 0.42 | 28.0% | 7.7% |
| Asia Pacific | 0.37 | 25.0% | 9.7% |
| Latin America | 0.09 | 6.0% | 8.8% |
| Middle East & Africa | 0.07 | 5.0% | 9.3% |
North America leads on FAA rules and large business fleets
North America held 36.0% of 2025 value and grows at 7.5% a year, supported by the largest U.S. airline, charter and business jet fleets and by the FAA safety management rule described above. GE Aerospace made its C-FOQA service available through Textron Aviation's LinxUs data system in June 2025, which brings airline-style monitoring to Cessna owners. The U.S. flight data monitoring market also benefits from defense demand, since air force and navy programs buy analysis tools and data acquisition hardware. Canada adds demand through the 2026 Transport Canada guidance noted earlier.
Europe holds a mature base built on EASA rules
Europe held a 28.0% share of 2025 value and grows at 7.7% a year, as EASA rule ORO.AOC.130 has long required programs for large commercial aeroplanes. The U.K. Civil Aviation Authority keeps the same requirement in its retained rules, so U.K. carriers follow identical program standards. France hosts Safran's Cassiopée business, and Germany adds engine-data demand through MTU Maintenance, which supports suppliers that link safety and maintenance data. Growth is slower than in Asia because most large European fleets already run programs and now buy upgrades rather than new installations.
Asia Pacific grows fastest on new fleets and first-time buyers
Asia Pacific held 25.0% of 2025 value and grows fastest at 9.7% a year, as airlines in China, India and Southeast Asia add aircraft from the order backlog and sign fleet-wide contracts. Peach Aviation became the first Japanese customer for GE Aerospace's Integrated Flight Analytics in August 2025, and China Southern has used Safran's Cassiopée Alpha since November 2020. Japan, China and Vietnam therefore mix long-standing programs with first-time buyers, which keeps competition between the main analysis suppliers intense.
Latin America adds fleet-wide analytics at major carriers
Latin America held a 6.0% share of 2025 value and grows at 8.8% a year, led by Mexico and Brazil. Aeromexico agreed in September 2025 to adopt GE Aerospace's Safety Insight, Fuel Insight and FlightPulse across its entire fleet, linking safety review to fuel savings. Viva Aerobus is the launch customer for the shared engine data arrangement described above. Public data on smaller regional carriers are limited, so the regional share is a Credence Research estimate built from fleet counts and announced contracts.
Middle East & Africa grows on carrier expansion and outsourcing
Middle East & Africa held a 5.0% share of 2025 value and grows at 9.3% a year, as fast-growing carriers buy fleet-wide programs and smaller airlines outsource them. The Ethiopian Airlines and flydubai selections noted above moved two of the region's largest fleets to new analysis platforms within a month, while the Air Cairo contract shows how carriers without large safety teams buy the whole program. Data on African operators outside the main carriers are scarce, so that part of the share is an estimate.
Airline contracts and ownership deals reset suppliers
| Development | Status and market relevance |
|---|---|
| In November 2025, flydubai agreed with GE Aerospace to deploy Safety Insight and FlightPulse across its whole Boeing 737 fleet. | Announced agreement at the Dubai Airshow; deployment had not been reported as complete, and it adds a large Gulf fleet to the GE installed base. |
| In October 2025, Ethiopian Airlines selected Safran's Cassiopée Alpha for fleet-wide flight data analysis, with Pilot in the Loop and Green modules. | Selection announced, with Safran training the airline's safety experts and pilots; it covers 147 aircraft. |
| In October 2025, MTU Maintenance and Teledyne Controls agreed to share airline-approved engine data from GroundLink downloads, with Viva Aerobus as launch customer. | Partnership announced with a named launch customer; no fleet-wide go-live date was given. |
| In September 2025, Acron Aviation and Flight Data Technologies formed a partnership to add a wireless quick access recorder to Acron's analysis offer. | Signed partnership; no customer rollouts had been announced, and it gives Acron its own wireless capture option. |
| In March 2025, L3Harris completed the sale of its commercial aviation business, including flight data analytics, to an affiliate of TJC. | Completed divestiture; the business now operates as Acron Aviation, an independent supplier focused on civil aviation. |
Wireless recorders and satellite links speed analysis
- Wireless quick access recorders send full-flight data over cellular or Wi-Fi links after landing, which removes manual card handling and delays.
- Satellite alerting units transmit exceedances and position during flight over Iridium links, which gives helicopter operators real-time flight data monitoring.
- Configurable event libraries let operators tune hundreds of predefined safety events to their own procedures, which cuts false alerts and setup time.
- Shared data distribution services pass selected parameters to engine shops and aircraft health platforms, so one download serves safety and maintenance.
Need a Custom Version of This Report?
Tailor the scope, geography, or segments to your exact requirements.
- Custom geography or segment scope
- Direct access to our analyst team
Analytics owners compete for fleet-wide airline contracts
Competition turns on the size of the event library, the installed base of trend data and the ability to sell pilot, fuel and maintenance modules on top of safety analysis. GE Aerospace and Safran hold the largest airline installed bases and win most fleet-wide renewals, while Acron Aviation competes with outsourced services and recorders from its wider Acron Technologies group. Teledyne Controls leads in wireless onboard data transfer, and Curtiss-Wright supplies recorders and data acquisition hardware to military and civil fleets. Firan Technology Group, through its FLYHT unit, and SKYTRAC both sell real-time satellite and cellular data links to operators. Guardian Mobility, Brazos Safety Systems and Flight Data Technologies serve helicopters, business aircraft and regional fleets, where price per aircraft matters more than module depth.
A few analytics owners hold airline fleets while niche firms serve the rest
The flight data monitoring and analysis supply side has two clear tiers of suppliers. GE Aerospace, Safran and Acron Aviation own large analysis platforms and event libraries and compete for fleet-wide airline contracts, while Teledyne Controls and other commercial avionics suppliers sell the onboard units that capture data. Acron Technologies also owns SKYTRAC and Flight Data Systems, while smaller firms such as Guardian Mobility and Brazos Safety Systems serve helicopters, business aircraft and regional operators. Barriers are the size of the event library, airworthiness approvals for onboard hardware and years of trend history, while margins sit mainly in recurring software and service fees rather than hardware.
Nine suppliers that operators shortlist for programs
| Company | Type | Role in the market |
|---|---|---|
| GE Aerospace | Analytics platform owner | Safety Insight, EMS, FlightPulse and C-FOQA analysis for airlines and business fleets |
| Safran S.A. | Analytics platform owner | Cassiopée Alpha flight data analysis and outsourced services for airlines |
| Acron Aviation (Acron Technologies) | Analytics, recorder and data link supplier | Flight Data Connect service, recorders, SKYTRAC satcom and Flight Data Systems readout |
| Teledyne Technologies Incorporated (Teledyne Controls) | Onboard hardware specialist | GroundLink wireless data transfer and data distribution for airline fleets |
| Curtiss-Wright Corporation | Recorder and acquisition hardware maker | Flight recorders and data acquisition units for military and civil aircraft |
| Firan Technology Group Corporation (FLYHT) | Real-time data link specialist | AFIRS satcom and cellular recorders with real-time flight data streaming |
| Guardian Mobility (Metro Aviation) | Helicopter FDM specialist | Tracking and flight data monitoring hardware for helicopter operators |
| Brazos Safety Systems | FDM service specialist | FDM-based safety programs for helicopter and fixed-wing operators |
| Flight Data Technologies | Onboard hardware specialist | Wireless quick access recorders for airline fleets |
Value shifts from recorders to analysis and services
Credence Research's view is that flight data monitoring and analysis value is moving from the recorder to the analysis and service layer. Wireless capture is becoming standard on new aircraft, so hardware prices will fall while software and service fees grow with each added module. Airline renewals will remain concentrated among a few platform owners, so challengers will find more room in helicopters, charter fleets and outsourced programs for mid-size carriers. Buyers should negotiate data ownership and export rights early, because switching costs rise every year a supplier holds the trend history.
Fleet counts and vendor coverage anchor the estimate
The report uses 2025 as the base year and 2026 to 2035 as the forecast period. Market values come from the Credence Research model, converted from the earlier edition and checked against commercial fleet counts, published supplier coverage figures, military program data and list prices. Aircraft type, end use, component and regional splits are Credence Research estimates built from fleet data, regulatory scope and announced contracts. Sources include ICAO, EASA, FAA, Transport Canada and IATA documents and company releases. The estimates do not rely on interviews or surveys conducted by Credence Research.
Helicopters and Asian fleets carry growth to 2035
Flight data monitoring and analysis value rises from USD 1.61 billion in 2026 to USD 3.31 billion by 2035, with Asia Pacific adding the largest share of new aircraft. North America keeps the largest base as Part 135 operators complete safety management programs and helicopter rules develop. Europe grows through upgrades and pilot modules rather than new installations. The pace of helicopter adoption, the timing of wider ICAO coverage for smaller aeroplanes and the spread of engine data sharing will decide whether growth lands at the upper or lower end of the range.
Mandate timing and airline budgets decide the range of outcomes
The base case assumes steady fleet growth, Part 135 compliance by 2027 and gradual helicopter adoption. The downside follows if airline profits weaken, aircraft deliveries slip and small operators meet safety management rules without paid monitoring. The upside requires helicopter and air tour monitoring rules in the United States, wider ICAO coverage of smaller aeroplanes and faster sharing of engine data with maintenance providers.
| Scenario | CAGR, 2026–2035 | Value, 2035 | What has to hold |
|---|---|---|---|
| Downside | 6.8% | USD 2.92 billion | Delivery delays and weak airline budgets slow upgrades while small operators avoid paid programs |
| Base | 8.30% | USD 3.31 billion | Fleet growth continues and Part 135 operators meet the 2027 safety management deadline |
| Upside | 9.5% | USD 3.65 billion | U.S. air tour rules and wider ICAO coverage bring helicopters and regional aircraft into programs |
Frequently Asked Questions
How big is the flight data monitoring market?
Which companies lead flight data monitoring?
How large is the U.S. flight data monitoring market?
What is real-time flight data monitoring?
How do the U.K., France and Germany flight data monitoring markets differ?
How are China and Japan adopting flight data monitoring?
How does flight data monitoring support MRO services?
Which segment grows fastest in flight data monitoring?
Table of Content
Chapter 1 Market Segmentation
- 1.1 Segmentation Framework
- 1.1.1 Product and Service Classification
- 1.1.2 Application and End-Use Classification
- 1.1.3 Technology and Solution Classification
- 1.1.4 Customer and Distribution Channel Classification
- 1.1.5 Geographic Segmentation
- 1.1.6 Market Segment Definitions and Boundaries
- 1.2 By Aircraft Type
- 1.2.1 Fixed Wing
- 1.2.2 Rotary Wing
- 1.3 By End Use
- 1.3.1 Civil
- 1.3.2 Military
- 1.4 By Component
- 1.4.1 Ground Analysis Software
- 1.4.2 Onboard Data Acquisition Hardware
- 1.4.3 Outsourced FDM Services
Chapter 2 Introduction
- 2.1 Report Objectives and Scope
- 2.2 Product Definition and Industry Terminology
- 2.3 Market Inclusions and Exclusions
- 2.4 Research Process
- 2.4.1 Primary Research and Expert Interviews
- 2.4.2 Secondary Research and Source Review
- 2.4.3 Top-Down and Bottom-Up Estimation
- 2.4.4 Data Triangulation and Verification
- 2.5 Market Size Measurement Basis
- 2.5.1 2025: USD 1.49 billion → 2035: USD 3.31 billion
- 2.6 Historical and Forecast Reference Periods
- 2.6.1 Historical Period: 2018-2025
- 2.6.2 Base Year: 2025
- 2.6.3 Forecast Period: 2025-2035
- 2.7 Research Assumptions and Limitations
Chapter 3 Executive Summary
- 3.1 Market Snapshot and Key Findings
- 3.2 Base-Year Market Size, 2025
- 3.3 Forecast Market Size, 2035
- 3.4 Revenue and Volume Growth Outlook
- 3.5 Key Demand and Supply Indicators
- 3.6 Leading Market Segments
- 3.7 Fastest-Growing Market Opportunities
- 3.8 Regional Performance Highlights
- 3.9 Technology and Industry Transformation
- 3.10 Competitive Landscape Summary
- 3.11 Analyst View and Strategic Implications
Chapter 4 Global Flight Data Monitoring and Analysis Market Trends and Developments
- 4.1 Historical Industry Development, 2018-2025
- 4.2 Recent Market Trends and Developments
- 4.3 Demand and Customer Behavior Trends
- 4.4 Technology and Product Innovation
- 4.5 Artificial Intelligence, Automation and Digitalization
- 4.6 Local Manufacturing and Supply Chain Realignment
- 4.7 Industry Partnerships, Mergers and Acquisitions
- 4.8 Sustainability and Circular Economy Developments
- 4.9 Government and Private Sector Investment Trends
- 4.10 Emerging Business Models and Commercialization
- 4.11 Industry Developments and Announcements
Chapter 5 Global Flight Data Monitoring and Analysis Market Production, Supply and Demand Analysis
- 5.1 Demand Trend and Consumption Analysis, 2018-2025
- 5.2 Demand Forecast, 2025-2035
- 5.3 Production and Output Trend, 2018-2025
- 5.4 Production and Output Forecast, 2025-2035
- 5.5 Installed Capacity and Capacity Utilization
- 5.6 Company-Wise Production Plants and Statistics
- 5.6.1 Installed Production Capacity
- 5.6.2 Actual Production
- 5.6.3 Planned Capacity and Expansion Targets
- 5.7 Supply Chain Structure and Procurement Trends
- 5.8 Supply-Demand Gap and Bottlenecks
- 5.9 Import Dependence and Sourcing Structure
- 5.10 Contract Manufacturing and Outsourcing
- 5.11 Regional Supply and Demand Concentration
Chapter 6 Global Flight Data Monitoring and Analysis Market Pricing Analysis
- 6.1 Pricing Structure and Measurement
- 6.2 Historical Pricing Trends, 2018-2025
- 6.3 Pricing Outlook, 2025-2035
- 6.4 Average Selling Price and Unit Economics
- 6.5 Pricing by Product and Market Segment
- 6.6 Geographic Pricing Differences
- 6.7 Key Input, Energy, Labor and Logistics Costs
- 6.8 Contract Pricing and Purchasing Models
- 6.9 Pricing Sensitivity and Competitive Positioning
- 6.10 Price, Margin and Profitability Implications
Chapter 7 Global Flight Data Monitoring and Analysis Market Dynamics
- 7.1 Market Growth Drivers
- 7.1.1 Demand-Side Drivers
- 7.1.2 Technology and Innovation Drivers
- 7.1.3 Infrastructure and Investment Drivers
- 7.1.4 Regulatory and Policy Drivers
- 7.2 Market Restraints
- 7.2.1 Cost and Affordability Constraints
- 7.2.2 Technology and Adoption Barriers
- 7.2.3 Supply Chain and Operational Constraints
- 7.3 Market Challenges
- 7.3.1 Competitive Pressure and Margin Erosion
- 7.3.2 Skills, Infrastructure and Implementation Gaps
- 7.4 Emerging Market Opportunities
- 7.5 Market Dynamics Impact and Time-Horizon Assessment
Chapter 8 Global Flight Data Monitoring and Analysis Value Chain Analysis
- 8.1 Industry Value Chain Overview
- 8.2 Upstream Suppliers and Critical Inputs
- 8.3 Technology and Component Providers
- 8.4 Manufacturing or Service Delivery
- 8.5 Distribution, Channel Partners and Integrators
- 8.6 Downstream Applications and End Users
- 8.7 Value Addition and Profit Pools
- 8.8 Vertical Integration and Outsourcing
- 8.9 Supplier Concentration and Risk
- 8.10 Supply Chain Localization and Resilience
Chapter 9 Global Flight Data Monitoring and Analysis Market Regulations and Policies
- 9.1 Relevant Laws, Standards and Compliance Frameworks
- 9.2 Product, Service, Safety and Quality Requirements
- 9.3 Government Policies, Incentives and Subsidies
- 9.4 Imports, Exports and Trade Barriers
- 9.5 Public Procurement and Local Content Requirements
- 9.6 Environmental and Sustainability Compliance
- 9.7 Upcoming Policy Changes and Market Implications
Chapter 10 Global Flight Data Monitoring and Analysis Market Hotspots and Opportunities
- 10.1 Market Opportunity Mapping and Growth Hotspots
- 10.2 High-Growth Applications and Customer Groups
- 10.3 Underserved Markets and White-Space Opportunities
- 10.4 Emerging Technology and Product Opportunities
- 10.5 New Capacity and Investment Hotspots
- 10.6 Market Entry and Expansion Opportunities
- 10.7 Distribution and Partnership Opportunities
- 10.8 Near-Term and Long-Term Commercial Potential
- 10.9 Opportunity Attractiveness and Execution Risks
Chapter 11 Global Flight Data Monitoring and Analysis Market Outlook, 2025-2035
- 11.1 Market Size and Analysis
- 11.1.1 Revenue (Market Measurement: 2025: USD 1.49 billion → 2035: USD 3.31 billion)
- 11.1.2 Market Volume and Quantity Sold
- 11.1.3 Historical Market Size, 2018-2025
- 11.1.4 Base-Year Market Size, 2025
- 11.2 Market Forecast, 2025-2035
- 11.2.1 Revenue Forecast to 2035
- 11.2.2 Volume Forecast to 2035
- 11.2.3 CAGR and Year-on-Year Growth
- 11.2.4 Incremental Revenue Opportunity
- 11.3 Forecast Assumptions and Scenario Analysis
- 11.3.1 Base-Case Forecast
- 11.3.2 Optimistic and Conservative Scenarios
- 11.3.3 Technology, Pricing and Policy Sensitivities
- 11.4 Market Attractiveness and Growth Outlook
Chapter 12 Global Flight Data Monitoring and Analysis Market Segmentation and Outlook
- 12.1 Segmentation Summary and Market Shares, 2025
- 12.2 Largest and Fastest-Growing Segments
- 12.3 By Aircraft Type - Market Size and Forecast, 2025-2035
- 12.3.1 Segment Definition and Scope
- 12.3.2 Historical Market Size, 2018-2025
- 12.3.3 Revenue Forecast, 2025-2035
- 12.3.4 Volume Forecast, 2025-2035
- 12.3.5 Base-Year Market Share, 2025
- 12.3.6 Segment CAGR and Growth Drivers
- 12.3.7 Subsegment Market Size and Forecast
- 12.3.7.1 Fixed Wing
- 12.3.7.2 Rotary Wing
- 12.3.8 Subsegment Pricing and Adoption Trends
- 12.3.9 Leading Suppliers and Competition
- 12.3.10 Regional Demand and Opportunities
- 12.4 By End Use - Market Size and Forecast, 2025-2035
- 12.4.1 Segment Definition and Scope
- 12.4.2 Historical Market Size, 2018-2025
- 12.4.3 Revenue Forecast, 2025-2035
- 12.4.4 Volume Forecast, 2025-2035
- 12.4.5 Base-Year Market Share, 2025
- 12.4.6 Segment CAGR and Growth Drivers
- 12.4.7 Subsegment Market Size and Forecast
- 12.4.7.1 Civil
- 12.4.7.2 Military
- 12.4.8 Subsegment Pricing and Adoption Trends
- 12.4.9 Leading Suppliers and Competition
- 12.4.10 Regional Demand and Opportunities
- 12.5 By Component - Market Size and Forecast, 2025-2035
- 12.5.1 Segment Definition and Scope
- 12.5.2 Historical Market Size, 2018-2025
- 12.5.3 Revenue Forecast, 2025-2035
- 12.5.4 Volume Forecast, 2025-2035
- 12.5.5 Base-Year Market Share, 2025
- 12.5.6 Segment CAGR and Growth Drivers
- 12.5.7 Subsegment Market Size and Forecast
- 12.5.7.1 Ground Analysis Software
- 12.5.7.2 Onboard Data Acquisition Hardware
- 12.5.7.3 Outsourced FDM Services
- 12.5.8 Subsegment Pricing and Adoption Trends
- 12.5.9 Leading Suppliers and Competition
- 12.5.10 Regional Demand and Opportunities
- 12.6 Segment Growth Comparison
- 12.7 Segment Attractiveness and Priority Matrix
Chapter 13 Global Flight Data Monitoring and Analysis End-Use and Application Market Outlook
- 13.1 End-Use Industry and Customer Demand Structure
- 13.2 Leading Applications and Customer Groups
- 13.3 End-Use Market Size, Share and Forecast
- 13.4 Major End-Use Industry Deep Dives
- 13.4.1 Customer Requirements and Use Cases
- 13.4.2 Demand and Replacement Cycles
- 13.4.3 Technical and Regulatory Considerations
- 13.4.4 Purchasing and Procurement Models
- 13.4.5 Leading Vendors and Distribution Channels
- 13.4.6 Forecast and Commercial Opportunities
- 13.5 Emerging Applications and Cross-Segment Demand
- 13.6 End-Use Industry Investment Priorities
Chapter 14 Global Flight Data Monitoring and Analysis Geographic Market Outlook, 2025-2035
- 14.1 Regional Market Size and Share, 2025
- 14.2 Regional Market Forecast, 2025-2035
- 14.3 Regional Pricing, Production and Demand Differences
- 14.4 North America
- 14.4.1 United States
- 14.4.2 Canada
- 14.4.3 Mexico
- 14.5 Europe
- 14.5.1 Germany
- 14.5.2 France
- 14.5.3 Italy
- 14.5.4 United Kingdom
- 14.5.5 Spain
- 14.5.6 Poland
- 14.5.7 Russia
- 14.5.8 Netherlands
- 14.5.9 Belgium
- 14.5.10 Sweden
- 14.5.11 Denmark
- 14.5.12 Norway
- 14.5.13 Rest of Europe
- 14.6 Asia Pacific
- 14.6.1 China
- 14.6.2 India
- 14.6.3 Japan
- 14.6.4 South Korea
- 14.6.5 Thailand
- 14.6.6 Indonesia
- 14.6.7 Vietnam
- 14.6.8 Malaysia
- 14.6.9 Australia
- 14.6.10 Rest of Asia Pacific
- 14.7 Latin America
- 14.7.1 Brazil
- 14.7.2 Argentina
- 14.7.3 Colombia
- 14.7.4 Chile
- 14.7.5 Rest of Latin America
- 14.8 Middle East
- 14.8.1 Saudi Arabia
- 14.8.2 United Arab Emirates
- 14.8.3 Turkey
- 14.8.4 Israel
- 14.8.5 Iran
- 14.8.6 Rest of the Middle East
- 14.9 Africa
- 14.9.1 South Africa
- 14.9.2 Egypt
- 14.9.3 Nigeria
- 14.9.4 Morocco
- 14.9.5 Rest of Africa
- 14.10 Regional Investment, Policy and Supply Chain Differences
- 14.11 Regional Competitive Landscape
- 14.12 Geographic Growth Hotspots
Chapter 15 Global Flight Data Monitoring and Analysis Technology, Innovation and Sustainability Outlook
- 15.1 Technology Landscape and Maturity
- 15.2 Product, Process and Service Innovation
- 15.3 AI, Automation and Digital Tools in the Industry
- 15.4 Technology Adoption and Performance Benchmarking
- 15.5 Innovation Pipeline and R&D Investment
- 15.6 Patent and Intellectual Property Trends
- 15.7 Energy Efficiency and Resource Management
- 15.8 Sustainability, Recycling and Circularity
- 15.9 Technology Roadmap, 2025-2035
- 15.10 Risks of Obsolescence and Technology Substitution
Chapter 16 Global Flight Data Monitoring and Analysis Market Key Strategic Imperatives
- 16.1 Growth and Market Entry Priorities
- 16.2 High-Return Products and Segments
- 16.3 Pricing, Profitability and Cost Optimization
- 16.4 Technology Investment and Product Differentiation
- 16.5 Supply Chain Localization and Resilience
- 16.6 Distribution and Customer Acquisition
- 16.7 Partnership, Acquisition and Capacity Strategy
- 16.8 Regional Expansion Priorities
- 16.9 Short-, Medium- and Long-Term Actions
Chapter 17 Competition Outlook
- 17.1 Industry Competition Characteristics
- 17.2 Market Structure and Concentration
- 17.3 Market Share and Competitive Positioning, 2025
- 17.4 Company-Wise Revenue and Product Benchmarking
- 17.5 Production and Service Capacity Benchmarking
- 17.6 Technology, Pricing and Differentiation
- 17.7 Regional Footprint and Distribution Strength
- 17.8 Mergers, Acquisitions and Strategic Alliances
- 17.9 New Entrants and Competitive Threats
- 17.10 Porter's Five Forces and Industry Attractiveness
- 17.11 Competitive Outlook, 2025-2035
Chapter 18 Company Profiles
- 18.1 Company Coverage and Selection Criteria
- 18.2 GE Aerospace
- 18.2.1 Business Description
- 18.2.2 Company Ownership and Geographic Presence
- 18.2.3 Product and Service Portfolio
- 18.2.4 Manufacturing and Operating Footprint
- 18.2.5 Production Capacity and Expansion Plans
- 18.2.6 Financial Performance and Investment
- 18.2.7 Market Share and Competitive Position
- 18.2.8 Technology and Innovation Capabilities
- 18.2.9 Strategic Alliances or Partnerships
- 18.2.10 Recent Developments
- 18.2.11 Growth Strategy and Outlook
- 18.3 Safran S.A.
- 18.4 Acron Aviation (Acron Technologies)
- 18.5 Teledyne Technologies Incorporated (Teledyne Controls)
- 18.6 Curtiss-Wright Corporation
- 18.7 Firan Technology Group Corporation (FLYHT)
- 18.8 Guardian Mobility (Metro Aviation)
- 18.9 Brazos Safety Systems
- 18.10 Flight Data Technologies
- 18.11 Other Relevant Market Participants
Note: Every listed company is profiled on the structure shown under the first company. The company list is preliminary and may change based on research findings, market developments, data availability and client requirements.
Chapter 19 Disclaimer
- 19.1 Research and Forecast Disclaimer
- 19.2 Data Source and Estimation Limitations
Note: The depth of individual sections depends on data availability for this market. Volume, capacity, trade and other unit-based metrics are included where applicable.