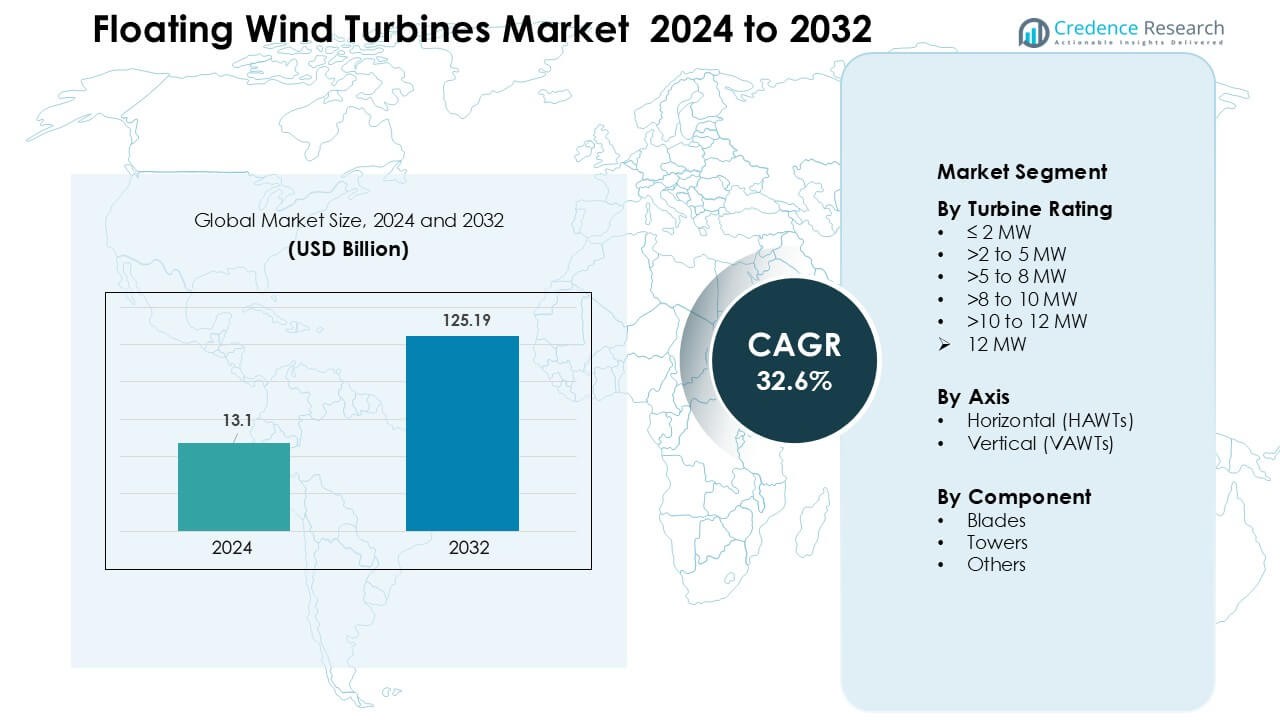
Home » Automation & Process Control » Floating Wind Turbines Market

By Water Depth (Shallow Water, Transitional water, Deep Water) By Turbine Capacity (Up to 3 MW, 3 MW – 5 MW, Above 5 MW)-Growth, Future Prospects & Competitive Analysis, 2016 – 2030

Price: $4999

Published: | Report ID: 4879 | Report Format : PDF

Key Highlights of the Report

The global floating wind turbine market is segmented by material, application, distribution channel, and region. Shallow water is the most popular water depth, while Up to 3 MW is the most commonly used turbine capacity, with Asia Pacific leading the market growth.

The global floating wind turbine market has several drivers, stronger and more reliable wind resources, which are made possible by floating wind turbines. Additionally, they are thus a desirable option for producing clean energy. The ability to deploy turbines in deep waters has been improved due to floating wind turbine technology developments, including better design, construction methods, and mooring systems. However, the market also faces significant challenges, such as comparing floating wind farms to onshore or fixed-bottom offshore farms; floating wind farms typically have higher capital costs. The need for specialized floating structures and the challenging design, construction, and installation procedures add to the upfront costs.

Nonetheless, the global floating wind turbine market offers significant growth opportunities, including huge growth potential in the Asia Pacific region; technical and engineering challenges arise because floating wind turbines operate in more difficult and dynamic offshore environments. Ongoing technological challenges include creating dependable and affordable floating structures, effective mooring systems, and modifying current turbine technologies for offshore deployment.

Market Overview

The global floating wind turbines market has witnessed steady growth in recent years and is expected to grow at a CAGR of 80.60% between 2023 and 2030. The market was valued at USD 1.2 billion in 2022 and is expected to reach USD 75.19 billion in 2030.

Design Element 2

Access crucial information at unmatched prices!

Request your free sample report today & start making informed decisions powered by Credence Research!

Download Free Sample
CTA Design Element 3

What Are The Main Drivers Of The Global Floating Wind Turbines Market?

Several factors drive the global floating wind turbine market. The ability to deploy turbines in deep waters has been improved due to floating wind turbine technology developments, including better design, construction methods, and mooring systems. These technological advances have increased potential areas for offshore wind development.

What Are The Major Challenges Faced By The Global Floating Wind Turbines Market?

The global floating wind turbines market also faces several challenges, including increased expenses, extended project timelines, and difficulties with production and deployment scaling are all potential results of this. Making progress on floating wind projects necessitates navigating convoluted regulatory and permitting procedures, which can differ by nation and region.

What Are The Growth Opportunities In The Global Floating Wind Turbines Market?

The global floating wind turbines market offers significant growth opportunities, including huge growth potential in the Asia Pacific region; particularly in deep waters or difficult seabed conditions, floating wind turbines allow for the development of new offshore wind energy areas.

Executive Summary

Overview of the Global Floating Wind Turbines Market

Innovations in floating wind turbine technology, such as better design, construction techniques, and mooring systems, have increased the feasibility of deploying turbines in deep waters. The potential for offshore wind development has grown as a result of these technological developments. Offshore wind energy has a huge future potential. The potential for offshore wind energy is enormous.

Market Definition

The industry that develops, produces, and deploys wind turbines mounted on floating platforms offshore is known as the floating wind turbines market. With the ability to be deployed in deeper waters than conventional offshore wind farms, where turbines are fixed to the seabed, floating wind turbines offer new opportunities for capturing wind energy. Like their fixed-bottom counterparts, floating wind turbines use large rotor blades to collect the wind’s kinetic energy and transform it into electricity via a generator. The floating platforms that support the turbines are where the main differences lie. To keep the turbines in place, these platforms can either be anchored to the seafloor or use a tension-leg system.

Market Insights

  • The global demand for floating wind turbines was valued at USD 1.2 Billion in 2022 and is expected to reach USD 75.19 Billion in 2030, growing at a CAGR of 80.60% between 2023 and 2030.
  • Shallow water is the leading segment by material. It will hold over 43% share in value in 2022, while the transitional water segment will likely exhibit the fastest CAGR during the forecast period.
  • The up to 3 MW segment governs the global demand for floating wind turbines, holding a massive share of over 80% in 2022, and is expected to grow at a rapid CAGR.
  • The 3 MW – 5 MW segment is expected to post the highest CAGR during the forecast period.
  • Asia Pacific is fueling the growth of the floating wind turbines industry with over one-third share in 2022, while North America and Europe collectively account for just under 50% share in 2022. Europe held over 22% share in 2022.
  • The potential for offshore wind energy is enormous. To access their offshore wind resources and advance their goals for renewable energy, nations with a limited amount of shallow water or a large amount of deep-sea space can use floating wind turbines are the major drivers of the market. At the same time, technical and engineering challenges arise because floating wind turbines operating in more difficult and dynamic offshore environments are the main restraints.
  • The huge growth potential in Asia Pacific and They can be extremely important in achieving decarbonization objectives and reducing reliance on fossil fuels are the major opportunities in the market.

Segmentation by Water Depth

  • Shallow water is the leading segment by material and held over 43% share in value in 2022.
  • The transitional water segment will likely exhibit the fastest CAGR during the forecast period.
  • Deep water is another segment but contributes very little to the global floating wind turbines market compared to the shallow and deep water segments.

Segmentation by Turbine Capacity

  • The Up to 3 MW segment governs the World’s demand for floating wind turbines, holding a massive share of over 80% in 2022, and is also expected to grow at a rapid CAGR.
  • The 3 MW – 5 MW segment contributes the rest of the demand for floating wind turbines.

Segmentation by Region

  • Asia Pacific is fueling the growth of the floating wind turbines industry with over one-third share in 2022.
  • North America and Europe collectively account for just under 50% share in 2022, with Europe holding over 22% share in the same year.
  • The rest of the World, including Latin America, The Middle East, and Africa, contributes the remainder to the demand for floating wind turbines.

The unprecedented and overwhelming COVID-19 pandemic has caused a decrease in demand for floating wind power globally compared to pre-pandemic analyses. The global market for floating wind energy showed a decline of 56.9% in 2020 compared to 2019. Floating structures are used when installing floating wind power offshore, where permanent foundations would be impractical due to the severe weather.

The United States is one of North America’s largest markets for floating wind turbines, with a significant market share. Since floating wind turbines operate in more challenging and dynamic offshore environments, technical and engineering challenges exist. Developing dependable and affordable floating structures, efficient mooring systems, and adapting current turbine technologies for offshore deployment are all ongoing technological challenges, leading to a surge in sales in the U.S.

China is also a major market for floating wind turbines in the Asia Pacific region, with a significant market share. The biggest opportunities in the market are reducing reliance on fossil fuels and achieving decarbonization goals, which can be extremely important.

Floating Wind Turbines Market

Improved Ability To Deploy Turbines In Deep Waters

Unlike onshore locations, offshore locations typically have stronger and more reliable wind resources, made possible by floating wind turbines. They are thus a desirable option for creating clean energy. Innovations in floating wind turbine technology, such as better design, building techniques, and anchoring systems, have increased the feasibility of deploying turbines in deep oceans. Offshore wind development now has more potential areas thanks to these technological developments. The potential for offshore wind energy is enormous. To access their offshore wind resources and advance their goals for renewable energy, nations with a limited amount of shallow water or a large amount of deep-sea space can use floating wind turbines. To lessen reliance on fossil fuels, governments and energy companies are increasingly realizing the value of diversifying their energy sources. By incorporating a dependable and sustainable source of power generation, floating wind turbines offer a chance to diversify the energy mix and improve energy security. Floating wind farm development and operation support regional economies by generating jobs. This covers jobs in building, upkeep, operations, and related services that promote regional development and economic growth.

Increasing Movement In Favor Of Producing Clean Energy

Both developed, and developing nations have embraced renewable energy sources due to the increase in carbon emissions brought on by the increase in energy demand. Because wind and other renewable energy sources are more efficient at reducing carbon emissions, wind farms have been developed. Due to cutting-edge and technical research, offshore wind farms are a reality. As a result, the market for floating wind has been driven by renewable energy sources. The majority of the $530 billion, or nearly 70% of it, can be used to build new power plants, according to the IEA reports published by World Energy Investment and released in 2021. Consumer demand for carbon-neutral energy has sparked technological development and a strong supply chain system as the future energy vision.

Spending on sustainable energy development is increasing. Wind energy is one of the renewable energy sources with the greatest growth because it emits less pollution and carbon dioxide. The market for wind energy has recently grown, claims the Wind Energy Council. The creation and management of wind and the generation and distribution of power using wind energy encourage investment in the energy sector.

Discouraged Investments

Comparing floating wind farms to onshore or fixed-bottom offshore farms, floating wind farms typically have higher capital costs. The need for specialized floating structures and the difficult design, construction, and installation processes raise the initial costs. Technical and engineering challenges arise because floating wind turbines operate in more difficult, dynamic offshore environments. Current technological challenges include developing dependable and affordable floating structures, efficient mooring systems, and modifying existing turbine technologies for offshore deployment. To meet these challenges, continuous innovation, research, and development efforts are necessary. Unlike onshore wind or fixed-bottom offshore wind, floating wind farms need extra infrastructure, like floating substations and specialized vessels for installation and maintenance. The need for appropriate port infrastructure, vessels, and grid connections in some areas can impede the growth of floating wind projects and drive up project costs. Compared to onshore and fixed-bottom offshore wind, the floating wind industry is still in its infancy, resulting in a supply chain that needs to be developed and the industry needs more experience. This could lead to higher costs, longer project timelines, and challenges with production and deployment scaling, among other things. Making progress on floating wind projects requires navigating complex regulatory and permitting processes, which can vary by country and region. Project development may need to be improved by clear regulatory frameworks, protracted permitting processes, and potential conflicts with other ocean uses.

Increases The Potential For Offshore Wind

In areas with deep waters or difficult seabed conditions, floating wind turbines allow for the development of new offshore wind energy areas. This generally increases the potential for offshore wind and enables nations with limited shallow waters to utilize their wind resources and boost their capacity for renewable energy. Many nations and regions are making efforts to switch to cleaner and more sustainable energy sources. As a dependable and scalable renewable energy source, floating wind turbines offer a chance to quicken the offshore energy transition. They can be extremely important in achieving decarbonization objectives and reducing reliance on fossil fuels. Companies in the renewable energy industry have opportunities to diversify their product lines and increase their market presence thanks to the market for floating wind turbines.

This includes wind turbine manufacturers, floating platform creators, engineering companies, and specialty service providers. Companies can tap into new revenue streams and solidify their position in the renewable energy sector by entering the floating wind market. Floating wind turbine technology constantly improves, opening up new possibilities for creativity and cost-cutting. The effectiveness and competitiveness of floating wind farms can be improved with research and development projects to increase turbine efficiency, design floating platforms and mooring systems. Technological advancements can stimulate market growth by increasing floating wind’s economic viability and investor appeal.

Competitive Landscape

Key Players

The global floating wind turbines market is highly competitive, with several key players. Some of the major players in the market and their market share are as follows:

These companies focus on product innovation, expanding their distribution channels, and mergers and acquisitions to stay ahead in the market.

The major players in the global floating wind turbine market are constantly striving to stay ahead by introducing new products and innovations.

Globally, there has been an increase in the deployment of floating wind turbines. Several nations, including the United States, Norway, Japan, the United Kingdom, France, and Portugal, and floating offshore wind projects in 2022.

Significant technological advancements have been made in the field of floating wind turbines to increase efficiency, lower costs, and increase reliability. Designs for floating platforms, mooring systems, and turbine technologies are constantly evolving.

During 2021, the industry has concentrated on lowering the price of floating wind farms. Cost reductions made floating wind more competitive with conventional offshore wind and other energy sources due to R&D efforts, economies of scale, and technological advancements.

Shape Your Report to Specific Countries or Regions & Enjoy 30% Off!

Summary of Key Findings

  • Increasing movement in favor of producing clean energy driving market growth
  • Market segmented by water depth, turbine capacity, and region.
  • Shallow water is the most popular, with deep and transitional water segments.
  • Up to 3 MW is most commonly used for Turbine capacity.
  • Asia Pacific is leading market growth; the market is highly competitive with key players including General Electric (US),Vestas (Denmark), Siemens Gamesa (Spain), Goldwind (China), Shanghai Electric Wind Power Equipment Co. (China),ABB (Switzerland), Doosan Heavy Industries and Construction (South Korea), Hitachi (Japan), Nordex SE (Germany), EEW (Germany).

Future Outlook

  • Positive outlook for the global floating wind turbines market with significant growth potential in the Asia Pacific region
  • Increasing adoption of floating wind turbines in educational settings and innovative distribution channels such as e-commerce to drive growth
  • Challenges from the rising popularity of online games and economic instability
  • Key players to focus on product innovation, expanding market reach and maintaining competitive pricing to stay ahead.

Segmentation

  • By Water Depth
    • Shallow Water
    • Transitional water
    • Deep Water
  • By Turbine Capacity
    • Up to 3 MW
    • 3 MW – 5 MW
    • Above 5 MW
  • By Region
  • North America
    • The US
    • Canada
    • Mexico
  • Europe
    • Germany
    • France
    • The U.K.
    • Italy
    • Spain
    • Rest of Europe
  • Asia Pacific
    • China
    • Japan
    • India
    • South Korea
    • South-east Asia
    • Rest of Asia Pacific
  • Latin America
    • Brazil
    • Argentina
    • Rest of Latin America
  • Middle East & Africa
    • GCC Countries
    • South Africa
    • Rest of the Middle East and Africa

1. Preface
1.1. Report Description
1.1.1. Purpose of the Report
1.1.2. Target Audience
1.1.3. USP and Key Offerings
1.2. Research Scope
1.3. Research Methodology
1.3.1. Phase I – Secondary Research
1.3.2. Phase II – Data Modelling
1.3.2.1. Company Share Analysis Model
1.3.2.2. Revenue Based Modelling
1.3.3. Phase III – Primary Research
1.3.4. Research Limitations
1.3.5. Assumptions
1.4. Market Introduction
1.5. Market Research Scope

2. Executive Summary
2.1. Market Snapshot: Floating Wind Turbines Market
2.2. Floating Wind Turbines Market, By Water Depth
2.3. Floating Wind Turbines Market, By Turbine Capacity
2.4. Floating Wind Turbines Market, By Region

3. Market Dynamics & Factors Analysis
3.1. Introduction
3.1.1. Floating Wind Turbines Market Value, 2017-2030, (US$ Bn)
3.1.2. Y-o-Y Growth Trend Analysis
3.2. Market Dynamics
3.2.1. Market Drivers
3.2.1.1. Driver 1
3.2.1.2. Driver 2
3.2.1.3. Driver 3
3.2.2. Market Restraints
3.2.2.1. Restraint 1
3.2.2.2. Restraint 2
3.2.3. Market Opportunities
3.2.3.1. Opportunity 1
3.2.3.2. Opportunity 2
3.2.4. Major Industry Challenges
3.2.4.1. Challenge 1
3.2.4.2. Challenge 2
3.3. Growth and Development Patterns
3.4. Investment Feasibility Analysis
3.5. Market Opportunity Analysis
3.5.1. Water Depth
3.5.2. Turbine Capacity
3.5.3. Geography

4. Premium Insights
4.1. STAR (Situation, Task, Action, Results) Analysis
4.2. Porter’s Five Forces Analysis
4.2.1. Threat of New Entrants
4.2.2. Bargaining Power of Buyers/Consumers
4.2.3. Bargaining Power of Suppliers
4.2.4. Threat of Substitute Types
4.2.5. Intensity of Competitive Rivalry
4.3. Key Market Trends
4.3.1. Demand Side Trends
4.3.2. Supply Side Trends
4.4. Value Chain Analysis
4.5. Water Depth Analysis
4.6. Analysis and Recommendations
4.7. Marketing Strategy Analysis
4.7.1. Direct Marketing
4.7.2. Indirect MW Marketing
4.7.3. Marketing Channel Development Trend

5. Market Positioning of Key Players, 2022
5.1. Company market share of key players, 2022
5.2. Competitive Benchmarking
5.3. Market Positioning of Key Vendors
5.4. Geographical Presence Analysis
5.5. Major Strategies Adopted by Key Players
5.5.1. Key Strategies Analysis
5.5.2. Mergers and Acquisitions
5.5.3. Partnerships
5.5.4. Product Launch
5.5.5. Geographical Expansion
5.5.6. Others

6. Economic Impact Analysis
6.1. Recession Impact
6.1.1. North America
6.1.2. Europe
6.1.3. Asia Pacific
6.1.4. Latin America
6.1.5. Middle East and Africa
6.2. Ukraine-Russia War Impact
6.2.1. North America
6.2.2. Europe
6.2.3. Asia Pacific
6.2.4. Latin America
6.2.5. Middle East and Africa
6.3. COVID-19 Impact Analysis
6.3.1. North America
6.3.2. Europe
6.3.3. Asia Pacific
6.3.4. Latin America
6.3.5. Middle East and Africa

7. Floating Wind Turbines Market, By Water Depth
7.1. Floating Wind Turbines Market Overview, by Water Depth
7.1.1. Floating Wind Turbines Market Revenue Share, By Water Depth, 2022 Vs 2030 (in %)
7.2. Shallow Water
7.2.1. Floating Wind Turbines Market, By Region, 2017-2030 (US$ Bn)
7.3. Transitional water
7.3.1. Floating Wind Turbines Market, By Region, 2017-2030 (US$ Bn)
7.4. Deep Water
7.4.1. Floating Wind Turbines Market, By Region, 2017-2030 (US$ Bn)

8. Floating Wind Turbines Market, By Turbine Capacity
8.1. Floating Wind Turbines Market Overview, by Turbine Capacity
8.1.1. Floating Wind Turbines Market, By Turbine Capacity, 2022 vs 2030 (in %)
8.2. Up to 3 MW
8.2.1. Floating Wind Turbines Market, By Region, 2017-2030 (US$ Bn)
8.3. 3 MW – 5 MW
8.3.1. Floating Wind Turbines Market, By Region, 2017-2030 (US$ Bn)
8.4. Above 5 MW
8.4.1. Floating Wind Turbines Market, By Region, 2017-2030 (US$ Bn)

9. Floating Wind Turbines Market, By Region
9.1. Floating Wind Turbines Market Overview, by Region
9.1.1. Floating Wind Turbines Market, By Region, 2022 vs 2030 (in%)
9.2. Water Depth
9.2.1. Floating Wind Turbines Market, By Water Depth, 2017-2030 (US$ Bn)
9.3. Turbine Capacity
9.3.1. Floating Wind Turbines Market, By Turbine Capacity, 2017-2030 (US$ Bn)

10. North America Floating Wind Turbines Market Analysis
10.1. North America Floating Wind Turbines Market, by Water Depth, 2017-2030(US$ Bn)
10.1.1. Overview
10.1.2. SRC Analysis
10.2. North America Floating Wind Turbines Market, by Turbine Capacity, 2017-2030(US$ Bn)
10.2.1. Overview
10.2.2. SRC Analysis
10.3. North America Floating Wind Turbines Market, by Country, 2017-2030 (US$ Bn)
10.3.1. North America Floating Wind Turbines Market, by Country, 2022 Vs 2030 (in%)
10.3.2. U.S.
10.3.2.1. U.S. Floating Wind Turbines Market Estimates and Forecast, 2017-2030 (US$ Bn)
10.3.2.2. U.S. Floating Wind Turbines, By Water Depth, 2017-2030 (US$ Bn)
10.3.2.3. U.S. Floating Wind Turbines, By Turbine Capacity, 2017-2030 (US$ Bn)
10.3.3. Canada
10.3.3.1. Canada Floating Wind Turbines Market Estimates and Forecast, 2017-2030 (US$ Bn)
10.3.3.2. Canada Floating Wind Turbines, By Water Depth, 2017-2030 (US$ Bn)
10.3.3.3. Canada Floating Wind Turbines, By Turbine Capacity, 2017-2030 (US$ Bn)
10.3.4. Mexico
10.3.4.1. Mexico Floating Wind Turbines Market Estimates and Forecast, 2017-2030 (US$ Bn)
10.3.4.2. Mexico Floating Wind Turbines, By Water Depth, 2017-2030 (US$ Bn)
10.3.4.3. Mexico Floating Wind Turbines, By Turbine Capacity, 2017-2030 (US$ Bn)

11. Europe Floating Wind Turbines Market Analysis
11.1. Europe Floating Wind Turbines Market, by Water Depth, 2017-2030(US$ Bn)
11.1.1. Overview
11.1.2. SRC Analysis
11.2. Europe Floating Wind Turbines Market, by Turbine Capacity, 2017-2030(US$ Bn)
11.2.1. Overview
11.2.2. SRC Analysis
11.3. Europe Floating Wind Turbines Market, by Country, 2017-2030 (US$ Bn)
11.3.1. Europe Floating Wind Turbines Market, by Country, 2022 Vs 2030 (in%)
11.3.2. Germany
11.3.2.1. Germany Floating Wind Turbines Market Estimates and Forecast, 2017-2030 (US$ Bn)
11.3.2.2. Germany Floating Wind Turbines, By Water Depth, 2017-2030 (US$ Bn)
11.3.2.3. Germany Floating Wind Turbines, By Turbine Capacity, 2017-2030 (US$ Bn)
11.3.3. France
11.3.3.1. France Floating Wind Turbines Market Estimates and Forecast, 2017-2030 (US$ Bn)
11.3.3.2. France Floating Wind Turbines, By Water Depth, 2017-2030 (US$ Bn)
11.3.3.3. France Floating Wind Turbines, By Turbine Capacity, 2017-2030 (US$ Bn)
11.3.4. UK
11.3.4.1. UK Floating Wind Turbines Market Estimates and Forecast, 2017-2030 (US$ Bn)
11.3.4.2. UK Floating Wind Turbines, By Water Depth, 2017-2030 (US$ Bn)
11.3.4.3. UK Floating Wind Turbines, By Turbine Capacity, 2017-2030 (US$ Bn)
11.3.5. Italy
11.3.5.1. Italy Floating Wind Turbines Market Estimates and Forecast, 2017-2030 (US$ Bn)
11.3.5.2. Italy Floating Wind Turbines, By Water Depth, 2017-2030 (US$ Bn)
11.3.5.3. Italy Floating Wind Turbines, By Turbine Capacity, 2017-2030 (US$ Bn)
11.3.6. Spain
11.3.6.1. Spain Floating Wind Turbines Market Estimates and Forecast, 2017-2030 (US$ Bn)
11.3.6.2. Spain Floating Wind Turbines, By Water Depth, 2017-2030 (US$ Bn)
11.3.6.3. Spain Floating Wind Turbines, By Turbine Capacity, 2017-2030 (US$ Bn)
11.3.7. Rest of Europe
11.3.7.1. Rest of Europe Floating Wind Turbines Market Estimates and Forecast, 2017-2030 (US$ Bn)
11.3.7.2. Rest of Europe Floating Wind Turbines, By Water Depth, 2017-2030 (US$ Bn)
11.3.7.3. Rest of Europe Floating Wind Turbines, By Turbine Capacity, 2017-2030 (US$ Bn)

12. Asia Pacific Floating Wind Turbines Market Analysis
12.1. Asia Pacific Floating Wind Turbines Market, by Water Depth, 2017-2030(US$ Bn)
12.1.1. Overview
12.1.2. SRC Analysis
12.2. Asia Pacific Floating Wind Turbines Market, by Turbine Capacity, 2017-2030(US$ Bn)
12.2.1. Overview
12.2.2. SRC Analysis
12.3. Asia Pacific Floating Wind Turbines Market, by Country, 2017-2030 (US$ Bn)
12.3.1. Asia Pacific Floating Wind Turbines Market, by Country, 2022 Vs 2030 (in%)
12.3.2. China
12.3.2.1. China Floating Wind Turbines Market Estimates and Forecast, 2017-2030 (US$ Bn)
12.3.2.2. China Floating Wind Turbines, By Water Depth, 2017-2030 (US$ Bn)
12.3.2.3. China Floating Wind Turbines, By Turbine Capacity, 2017-2030 (US$ Bn)
12.3.3. Japan
12.3.3.1. Japan Floating Wind Turbines Market Estimates and Forecast, 2017-2030 (US$ Bn)
12.3.3.2. Japan Floating Wind Turbines, By Water Depth, 2017-2030 (US$ Bn)
12.3.3.3. Japan Floating Wind Turbines, By Turbine Capacity, 2017-2030 (US$ Bn)
12.3.4. India
12.3.4.1. India Floating Wind Turbines Market Estimates and Forecast, 2017-2030 (US$ Bn)
12.3.4.2. India Floating Wind Turbines, By Water Depth, 2017-2030 (US$ Bn)
12.3.4.3. India Floating Wind Turbines, By Turbine Capacity, 2017-2030 (US$ Bn)
12.3.5. South Korea
12.3.5.1. South Korea Floating Wind Turbines Market Estimates and Forecast, 2017-2030 (US$ Bn)
12.3.5.2. South Korea Floating Wind Turbines, By Water Depth, 2017-2030 (US$ Bn)
12.3.5.3. South Korea Floating Wind Turbines, By Turbine Capacity, 2017-2030 (US$ Bn)
12.3.6. South-East Asia
12.3.6.1. South-East Asia Floating Wind Turbines Market Estimates and Forecast, 2017-2030 (US$ Bn)
12.3.6.2. South-East Asia Floating Wind Turbines, By Water Depth, 2017-2030 (US$ Bn)
12.3.6.3. South-East Asia Floating Wind Turbines, By Turbine Capacity, 2017-2030 (US$ Bn)
12.3.7. Rest of Asia Pacific
12.3.7.1. Rest of Asia Pacific Floating Wind Turbines Market Estimates and Forecast, 2017-2030 (US$ Bn)
12.3.7.2. Rest of Asia Pacific Floating Wind Turbines, By Water Depth, 2017-2030 (US$ Bn)
12.3.7.3. Rest of Asia Pacific Floating Wind Turbines, By Turbine Capacity, 2017-2030 (US$ Bn)

13. Latin America Floating Wind Turbines Market Analysis
13.1. Latin America Floating Wind Turbines Market, by Water Depth, 2017-2030(US$ Bn)
13.1.1. Overview
13.1.2. SRC Analysis
13.2. Latin America Floating Wind Turbines Market, by Turbine Capacity, 2017-2030(US$ Bn)
13.2.1. Overview
13.2.2. SRC Analysis
13.3. Latin America Floating Wind Turbines Market, by Country, 2017-2030 (US$ Bn)
13.3.1. Latin America Floating Wind Turbines Market, by Country, 2022 Vs 2030 (in%)
13.3.2. Brazil
13.3.2.1. Brazil Floating Wind Turbines Market Estimates and Forecast, 2017-2030 (US$ Bn)
13.3.2.2. Brazil Floating Wind Turbines, By Water Depth, 2017-2030 (US$ Bn)
13.3.2.3. Brazil Floating Wind Turbines, By Turbine Capacity, 2017-2030 (US$ Bn)
13.3.3. Argentina
13.3.3.1. Argentina Floating Wind Turbines Market Estimates and Forecast, 2017-2030 (US$ Bn)
13.3.3.2. Argentina Floating Wind Turbines, By Water Depth, 2017-2030 (US$ Bn)
13.3.3.3. Argentina Floating Wind Turbines, By Turbine Capacity, 2017-2030 (US$ Bn)
13.3.4. Rest of Latin America
13.3.4.1. Rest of Latin America Floating Wind Turbines Market Estimates and Forecast, 2017-2030 (US$ Bn)
13.3.4.2. Rest of Latin America Floating Wind Turbines, By Water Depth, 2017-2030 (US$ Bn)
13.3.4.3. Rest of Latin America Floating Wind Turbines, By Turbine Capacity, 2017-2030 (US$ Bn)

14. Middle East and Africa Floating Wind Turbines Market Analysis
14.1. Middle East and Africa Floating Wind Turbines Market, by Water Depth, 2017-2030(US$ Bn)
14.1.1. Overview
14.1.2. SRC Analysis
14.2. Middle East and Africa Floating Wind Turbines Market, by Turbine Capacity, 2017-2030(US$ Bn)
14.2.1. Overview
14.2.2. SRC Analysis
14.3. Middle East and Africa Floating Wind Turbines Market, by Country, 2017-2030 (US$ Bn)
14.3.1. Middle East and Africa Floating Wind Turbines Market, by Country, 2022 Vs 2030 (in%)
14.3.2. GCC Countries
14.3.2.1. GCC Countries Floating Wind Turbines Market Estimates and Forecast, 2017-2030 (US$ Bn)
14.3.2.2. GCC Countries Floating Wind Turbines, By Water Depth, 2017-2030 (US$ Bn)
14.3.2.3. GCC Countries Floating Wind Turbines, By Turbine Capacity, 2017-2030 (US$ Bn)
14.3.3. South Africa
14.3.3.1. South Africa Floating Wind Turbines Market Estimates and Forecast, 2017-2030 (US$ Bn)
14.3.3.2. South Africa Floating Wind Turbines, By Water Depth, 2017-2030 (US$ Bn)
14.3.3.3. South Africa Floating Wind Turbines, By Turbine Capacity, 2017-2030 (US$ Bn)
14.3.4. Rest of Middle East and Africa
14.3.4.1. Rest of Middle East and Africa Floating Wind Turbines Market Estimates and Forecast, 2017-2030 (US$ Bn)
14.3.4.2. Rest of Middle East and Africa Floating Wind Turbines, By Water Depth, 2017-2030 (US$ Bn)
14.3.4.3. Rest of Middle East and Africa Floating Wind Turbines, By Turbine Capacity, 2017-2030 (US$ Bn)

15. Company Profiles
15.1. AiFi Inc.
15.1.1. Company Overview
15.1.2. Products/Services Portfolio
15.1.3. Geographical Presence
15.1.4. Financial Summary
15.1.4.1. Market Revenue and Net Profit (2019-2022)
15.1.4.2. Business Segment Revenue Analysis
15.1.4.3. General Electric (US)
15.1.4.4. Vestas (Denmark)
15.1.4.5. Siemens Gamesa (Spain)
15.1.4.6. Goldwind (China)
15.1.4.7. Shanghai Electric Wind Power Equipment Co. (China)
15.1.4.8. ABB (Switzerland)
15.1.4.9. Doosan Heavy Industries and Construction (South Korea)
15.1.4.10. Hitachi (Japan)
15.1.4.11. Nordex SE (Germany)
15.1.4.12. EEW (Germany)
15.1.4.13. Nexans, (France)
15.1.4.14. DEME (Belgium)
15.1.4.15. Ming Yang Smart Energy Group Co, China)
15.1.4.16. Envision (China)
15.1.4.17. Rockwell Automation (US)
15.1.4.18. Hyundai Motor Group (South Korea)
15.1.4.19. Schneider Electric (France)
15.1.4.20. Zhejiang Windey Co.(China)
15.1.4.21. Taiyuan Heavy Industry Co., (China)
15.1.4.22. Sinovel (China)

List of Figures
FIG. 1 Floating Wind Turbines Market: Research Methodology
FIG. 2 Market Size Estimation – Top Down & Bottom up Approach
FIG. 3 Floating Wind Turbines Market Segmentation
FIG. 4 Floating Wind Turbines Market, by Water Depth, 2022 (US$ Bn)
FIG. 5 Floating Wind Turbines Market, by Turbine Capacity, 2022 (US$ Bn)
FIG. 6 Floating Wind Turbines Market, by Geography, 2022 (US$ Bn)
FIG. 7 Attractive Investment Proposition, by Water Depth, 2022
FIG. 8 Attractive Investment Proposition, by Turbine Capacity, 2022
FIG. 9 Attractive Investment Proposition, by Geography, 2022
FIG. 10 Global Market Share Analysis of Key Floating Wind Turbines Market Manufacturers, 2022
FIG. 11 Global Market Positioning of Key Floating Wind Turbines Market Manufacturers, 2022
FIG. 12 Floating Wind Turbines Market Value Contribution, By Water Depth, 2022 & 2030 (Value %)
FIG. 13 Floating Wind Turbines Market, by Shallow Water, Value, 2017-2030 (US$ Bn)
FIG. 14 Floating Wind Turbines Market, by Transitional water, Value, 2017-2030 (US$ Bn)
FIG. 15 Floating Wind Turbines Market, by Deep Water, Value, 2017-2030 (US$ Bn)
FIG. 16 Floating Wind Turbines Market Value Contribution, By Turbine Capacity, 2022 & 2030 (Value %)
FIG. 17 Floating Wind Turbines Market, by Up to 3 MW, Value, 2017-2030 (US$ Bn)
FIG. 18 Floating Wind Turbines Market, by 3 MW – 5 MW, 2017-2030 (US$ Bn)
FIG. 19 Floating Wind Turbines Market, by Above 5 MW, 2017-2030 (US$ Bn)
FIG. 20 Floating Wind Turbines Market, by Shopping Malls, Value, 2017-2030 (US$ Bn)
FIG. 21 Floating Wind Turbines Market, by Supermarket, 2017-2030 (US$ Bn)
FIG. 22 North America Floating Wind Turbines Market, 2017-2030 (US$ Bn)
FIG. 23 U.S. Floating Wind Turbines Market, 2017-2030 (US$ Bn)
FIG. 24 Canada Floating Wind Turbines Market, 2017-2030 (US$ Bn)
FIG. 25 Europe Floating Wind Turbines Market, 2017-2030 (US$ Bn)
FIG. 26 Germany Floating Wind Turbines Market, 2017-2030 (US$ Bn)
FIG. 27 France Floating Wind Turbines Market, 2017-2030 (US$ Bn)
FIG. 28 U.K. Floating Wind Turbines Market, 2017-2030 (US$ Bn)
FIG. 29 Italy Floating Wind Turbines Market, 2017-2030 (US$ Bn)
FIG. 30 Spain Floating Wind Turbines Market, 2017-2030 (US$ Bn)
FIG. 31 Rest of Europe Floating Wind Turbines Market, 2017-2030 (US$ Bn)
FIG. 32 Asia Pacific Floating Wind Turbines Market, 2017-2030 (US$ Bn)
FIG. 33 China Floating Wind Turbines Market, 2017-2030 (US$ Bn)
FIG. 34 Japan Floating Wind Turbines Market, 2017-2030 (US$ Bn)
FIG. 35 India Floating Wind Turbines Market, 2017-2030 (US$ Bn)
FIG. 36 South Korea Floating Wind Turbines Market, 2017-2030 (US$ Bn)
FIG. 37 South-East Asia Floating Wind Turbines Market, 2017-2030 (US$ Bn)
FIG. 38 Rest of Asia Pacific Floating Wind Turbines Market, 2017-2030 (US$ Bn)
FIG. 39 Latin America Floating Wind Turbines Market, 2017-2030 (US$ Bn)
FIG. 40 Brazil Floating Wind Turbines Market, 2017-2030 (US$ Bn)
FIG. 41 Mexico Floating Wind Turbines Market, 2017-2030 (US$ Bn)
FIG. 42 Rest of Latin America Floating Wind Turbines Market, 2017-2030 (US$ Bn)
FIG. 43 Middle East & Africa Floating Wind Turbines Market, 2017-2030 (US$ Bn)
FIG. 44 GCC Countries Floating Wind Turbines Market, 2017-2030 (US$ Bn)
FIG. 45 South Africa Floating Wind Turbines Market, 2017-2030 (US$ Bn)
FIG. 46 Rest of Middle East and Africa Floating Wind Turbines Market, 2017-2030 (US$ Bn)

List of Tables
TABLE 1 Market Snapshot: Floating Wind Turbines Market
TABLE 2 Floating Wind Turbines Market: Market Drivers Impact Analysis
TABLE 3 Floating Wind Turbines Market: Market Restraints Impact Analysis
TABLE 4 Floating Wind Turbines Market, by Competitive Benchmarking, 2022
TABLE 5 Floating Wind Turbines Market, by Geographical Presence Analysis, 2022
TABLE 6 Floating Wind Turbines Market, by Key Strategies Analysis, 2022
TABLE 7 Floating Wind Turbines Market, by Barcodes, By Region, 2017-2022 (US$ Bn)
TABLE 8 Floating Wind Turbines Market, by Barcodes, By Region, 2023-2030 (US$ Bn)
TABLE 9 Floating Wind Turbines Market, by Transitional water, By Region, 2017-2022 (US$ Bn)
TABLE 10 Floating Wind Turbines Market, by Transitional water, By Region, 2023-2030 (US$ Bn)
TABLE 11 Floating Wind Turbines Market, by Deep Water, By Region, 2017-2022 (US$ Bn)
TABLE 12 Floating Wind Turbines Market, by Deep Water, By Region, 2023-2030 (US$ Bn)
TABLE 13 Floating Wind Turbines Market, by Up to 3 MW, By Region, 2017-2022 (US$ Bn)
TABLE 14 Floating Wind Turbines Market, by Up to 3 MW, By Region, 2023-2030 (US$ Bn)
TABLE 15 Floating Wind Turbines Market, by 3 MW – 5 MW, By Region, 2017-2022 (US$ Bn)
TABLE 16 Floating Wind Turbines Market, by 3 MW – 5 MW, By Region, 2023-2030 (US$ Bn)
TABLE 17 Floating Wind Turbines Market, by Above 5 MW, By Region, 2023-2030 (US$ Bn)
TABLE 18 Floating Wind Turbines Market, by Above 5 MW, By Region, 2023-2030 (US$ Bn)
TABLE 19 Floating Wind Turbines Market, by Shopping Malls, By Region, 2017-2022 (US$ Bn)
TABLE 20 Floating Wind Turbines Market, by Shopping Malls, By Region, 2023-2030 (US$ Bn)
TABLE 21 Floating Wind Turbines Market, by Supermarkets, By Region, 2017-2022 (US$ Bn)
TABLE 22 Floating Wind Turbines Market, by Supermarkets, By Region, 2023-2030 (US$ Bn)
TABLE 23 Floating Wind Turbines Market, by Water Depth, 2017-2022 (US$ Bn)
TABLE 24 Floating Wind Turbines Market, by Water Depth, 2023-2030 (US$ Bn)
TABLE 25 Floating Wind Turbines Market, by Turbine Capacity, 2017-2022 (US$ Bn)
TABLE 26 Floating Wind Turbines Market, by Turbine Capacity, 2023-2030 (US$ Bn)
TABLE 27 Floating Wind Turbines Market, by Region, 2017-2022 (US$ Bn)
TABLE 28 Floating Wind Turbines Market, by Region, 2023-2030 (US$ Bn)
TABLE 29 North America Floating Wind Turbines Market, by Water Depth, 2017-2022 (US$ Bn)
TABLE 30 North America Floating Wind Turbines Market, by Water Depth, 2023-2030 (US$ Bn)
TABLE 31 North America Floating Wind Turbines Market, by Turbine Capacity, 2017-2022 (US$ Bn)
TABLE 32 North America Floating Wind Turbines Market, by Turbine Capacity, 2023-2030 (US$ Bn)
TABLE 33 North America Floating Wind Turbines Market, by Country, 2017-2022 (US$ Bn)
TABLE 34 North America Floating Wind Turbines Market, by Country, 2023-2030 (US$ Bn)
TABLE 35 United States Floating Wind Turbines Market, by Water Depth, 2017-2022 (US$ Bn)
TABLE 36 United States Floating Wind Turbines Market, by Water Depth, 2023-2030 (US$ Bn)
TABLE 37 United States Floating Wind Turbines Market, by Turbine Capacity, 2017-2022 (US$ Bn)
TABLE 38 United States Floating Wind Turbines Market, by Turbine Capacity, 2023-2030 (US$ Bn)
TABLE 39 Canada Floating Wind Turbines Market, by Water Depth, 2017-2022 (US$ Bn)
TABLE 40 Canada Floating Wind Turbines Market, by Water Depth, 2023-2030 (US$ Bn)
TABLE 41 Canada Floating Wind Turbines Market, by Turbine Capacity, 2017-2022 (US$ Bn)
TABLE 42 Canada Floating Wind Turbines Market, by Turbine Capacity, 2023-2030 (US$ Bn)
TABLE 43 Mexico Floating Wind Turbines Market, by Water Depth, 2017-2022 (US$ Bn)
TABLE 44 Mexico Floating Wind Turbines Market, by Water Depth, 2023-2030 (US$ Bn)
TABLE 45 Mexico Floating Wind Turbines Market, by Turbine Capacity, 2017-2022 (US$ Bn)
TABLE 46 Mexico Floating Wind Turbines Market, by Turbine Capacity, 2023-2030 (US$ Bn)
TABLE 47 Europe Floating Wind Turbines Market, by Water Depth, 2017-2022 (US$ Bn)
TABLE 48 Europe Floating Wind Turbines Market, by Water Depth, 2023-2030 (US$ Bn)
TABLE 49 Europe Floating Wind Turbines Market, by Turbine Capacity, 2017-2022 (US$ Bn)
TABLE 50 Europe Floating Wind Turbines Market, by Turbine Capacity, 2023-2030 (US$ Bn)
TABLE 51 Europe Floating Wind Turbines Market, by Country, 2017-2022 (US$ Bn)
TABLE 52 Europe Floating Wind Turbines Market, by Country, 2023-2030 (US$ Bn)
TABLE 53 Germany Floating Wind Turbines Market, by Water Depth, 2017-2022 (US$ Bn)
TABLE 54 Germany Floating Wind Turbines Market, by Water Depth, 2023-2030 (US$ Bn)
TABLE 55 Germany Floating Wind Turbines Market, by Turbine Capacity, 2017-2022 (US$ Bn)
TABLE 56 Germany Floating Wind Turbines Market, by Turbine Capacity, 2023-2030 (US$ Bn)
TABLE 57 France Floating Wind Turbines Market, by Water Depth, 2017-2022 (US$ Bn)
TABLE 58 France Floating Wind Turbines Market, by Water Depth, 2023-2030 (US$ Bn)
TABLE 59 France Floating Wind Turbines Market, by Turbine Capacity, 2017-2022 (US$ Bn)
TABLE 60 France Floating Wind Turbines Market, by Turbine Capacity, 2023-2030 (US$ Bn)
TABLE 61 United Kingdom Floating Wind Turbines Market, by Water Depth, 2017-2022 (US$ Bn)
TABLE 62 United Kingdom Floating Wind Turbines Market, by Water Depth, 2023-2030 (US$ Bn)
TABLE 63 United Kingdom Floating Wind Turbines Market, by Turbine Capacity, 2017-2022 (US$ Bn)
TABLE 64 United Kingdom Floating Wind Turbines Market, by Turbine Capacity, 2023-2030 (US$ Bn)
TABLE 65 Italy Floating Wind Turbines Market, by Water Depth, 2017-2022 (US$ Bn)
TABLE 66 Italy Floating Wind Turbines Market, by Water Depth, 2023-2030 (US$ Bn)
TABLE 67 Italy Floating Wind Turbines Market, by Turbine Capacity, 2017-2022 (US$ Bn)
TABLE 68 Italy Floating Wind Turbines Market, by Turbine Capacity, 2023-2030 (US$ Bn)
TABLE 69 Spain Floating Wind Turbines Market, by Water Depth, 2017-2022 (US$ Bn)
TABLE 70 Spain Floating Wind Turbines Market, by Water Depth, 2023-2030 (US$ Bn)
TABLE 71 Spain Floating Wind Turbines Market, by Turbine Capacity, 2017-2022 (US$ Bn)
TABLE 72 Spain Floating Wind Turbines Market, by Turbine Capacity, 2023-2030 (US$ Bn)
TABLE 73 Rest of Europe Floating Wind Turbines Market, by Water Depth, 2017-2022 (US$ Bn)
TABLE 74 Rest of Europe Floating Wind Turbines Market, by Water Depth, 2023-2030 (US$ Bn)
TABLE 75 Rest of Europe Floating Wind Turbines Market, by Turbine Capacity, 2017-2022 (US$ Bn)
TABLE 76 Rest of Europe Floating Wind Turbines Market, by Turbine Capacity, 2023-2030 (US$ Bn)
TABLE 77 Asia Pacific Floating Wind Turbines Market, by Water Depth, 2017-2022 (US$ Bn)
TABLE 78 Asia Pacific Floating Wind Turbines Market, by Water Depth, 2023-2030 (US$ Bn)
TABLE 79 Asia Pacific Floating Wind Turbines Market, by Turbine Capacity, 2017-2022 (US$ Bn)
TABLE 80 Asia Pacific Floating Wind Turbines Market, by Turbine Capacity, 2023-2030 (US$ Bn)
TABLE 81 China Floating Wind Turbines Market, by Water Depth, 2017-2022 (US$ Bn)
TABLE 82 China Floating Wind Turbines Market, by Water Depth, 2023-2030 (US$ Bn)
TABLE 83 China Floating Wind Turbines Market, by Turbine Capacity, 2017-2022 (US$ Bn)
TABLE 84 China Floating Wind Turbines Market, by Turbine Capacity, 2023-2030 (US$ Bn)
TABLE 85 Japan Floating Wind Turbines Market, by Water Depth, 2017-2022 (US$ Bn)
TABLE 86 Japan Floating Wind Turbines Market, by Water Depth, 2023-2030 (US$ Bn)
TABLE 87 Japan Floating Wind Turbines Market, by Turbine Capacity, 2017-2022 (US$ Bn)
TABLE 88 Japan Floating Wind Turbines Market, by Turbine Capacity, 2023-2030 (US$ Bn)
TABLE 89 India Floating Wind Turbines Market, by Water Depth, 2017-2022 (US$ Bn)
TABLE 90 India Floating Wind Turbines Market, by Water Depth, 2023-2030 (US$ Bn)
TABLE 91 India Floating Wind Turbines Market, by Turbine Capacity, 2017-2022 (US$ Bn)
TABLE 92 India Floating Wind Turbines Market, by Turbine Capacity, 2023-2030 (US$ Bn)
TABLE 93 South Korea Floating Wind Turbines Market, by Water Depth, 2017-2022 (US$ Bn)
TABLE 94 South Korea Floating Wind Turbines Market, by Water Depth, 2023-2030 (US$ Bn)
TABLE 95 South Korea Floating Wind Turbines Market, by Turbine Capacity, 2017-2022 (US$ Bn)
TABLE 96 South Korea Floating Wind Turbines Market, by Turbine Capacity, 2023-2030 (US$ Bn)
TABLE 97 South-East Asia Floating Wind Turbines Market, by Water Depth, 2017-2022 (US$ Bn)
TABLE 98 South-East Asia Floating Wind Turbines Market, by Water Depth, 2023-2030 (US$ Bn)
TABLE 99 South-East Asia Floating Wind Turbines Market, by Turbine Capacity, 2017-2022 (US$ Bn)
TABLE 100 South-East Asia Floating Wind Turbines Market, by Turbine Capacity, 2023-2030 (US$ Bn)
TABLE 101 South
TABLE 102 Rest of Asia Pacific Floating Wind Turbines Market, by Water Depth, 2017-2022 (US$ Bn)
TABLE 103 Rest of Asia Pacific Floating Wind Turbines Market, by Water Depth, 2023-2030 (US$ Bn)
TABLE 104 Rest of Asia Pacific Floating Wind Turbines Market, by Turbine Capacity, 2017-2022 (US$ Bn)
TABLE 105 Rest of Asia Pacific Floating Wind Turbines Market, by Turbine Capacity, 2023-2030 (US$ Bn)
TABLE 106 Latin America Floating Wind Turbines Market, by Water Depth, 2017-2022 (US$ Bn)
TABLE 107 Latin America Floating Wind Turbines Market, by Water Depth, 2023-2030 (US$ Bn)
TABLE 108 Latin America Floating Wind Turbines Market, by Turbine Capacity, 2017-2022 (US$ Bn)
TABLE 109 Latin America Floating Wind Turbines Market, by Turbine Capacity, 2023-2030 (US$ Bn)
TABLE 110 Brazil Floating Wind Turbines Market, by Water Depth, 2017-2022 (US$ Bn)
TABLE 111 Brazil Floating Wind Turbines Market, by Water Depth, 2023-2030 (US$ Bn)
TABLE 112 Brazil Floating Wind Turbines Market, by Turbine Capacity, 2017-2022 (US$ Bn)
TABLE 113 Brazil Floating Wind Turbines Market, by Turbine Capacity, 2023-2030 (US$ Bn)
TABLE 114 Argentina Floating Wind Turbines Market, by Water Depth, 2017-2022 (US$ Bn)
TABLE 115 Argentina Floating Wind Turbines Market, by Water Depth, 2023-2030 (US$ Bn)
TABLE 116 Argentina Floating Wind Turbines Market, by Turbine Capacity, 2017-2022 (US$ Bn)
TABLE 117 Argentina Floating Wind Turbines Market, by Turbine Capacity, 2023-2030 (US$ Bn)
TABLE 118 Rest of Latin America Floating Wind Turbines Market, by Water Depth, 2017-2022 (US$ Bn)
TABLE 119 Rest of Latin America Floating Wind Turbines Market, by Water Depth, 2023-2030 (US$ Bn)
TABLE 120 Rest of Latin America Floating Wind Turbines Market, by Turbine Capacity, 2017-2022 (US$ Bn)
TABLE 121 Rest of Latin America Floating Wind Turbines Market, by Turbine Capacity, 2023-2030 (US$ Bn)
TABLE 122 Middle East and Africa Floating Wind Turbines Market, by Water Depth, 2017-2022 (US$ Bn)
TABLE 123 Middle East and Africa Floating Wind Turbines Market, by Water Depth, 2023-2030 (US$ Bn)
TABLE 124 Middle East and Africa Floating Wind Turbines Market, by Turbine Capacity, 2017-2022 (US$ Bn)
TABLE 125 Middle East and Africa Floating Wind Turbines Market, by Turbine Capacity, 2023-2030 (US$ Bn)
TABLE 126 GCC Countries Floating Wind Turbines Market, by Water Depth, 2017-2022 (US$ Bn)
TABLE 127 GCC Countries Floating Wind Turbines Market, by Water Depth, 2023-2030 (US$ Bn)
TABLE 128 GCC Countries Floating Wind Turbines Market, by Turbine Capacity, 2017-2022 (US$ Bn)
TABLE 129 GCC Countries Floating Wind Turbines Market, by Turbine Capacity, 2023-2030 (US$ Bn)
TABLE 130 South Africa Floating Wind Turbines Market, by Water Depth, 2017-2022 (US$ Bn)
TABLE 131 South Africa Floating Wind Turbines Market, by Water Depth, 2023-2030 (US$ Bn)
TABLE 132 South Africa Floating Wind Turbines Market, by Turbine Capacity, 2017-2022 (US$ Bn)
TABLE 133 South Africa Floating Wind Turbines Market, by Turbine Capacity, 2023-2030 (US$ Bn)
TABLE 134 Rest of Middle East and Africa Floating Wind Turbines Market, by Water Depth, 2017-2022 (US$ Bn)
TABLE 135 Rest of Middle East and Africa Floating Wind Turbines Market, by Water Depth, 2023-2030 (US$ Bn)
TABLE 136 Rest of Middle East and Africa Floating Wind Turbines Market, by Turbine Capacity, 2017-2022 (US$ Bn)
TABLE 137 Rest of Middle East and Africa Floating Wind Turbines Market, by Turbine Capacity, 2023-2030 (US$ Bn)

Frequently Asked Questions

What is the global floating wind turbine market’s current size?

The global floating wind turbines market was valued at USD 1.2 Billion in 2022.

What is the floating wind turbine market’s expected growth rate between 2023 and 2030?

The floating wind turbines market is expected to grow at a CAGR of 80.60% between 2023 and 2030, reaching USD 75.19 Billion in 2030.

Which segment is leading the market share in terms of water depth?

Shallow water is the leading segment by water depth, holding over 43% share in value in 2022.

Which turbine capacity segment governs the demand for floating wind turbines in the World?

The Up to 3 MW segment governs the demand for floating wind turbines in the World, holding a massive share of over 80% in 2022.

Which segment is expected to post the highest CAGR during the forecast period?

The transitional water segment will post the highest CAGR during the forecast period.

Which region is fueling the growth of the floating wind turbines industry?

Asia Pacific is fueling the growth of the floating wind turbines industry, with over one-third share in 2022.

Who are the major global floating wind turbine market players?

The top players include General Electric (US),Vestas (Denmark), Siemens Gamesa (Spain), Goldwind (China), Shanghai Electric Wind Power Equipment Co. (China),ABB (Switzerland), Doosan Heavy Industries and Construction (South Korea), Hitachi (Japan), Nordex SE (Germany), EEW (Germany).

What are the major market drivers of the floating wind turbines industry?

Increasing movement in favor of producing clean energy is the major market driver.

What are the major market restraints of the floating wind turbines industry?

The need for specialized floating structures and the challenging design, construction, and installation procedures add to the upfront costs and major market restraints.

What are the major market opportunities of the floating wind turbines industry?

Manufacturers of wind turbines, creators of floating platforms, engineering companies, and specialty service providers are the major opportunities in the floating wind turbines industry.

UK Multihead Weighers Market

Published:
Report ID: 35903

Asia Pacific Modular Construction Market

Published:
Report ID: 35891

Japan Multihead Weighers Market

Published:
Report ID: 35762

Germany Multihead Weighers Market

Published:
Report ID: 35610

Hydraulic Pumps Market

Published:
Report ID: 7796

Mobile Robotics Market

Published:
Report ID: 8913

Lab Automation in Drug Discovery Market

Published:
Report ID: 32470

Europe Rotary Kiln Market

Published:
Report ID: 30782

Motorized Drive Rollers (MDR) Market

Published:
Report ID: 23506

Cryogenic Valves Market

Published:
Report ID: 22219

Smart Wine Cellar Market

Published:
Report ID: 22795

Rotary Kiln Market

Published:
Report ID: 10095

Purchase Options

$2999
Delivery Format: Excel.
$4999
Designed for the individual purchaser.
$6999
Users located at a single corporate site or regional office.
$7999
Allowed for unlimited sharing globally within one company.
Smallform of Sample request

Have a question?

User Profile

Don’t settle for less – trust Mitul to help you find the best solution.

Report delivery within 24 to 48 hours

– Other Info –

What people say?-

User Review

I am very impressed with the information in this report. The author clearly did their research when they came up with this product and it has already given me a lot of ideas.

Jana Schmidt
CEDAR CX Technologies

– Connect with us –

Phone

+91 6232 49 3207


support

24/7 Research Support


sales@credenceresearch.com

– Research Methodology –

Going beyond the basics: advanced techniques in research methodology

– Trusted By –

Pepshi, LG, Nestle
Motorola, Honeywell, Johnson and johnson
LG Chem, SIEMENS, Pfizer
Unilever, Samsonite, QIAGEN