
Market Overview:
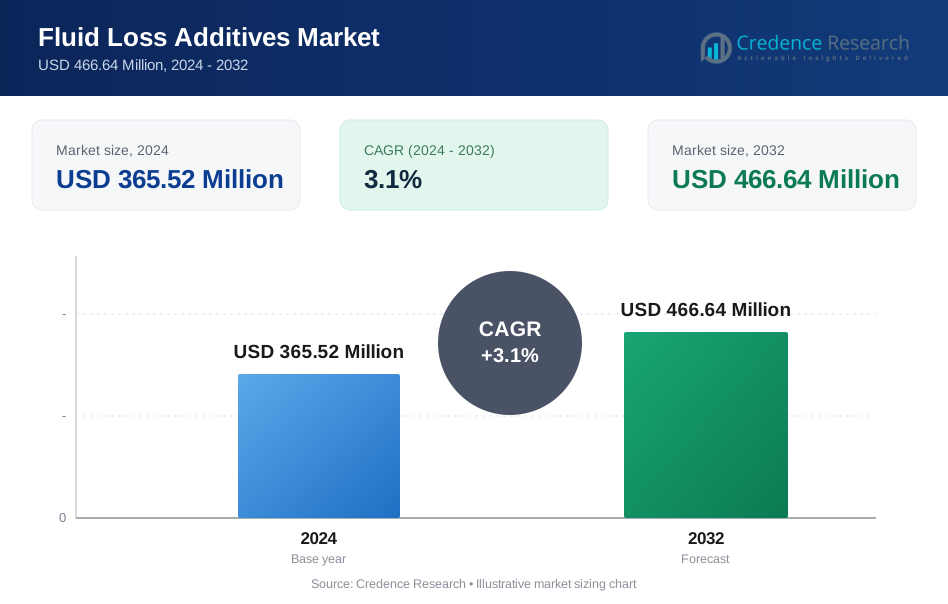
The Fluid Loss Additives market size was valued at USD 365.52 Million in 2024 and is anticipated to reach USD 466.64 Million by 2032, at a CAGR of 3.1% during the forecast period.
| REPORT ATTRIBUTE | DETAILS |
|---|---|
| Historical Period | 2020-2023 |
| Base Year | 2024 |
| Forecast Period | 2025-2032 |
| Fluid Loss Additives Market Size 2024 | USD 365.52 Million |
| Fluid Loss Additives Market, CAGR | 3.1% |
| Fluid Loss Additives Market Size 2032 | USD 466.64 Million |
The Fluid Loss Additives market features major players such as Halliburton, Schlumberger Limited, BASF SE, Dow Inc., Baker Hughes Company, Clariant AG, Lubrizol Corporation, Newpark Resources Inc., Tytan Organics Pvt. Ltd. and Aubin Group. Among these, Halliburton and Schlumberger leverage extensive upstream service networks and strong additive portfolios to maintain leadership. Regionally, North America dominates with 35% market share, benefiting from mature drilling infrastructure and high activity in unconventional resources. Additionally, rapid advancements in wellbore stability technologies and the expanding focus on cost-effective fluid management solutions further support the strong growth trajectory. The adoption of high-performance fluid loss control agents across deepwater and shale reservoirs is also contributing to regional demand.
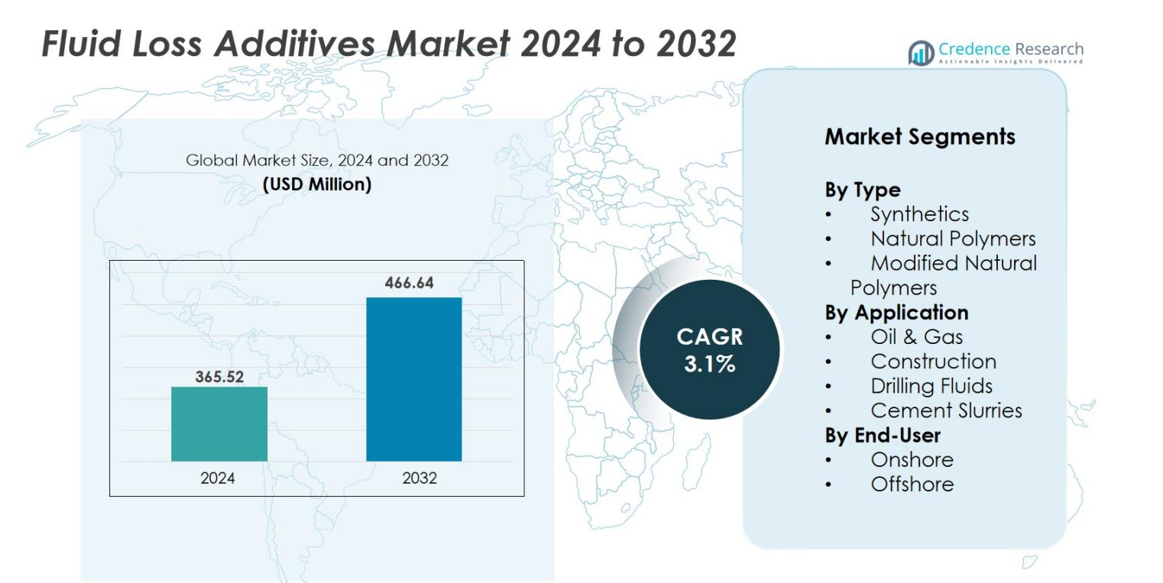
Market Insights
- The Fluid Loss Additives market size was valued at USD 365.52 Million in 2024 and is anticipated to reach USD 466.64 Million by 2032, growing at a CAGR of 3.1% during the forecast period.
- The market is primarily driven by the increasing demand for oil and gas exploration and the need for advanced fluid systems in drilling operations. This is fueled by the expansion of offshore and onshore drilling activities, particularly in regions like North America, which dominates with approximately 38.4% market share.
- Synthetic additives hold over 50% of the market share, benefiting from superior performance and versatility in challenging environments, particularly in oil and gas drilling applications.
- The drilling fluids segment is the largest application, capturing over 40% of the market share, driven by the demand for wellbore stability and fluid loss control in drilling operations.
- The offshore sector leads the end-user segment, holding around 60% of the market, driven by deep-water exploration and the need for specialized fluid loss solutions.
Market Segmentation Analysis
By Type
The Fluid Loss Additives market is primarily categorized into three types: Synthetics, Natural Polymers, and Modified Natural Polymers. Among these, the Synthetic additives dominate the market, holding 50% of the market share. This dominance is attributed to their superior performance, versatility, and high efficiency in various applications, particularly in oil and gas drilling operations. Synthetics offer enhanced fluid loss control, high thermal stability, and performance in challenging environments, making them a preferred choice. The increasing demand for advanced fluid systems in oil and gas exploration is a key driver behind the growth of synthetic additives.
- For instance, Halliburton’s BaraFLC Nano-1 wellbore sealant, applied in an HPHT well at 302 °F, cut HTHP fluid loss from 60 mL to 10 mL after two circulations and reduced total PPA from more than 50 mL to 11 mL in 30 minutes at 500 psi on a 10 µm ceramic disc, while maintaining plastic viscosity around 16 cP.
By Application
The Fluid Loss Additives market sees widespread use across multiple applications, including Oil & Gas, Construction, Drilling Fluids, and Cement Slurries. Drilling Fluids is the dominant sub-segment, holding over 40% of the market share. This is primarily driven by the expanding demand for drilling operations in the oil and gas sector. Drilling fluids are critical for maintaining wellbore stability, pressure control, and preventing fluid loss, which directly enhances operational efficiency. The demand for high-performance drilling fluids and technological advancements in drilling practices are key drivers for the growth of this sub-segment.
- For instance, Newpark Drilling Fluids reported that their FIX™ wellbore-strengthening additives achieved a fluid-loss reduction of 77% in a Woodford United States onshore well, while cutting drilling-fluid cost by around 50%.
By End-User
The Fluid Loss Additives market is segmented into Onshore and Offshore end-users, with Offshore applications taking the lead, accounting for approximately 60% of the market share. Offshore operations demand specialized fluid loss additives due to the more challenging conditions in deepwater drilling. This sub-segment is driven by growing investments in offshore oil and gas exploration, alongside the need for innovative technologies that mitigate fluid loss and improve operational efficiency. The offshore sector’s expansion and the need for advanced additives to meet these demands are the key factors fueling this growth.
Key Growth Drivers
Increasing Demand for Oil and Gas Exploration
The global demand for oil and gas is a major driver in the Fluid Loss Additives market. As energy consumption continues to rise, particularly in emerging markets, there is an increased need for exploration and production activities in both onshore and offshore locations. Fluid loss additives play a vital role in optimizing drilling operations by improving the performance of drilling fluids, reducing fluid loss, and stabilizing wellbore conditions. These factors are essential for efficient drilling operations, especially in challenging environments such as deepwater and high-temperature wells. With the continual growth of offshore exploration and the expansion of shale oil and gas projects, the demand for fluid loss additives is expected to grow significantly.
- For instance, Halliburton launched SentinelCem Pro, a single-sack lightweight lost-circulation cement system designed for severe to total losses in deepwater wells, featuring thixotropic properties that allow penetration into fractured formations while maintaining early compressive strength to enable rapid return to drilling operations.
Technological Advancements in Fluid Systems
Technological innovations in fluid systems are accelerating the demand for advanced fluid loss additives. As drilling operations become more complex and involve deeper wells and harsher conditions, there is a growing need for additives that enhance the efficiency and stability of drilling fluids. New formulations of fluid loss additives are being developed with improved properties, such as greater temperature resistance, better fluid retention, and enhanced ability to function under high-pressure conditions. These advancements are enabling more efficient and cost-effective drilling operations, particularly in remote and offshore locations. Moreover, the integration of automation, data analytics, and real-time monitoring systems in drilling operations is driving the need for additives that ensure fluid integrity throughout the drilling process.
- For instance, in a published study, a water-based drilling fluid with a locally sourced composite additive of 10 g (95% Detarium microcarpum + 5% rice husk) reduced the fluid-loss volume to 10 mL under API LTLP test conditions, which matched the performance previously achieved by 4 g of CMC in the same base fluid
Rising Environmental Concerns and Regulatory Pressures
Environmental regulations are playing an increasingly critical role in the growth of the Fluid Loss Additives market. As industries become more environmentally conscious, there is a growing emphasis on sustainable practices in drilling operations. Regulatory bodies are implementing stricter environmental standards, particularly in relation to the chemicals used in drilling fluids. This has led to the development of eco-friendly fluid loss additives that reduce harmful environmental impacts while still maintaining performance standards. Manufacturers are focusing on creating additives that are biodegradable, non-toxic, and compliant with environmental standards, which are gaining popularity in the market..
Key Trends & Opportunities
Shift Toward Synthetic and Eco-friendly Additives
There is a noticeable trend in the Fluid Loss Additives market toward the use of synthetic and eco-friendly additives. As environmental concerns increase and regulations become more stringent, both oil and gas companies and manufacturers are increasingly adopting synthetic additives that are more efficient and environmentally friendly. These additives offer enhanced performance, such as better fluid retention, high-temperature stability, and reduced environmental impact. Additionally, synthetic additives are less likely to cause harm to the surrounding ecosystem compared to traditional chemicals, making them a popular choice in offshore and environmentally sensitive areas.
- For instance, BASF’s eco-efficient drilling fluid polymer Polydrill® is engineered to perform at temperatures above 400 °F while maintaining biodegradability in accordance with OECD 301 standards, allowing operators to use it in regions with strict discharge regulations. This product has been benchmarked in over 500 wells, including operations in the North Sea and Gulf of Mexico.
Integration of Advanced Technologies in Drilling Operations
The integration of advanced technologies such as automation, data analytics, and real-time monitoring systems is creating substantial opportunities in the Fluid Loss Additives market. With the rise of smart drilling technologies, companies are looking for additives that can provide consistent performance under varying conditions. Real-time monitoring systems are being used to assess the effectiveness of drilling fluids and additives, allowing for precise adjustments to optimize fluid loss control and improve overall wellbore stability. Moreover, automation is streamlining the fluid management process, which enhances operational efficiency and reduces downtime.
- For instance, Halliburton’s BaraLogix® Real-Time Fluid Monitoring System integrates intelligent sensors and cloud-based analytics to continuously measure filtrate loss, density, and rheology.
Key Challenges
High Cost of Advanced Additives
While the demand for advanced fluid loss additives is rising, the high cost of these specialized additives presents a significant challenge in the market. Synthetic and high-performance additives are generally more expensive compared to traditional options, which can deter smaller players in the industry or those with limited budgets from adopting these solutions. The cost of raw materials, production processes, and regulatory compliance for eco-friendly additives also adds to the price point. As a result, companies operating in regions with budget constraints may be reluctant to invest in these high-cost additives, even though they offer better performance and environmental benefits.
Fluctuations in Raw Material Prices
Fluctuations in raw material prices are another key challenge faced by manufacturers in the Fluid Loss Additives market. The production of fluid loss additives, especially synthetic and modified natural polymers, relies on the availability and cost of specific chemicals and raw materials, which are subject to price volatility. Global supply chain disruptions, geopolitical factors, and changing demand for petrochemicals can lead to unpredictable costs for manufacturers, making it difficult to forecast pricing and manage profit margins. Additionally, the growing trend toward sustainable, eco-friendly additives often requires the use of specialized, sometimes more expensive, materials.
Regional Analysis
North America
North America remains the largest region in the fluid loss additives market, holding 35% of global revenue. This dominance stems from high levels of oil and gas exploration especially unconventional shale gas and extensive adoption of advanced drilling fluids and technologies. The United States in particular drives the market, with manufacturers and service providers based in the region leveraging robust regulatory frameworks and mature upstream operations. Growth is further supported by rising offshore and onshore drilling activities and demand for high‑performance additives in challenging conditions.
Europe
Europe accounts for 22% of the global fluid loss additives market. The region benefits from a strong presence of established chemical producers, stringent environmental standards, and steady demand from oil & gas and construction sectors. Mature drilling operations in the North Sea and regulatory emphasis on sustainable additives drive innovation and supply of premium products. However, slower upstream expansion compared to emerging regions means moderate rather than exponential growth in the near term.
Asia Pacific
The Asia Pacific region is emerging rapidly in the fluid loss additives market, holding around 20% of global share. Increasing industrialization, infrastructure development, and a growing oil & gas sector in countries like China, India, and Southeast Asia are significant drivers. The region offers considerable growth potential as onshore and offshore exploration intensifies, and local additive manufacturers expand capacity. Rapid expansion of drilling activities in deepwater and high‑temperature wells further boosts demand for specialized fluid loss control additives.
Middle East & Africa (MEA)
The Middle East & Africa region represents roughly 14% of the global market. The region’s large oil reserves, rising deep‑water exploration, and increasing investment in oilfield services underpin this share. Gulf Cooperation Council (GCC) nations in particular are pushing heavier drilling operations and demanding high‑performance additives. The region also presents opportunities for tailored fluid loss solutions adapted to high‑salinity and high‑temperature environments, although regulatory and supply chain challenges can limit growth.
Latin America
Latin America holds the remaining 12% of the fluid loss additives market. The region’s share is constrained by relatively modest drilling activity in certain countries and fewer large‑scale unconventional operations compared with North America and Asia Pacific. Nevertheless, Brazil, Mexico, and other Latin American nations are steadily increasing exploration and production, presenting incremental growth opportunities. Suppliers active in the region must address local logistics, regulatory compliance, and competitive pressures to capture share.
Market Segmentations
By Type
- Synthetics
- Natural Polymers
- Modified Natural Polymers
By Application
- Oil & Gas
- Construction
- Drilling Fluids
- Cement Slurries
By End-User
- Onshore
- Offshore
By Geography
- North America
- U.S.
- Canada
- Mexico
- Europe
- Germany
- France
- U.K.
- Italy
- Spain
- Rest of Europe
- Asia Pacific
- China
- Japan
- India
- South Korea
- South-east Asia
- Rest of Asia Pacific
- Latin America
- Brazil
- Argentina
- Rest of Latin America
- Middle East & Africa
- GCC Countries
- South Africa
- Rest of the Middle East and Africa
Competitive Landscape
The competitive landscape of the fluid loss additives market is moderately consolidated and shaped by several global and regional players who differentiate themselves through technological innovation, strategic partnerships, and geographic expansion. Major players such as Halliburton, Schlumberger Limited, BASF SE, Clariant AG, Newpark Resources Inc., Tytan Organics Pvt. Ltd. and Aubin Group dominate the market by leveraging extensive product portfolios and strong upstream customer relationships. These companies are actively investing in R&D of advanced fluid loss additives that offer enhanced temperature resistance, compatibility with diverse drilling fluids and reduced environmental impact. Emerging players and regional specialists are targeting niche applications, such as ultra‑deepwater or ultra‑high‑temperature wells, enabling them to carve out market share. Overall, success in this sector hinges on innovation, service integration, and proximity to major oilfield service operations.
Key Player Analysis
- BASF SE
- Baker Hughes Company
- Clariant AG
- Tytan Organics Pvt. Ltd.
- Lubrizol Corporation
- Halliburton
- Newpark Resources Inc.
- Schlumberger Limited
- Aubin Group
- Dow Inc.
Recent Developments
- In September 2024, Newpark Resources, Inc. completed the sale of its Fluids Systems segment (which covers fluid-loss additives among other drilling fluids) to SCF Partners, Inc..
- In September 2023, Halliburton Company introduced the BaraFLC® Nano-1 nanocomposite well-bore sealant to enhance fluid loss control in high-temperature, water-based drilling fluid systems.
- In August 2023, Italmatch Chemicals Group launched Aubin® CFL-600L, its first cement-additive fluid loss product under the Aubin® brand, qualified for use up to 200 °C (400 °F) in oil-field cementing operations.
Report Coverage
The research report offers an in-depth analysis based on Type, Application, End-User and Geography. It details leading market players, providing an overview of their business, product offerings, investments, revenue streams, and key applications. Additionally, the report includes insights into the competitive environment, SWOT analysis, current market trends, as well as the primary drivers and constraints. Furthermore, it discusses various factors that have driven market expansion in recent years. The report also explores market dynamics, regulatory scenarios, and technological advancements that are shaping the industry. It assesses the impact of external factors and global economic changes on market growth. Lastly, it provides strategic recommendations for new entrants and established companies to navigate the complexities of the market.
Future Outlook
- The Fluid Loss Additives market will consistently grow as demand for efficient drilling and well‑bore stability rises in hydrocarbon exploration.
- Additive manufacturers will increasingly focus on eco‑friendly and biodegradable formulations to meet stricter regulatory requirements and sustainability goals.
- Technological advancements such as nanotechnology, smart monitoring systems and data‑driven fluid management will drive innovation and product differentiation in the market.
- Emerging regions in Asia Pacific and Latin America will offer higher growth potential as drilling operations expand and infrastructure investment increases.
- The synthetic additives sub‑segment is expected to gain a larger share relative to natural polymers, driven by higher performance under high temperature and pressure conditions.
- Usage in deep‑water and ultra‑deep wells will grow significantly, fuelling demand for specialized fluid loss additives tailored to harsh drilling environments.
- Service providers and oil‑field companies will increasingly integrate additives into full‑service drilling fluid solutions, raising competitive pressure and value‑chain collaboration.
- Raw material price volatility and supply‑chain constraints will force manufacturers to optimize sourcing and adopt cost‑efficient production methods.
- Offshore operations will continue to dominate in end‑user share, but onshore unconventional drilling will increasingly adopt additives, shifting some share toward land operations.
- Market consolidation is likely as leading players expand portfolios and acquire niche specialist companies to strengthen their additive technology and regional presence.
Request a Free Sample
Fill in your details and we'll send you a free sample report.
- Sample data tables & charts
- Research methodology
Need a Custom Version of This Report?
Tailor the scope, geography, or segments to your exact requirements.
- Custom geography or segment scope
- Direct access to our analyst team
Frequently Asked Questions
What is the current market size for Fluid Loss Additives market, and what is its projected size in 2032?
At what Compound Annual Growth Rate is the Fluid Loss Additives market projected to grow between 2025 and 2032?
Which Fluid Loss Additives market segment held the largest share in 2024?
What are the primary factors fueling the growth of the Fluid Loss Additives market?
Who are the leading companies in the Fluid Loss Additives market?
Table of Content
Chapter 1. Report Introduction
- 1.1 Report Description & Purpose
- 1.1.1 Report Title & Market Definition
- 1.1.2 Unique Selling Propositions (USP) & Key Differentiators
- 1.1.3 Value Proposition for Stakeholders
- 1.2 Research Objectives
- 1.2.1 Market Sizing Objectives (Volume & Revenue)
- 1.2.2 Segmentation Objectives
- 1.2.3 Competitive Intelligence Objectives
- 1.2.4 Forecast & Scenario Objectives
- 1.3 Report Scope
- 1.3.1 Fluid Loss Additives Scope – Types & Subtypes Covered
- 1.3.2 Geographic Scope – Regions & Countries Covered
- 1.3.3 Historical Period, Base Year & Forecast Period (2024; forecast to 2032)
- 1.3.4 Inclusions & Exclusions
- 1.4 HS Code & Classification Framework
- 1.5 Currency, Units & Pricing Basis
- 1.6 Target Stakeholders
- 1.7 Limitations & Assumptions
Chapter 2. Executive Summary
- 2.1 Global Fluid Loss Additives Market Snapshot
- 2.1.1 Market Size – Historical (2024) & Forecast (2024-2032) (2024: USD 365.52 Million → 2032: USD 466.64 Million)
- 2.1.2 Volume & Revenue – Global Totals
- 2.1.3 Key Market Highlights – Top Five Facts
- 2.2 Fluid Loss Additives Market Segmentation Snapshot
- 2.2.1 Market Split by Region – 2024 vs. 2032
- 2.3 Competitive Snapshot
- 2.3.1 Top 10 Players by Revenue Share – 2024
- 2.3.2 Top 10 Players by Volume Share – 2024
- 2.3.3 Recent Strategic Developments (18-Month Summary)
- 2.4 Key Investment Highlights & Strategic Conclusions
Chapter 3. Fluid Loss Additives Market Dynamics & Industry Analysis
- 3.1 Market Overview & Context
- 3.1.1 Fluid Loss Additives Market Position in the Broader Automotive Value Chain
- 3.1.2 OEM vs. Replacement Market Dynamics
- 3.1.3 Market Maturity & Development Stage by Region
- 3.2 Fluid Loss Additives Market Drivers
- 3.3 Fluid Loss Additives Market Restraints & Challenges
- 3.4 Fluid Loss Additives Market Opportunities
- 3.5 Porter's Five Forces Analysis
- 3.5.1 Threat of New Entrants
- 3.5.2 Bargaining Power of Suppliers
- 3.5.3 Bargaining Power of Buyers
- 3.5.4 Threat of Substitutes
- 3.5.5 Competitive Rivalry – Intensity Assessment
- 3.6 Fluid Loss Additives Value Chain Analysis
- 3.6.1 Upstream – Raw Material/Input Suppliers
- 3.6.1.1 Raw Material/Input 1
- 3.6.1.2 Raw Material/Input 2
- 3.6.1.3 Raw Material/Input 3
- 3.6.2 Midstream – Production/Manufacturing/Service Delivery
- 3.6.2.1 Production/Process Overview
- 3.6.2.2 Key Facility Locations & Capacity by Manufacturer
- 3.6.3 Downstream – Distribution & End Consumer
- 3.6.3.1 Primary Channel – B2B/OEM
- 3.6.3.2 Secondary Channels – Dealer, Retail, Online, Direct
- 3.6.4 Value Chain Profitability Analysis
- 3.6.1 Upstream – Raw Material/Input Suppliers
- 3.7 PESTEL Analysis
- 3.7.1 Political Factors
- 3.7.2 Economic Factors
- 3.7.3 Social Factors
- 3.7.4 Technological Factors
- 3.7.5 Environmental Factors
- 3.7.6 Legal Factors
- 3.8 Fluid Loss Additives Supply Chain Analysis
- 3.8.1 Raw Material/Input Supply Risk Assessment
- 3.8.2 Manufacturing Concentration Risk (Geographic Exposure)
- 3.8.3 Trade Disruption Impact Analysis
- 3.9 Regulatory & Policy Landscape
Note: The regulatory and policy landscape section covers regulations based on their applicability to the market, Fluid Loss Additives category, geography, and scope of the study. Only regulatory frameworks with a material impact on operations, compliance, trade, sustainability, or market access are analyzed in detail.
Chapter 4. Key Investment Pockets & Opportunity Analysis
- 4.1 Fluid Loss Additives Market Attractiveness Analysis
- 4.1.1 By Region – Investment Attractiveness Matrix (Volume × CAGR)
- 4.2 Absolute Revenue Growth Opportunity
- 4.2.1 By Region – Absolute USD Growth Through 2032
- 4.3 Incremental Volume Opportunity
- 4.3.1 By Region – Incremental Volume Through 2032
- 4.3.2 Segment – Incremental Volume
- 4.4 Emerging Submarket Opportunity Deep Dive (Subject to Applicability)
- 4.5 Emerging Market Opportunity Scorecards
- 4.5.1 United States
- 4.5.2 Europe
- 4.5.3 Asia
- 4.5.4 Middle East & Africa
Note: Emerging Market Opportunity Scorecards will be included based on relevance and strategic importance. Regions listed are indicative and may vary depending on data availability and market dynamics.
Chapter 5. Fluid Loss Additives Import-Export Analysis & Trade Flows
- 5.1 Global Trade Overview
- 5.1.1 Global Export Value by Country (2024)
- 5.1.2 Global Export Volume by Country (2024)
- 5.1.3 Global Import Value by Country (2024)
- 5.1.4 Global Import Volume by Country (2024)
- 5.1.5 Net Trade Balance by Country (2024)
- 5.2 Export Analysis – Segment
- 5.2.1 Type 1 (HS Code)
- 5.2.2 Type 2 (HS Code)
- 5.2.3 Type 3 (HS Code)
- 5.2.4 Type 4 (HS Code)
- 5.2.5 Type 5 (HS Code)
- 5.3 Import Analysis – Segment
- 5.3.1 Type 1 (HS Code)
- 5.3.2 Type 2 (HS Code)
- 5.3.3 Type 3 (HS Code)
- 5.3.4 Type 4 (HS Code)
- 5.3.5 Type 5 (HS Code)
- 5.4 Average Unit Trade Prices
- 5.4.1 Average Export Price – Segment & Country
- 5.4.2 Average Import Price – Segment & Source Country
- 5.4.3 Price Trends (2024)
- 5.5 Key Trade Route Analysis
- 5.5.1 Trade Route 1
- 5.5.2 Trade Route 2
- 5.5.3 Trade Route 3
- 5.5.4 Trade Route 4
- 5.5.5 Trade Route 5
- 5.6 Trade Policy Impact Assessment
- 5.6.1 US Anti-Dumping & Section 301 Tariffs
- 5.6.2 EU Customs Union Impact
- 5.6.3 Major Free Trade Agreements
- 5.6.4 USMCA Rules of Origin
Note: Trade policy analysis will be included only where relevant to the Fluid Loss Additives market.
Chapter 6. Competitive Landscape & Company Benchmarking
- 6.1 Fluid Loss Additives Market Concentration & Structure
- 6.1.1 Herfindahl-Hirschman Index (HHI) – vs. 2024
- 6.1.2 Tier 1, Tier 2 & Tier 3 Market Structure
- 6.1.3 Global, Regional & Local Player Dynamics
- 6.2 Fluid Loss Additives Market Share Analysis – 2024
- 6.2.1 Global Revenue Share by Company
- 6.2.2 Global Volume Share by Company
- 6.2.3 Regional Revenue Share
- 6.2.4 Market Share Evolution ( vs. 2024)
- 6.2.5 OEM Segment Share by Company
- 6.2.6 Replacement Segment Share by Company
- 6.3 Production/Delivery Capacity & Facility Analysis
- 6.3.1 Global Installed Capacity
- 6.3.2 Capacity Utilization Rates
- 6.3.3 Production/Output Volume
- 6.3.4 Facility Locations & Capacity Map
- 6.3.5 Planned Capacity Additions
- 6.4 Fluid Loss Additives Competitive Benchmarking Matrix
- 6.4.1 Revenue, Volume, CAGR & Profitability Comparison
- 6.4.2 Channel Revenue Mix
- 6.4.3 Geographic Revenue Exposure
- 6.4.4 R&D Intensity
- 6.4.5 Sustainability Maturity
- 6.5 Strategic Developments in Fluid Loss Additives (Last 24 Months)
- 6.5.1 Mergers, Acquisitions & Divestments
- 6.5.2 New Fluid Loss Additives Launches
- 6.5.3 Facility Expansions
- 6.5.4 Strategic Alliances, Joint Ventures & Partnerships
- 6.5.5 Distribution Expansion & Market Entry
- 6.5.6 Sustainability & ESG Initiatives
- 6.6 Competitive Strategy Mapping
- 6.6.1 Leader, Challenger, Follower & Niche Classification
- 6.6.2 Pricing Strategy Comparison
- 6.6.3 Channel Strategy Matrix
Note: Strategic developments are included based on their materiality and the availability of reliable information.
Chapter 7. Global Fluid Loss Additives Market – By Distribution Channel
- 7.1 Segment Overview
- 7.1.1 Volume & Revenue Split by Channel (2024 & 2032)
- 7.1.2 Channel Mix Evolution (2024-2032)
Chapter 8. Regional Market Analysis – Global Overview
- 8.1 Global Regional Overview
- 8.1.1 Regional Volume Share
- 8.1.2 Regional Revenue Share
- 8.1.3 Regional Volume by Region
- 8.1.4 Regional Revenue by Region
- 8.1.5 Regional Forecast Through 2032
- 8.2 Cross-Regional Segment Analysis
- 8.2.1 By Distribution Channel
- 8.2.2 By Brand/Price Tier
Chapter 9. North America Fluid Loss Additives Market
- 9.1 United States
- 9.2 Canada
- 9.3 Mexico
Chapter 10. Europe Fluid Loss Additives Market
- 10.1 Germany
- 10.2 France
- 10.3 Italy
- 10.4 United Kingdom
- 10.5 Spain
- 10.6 Poland
- 10.7 Russia
- 10.8 Netherlands
- 10.9 Belgium
- 10.10 Sweden
- 10.11 Denmark
- 10.12 Norway
- 10.13 Rest of Europe
Chapter 11. Asia Pacific Fluid Loss Additives Market
- 11.1 China
- 11.2 India
- 11.3 Japan
- 11.4 South Korea
- 11.5 Thailand
- 11.6 Indonesia
- 11.7 Vietnam
- 11.8 Malaysia
- 11.9 Australia
- 11.10 Rest of Asia Pacific
Chapter 12. Latin America Fluid Loss Additives Market
- 12.1 Brazil
- 12.2 Argentina
- 12.3 Colombia
- 12.4 Chile
- 12.5 Rest of Latin America
Chapter 13. Middle East Fluid Loss Additives Market
- 13.1 Saudi Arabia
- 13.2 United Arab Emirates
- 13.3 Turkey
- 13.4 Israel
- 13.5 Iran
- 13.6 Rest of the Middle East
Chapter 14. Africa Fluid Loss Additives Market
- 14.1 South Africa
- 14.2 Egypt
- 14.3 Nigeria
- 14.4 Morocco
- 14.5 Rest of Africa
Chapter 15. Fluid Loss Additives Company Profiles
- 15.1 [Company 01]
- 15.1.1 Company Overview
- 15.1.2 Key Management Personnel
- 15.1.3 Products & Services Portfolio
- 15.1.4 Financial Performance
- 15.1.5 Key Market Focus & Geographic Presence
- 15.1.6 Recent Developments & Strategic Initiatives
Note: The company profile list is preliminary and may change based on research findings, market developments, data availability, and client requirements.
Chapter 16. Appendices
- Appendix A – List of Abbreviations & Acronyms
- Appendix B – Industry Classification Code Reference – Full Series
- Appendix C – Production & Capacity Data Tables
- Appendix D – End-Use & Demand Base Tables
- Appendix E – Consumption & Replacement Rate Assumptions
- Appendix F – ASP Reference Tables
- Appendix G – Manufacturing & Facility Database
- Appendix H – Import-Export Data Tables
- Appendix I – Regulatory Summary Tables
- Appendix J – Primary Research Participant List (Anonymized)
- Appendix K – Primary Research Questionnaire Framework
- Appendix L – Data Sources & Bibliography
- Appendix M – Market Size Divergence & Source Comparison
Chapter 17. Research Methodology
- 17.1 Research Framework & Philosophy
- 17.2 Secondary Research – Sources, Hierarchy & Data Extraction
- 17.3 Data Modeling – Bottom-Up & Top-Down Market Sizing
- 17.4 Primary Research – Stakeholder Framework, LOI & Sample Sizes
- 17.5 Forecast Methodology – Regression, Scenario & Sensitivity Analysis
- 17.6 Quality Control – Four-Layer Validation Framework
- 17.7 Limitations & Standard Assumptions
- 17.8 Disclaimer
