
Functional Cosmetics Market Overview:
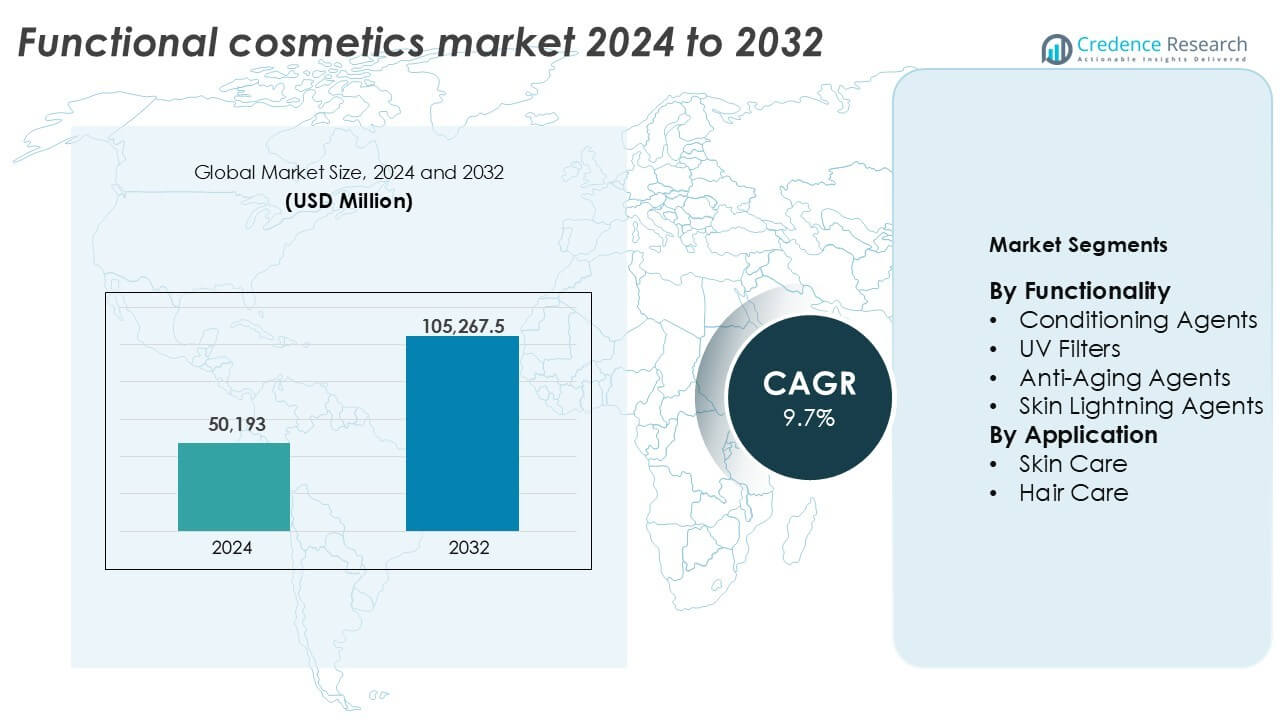
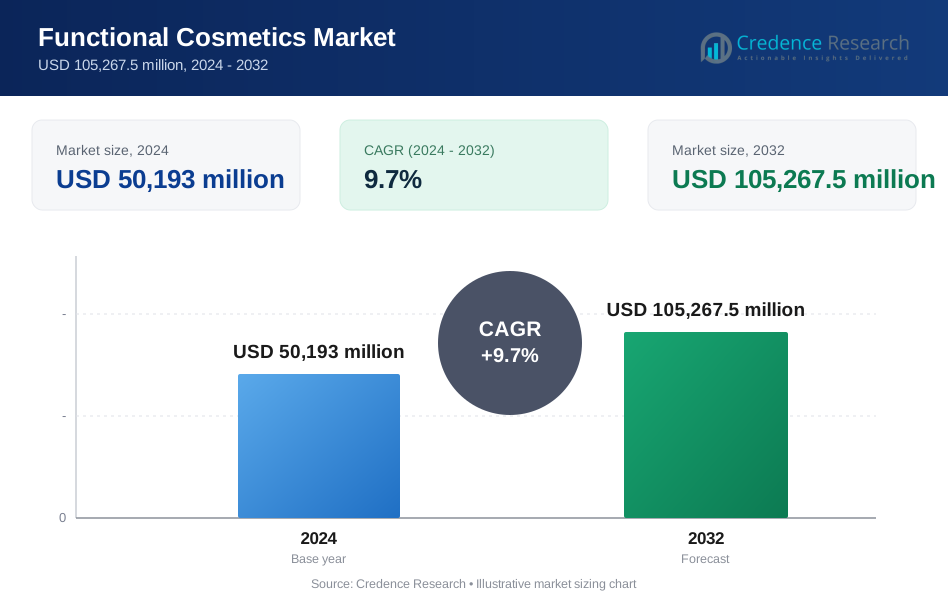
The Functional Cosmetics Market size was valued at USD 50,193 million in 2024 and is anticipated to reach USD 105,267.5 million by 2032, at a CAGR of 9.7% during the forecast period.
| REPORT ATTRIBUTE | DETAILS |
|---|---|
| Historical Period | 2020-2023 |
| Base Year | 2024 |
| Forecast Period | 2025-2032 |
| Functional Cosmetics Market Size 2024 | USD 50,193 million |
| Functional Cosmetics Market, CAGR | 9.7% |
| Functional Cosmetics Market Size 2032 | USD 105,267.5 million |
Functional Cosmetics Market Insights
- Rising consumer demand for multifunctional skincare and haircare products with anti-aging, hydration, and UV-protection benefits is fueling market growth.
- Clean-label and natural ingredient trends are reshaping product development, with growing preference for botanicals, probiotics, and dermatologically tested actives.
- Leading players like L'Oréal, Estée Lauder, and Shiseido drive innovation through R&D investments and premium product launches, while competition intensifies from niche and regional brands.
- Asia Pacific leads with 34% market share, followed by North America at 28% and Europe at 24%; skincare holds the dominant application share at 60%, while conditioning agents account for over 35% of the functional ingredient segment.
Functional Cosmetics Market Segmentation Analysis:
By Functionality
The Functional Cosmetics Market by functionality is dominated by the conditioning agents segment, holding over 35% market share in 2024. Conditioning agents are widely used in both hair and skin care products for improving texture, feel, and moisture retention. Their high adoption in shampoos, conditioners, and serums boosts their demand across personal care brands. UV filters and anti-aging agents follow, driven by increasing consumer awareness of sun protection and aging prevention. Skin lightening agents show steady growth in emerging markets, supported by shifting beauty standards and rising disposable incomes in Asia-Pacific and the Middle East.
- For instance, BASF’s Luviset® and Cetiol® conditioning polymers are used in over 150 global personal care brands across hair styling and moisturizing products.
By Application
The skincare segment leads the Functional Cosmetics Market by application, accounting for nearly 60% of total market share in 2024. Consumers seek multifunctional skincare solutions with anti-aging, hydration, and sun protection benefits. Demand is rising for products like BB creams, serums, and moisturizers formulated with active ingredients. Hair care is the second-largest segment, supported by growing demand for scalp treatments, anti-frizz products, and color protection solutions. Urbanization, rising pollution levels, and greater focus on personal grooming continue to drive growth in both application areas.
- For instance, L'Oréal’s Revitalift line alone surpassed €1.4 billion in annual global sales by 2023, driven by peptides and pro-retinol-infused formulations.
Key Growth Drivers
Rising Consumer Demand for Multi-Functional Personal Care Products
Consumers now expect more from cosmetic products, seeking solutions that offer both aesthetic and therapeutic benefits. Functional cosmetics deliver added value such as anti-aging, hydration, UV protection, and skin repair, meeting growing demand for time-saving, all-in-one products. This trend is especially strong among urban professionals and Gen Z buyers who prioritize convenience and efficacy. Skincare and hair care products infused with antioxidants, peptides, and UV filters are gaining popularity due to their clinically backed claims. The wellness-driven lifestyle further encourages purchases of dermatologically tested, functional products over conventional cosmetics. Growing social media influence and beauty influencers also educate consumers on product functionality, accelerating market demand.
- For example, Estée Lauder reported that skincare accounted for 52% of its total global net sales in fiscal year 2023, amounting to $8.20 billion.
Advancements in Cosmetic Science and Biotechnology
Ongoing innovation in bioactive ingredients and delivery systems has significantly elevated the performance of functional cosmetics. Biotechnology allows for the extraction and stabilization of active compounds that provide visible skin or hair benefits. Encapsulation technologies such as liposomes and nanocarriers enhance ingredient penetration, ensuring better efficacy and long-lasting effects. Research in peptides, ceramides, probiotics, and plant stem cells continues to yield next-gen functional formulations. These innovations support product differentiation and premium pricing strategies for brands. As consumers seek measurable results from their beauty routines, products backed by clinical trials and scientific validation are gaining strong traction in developed markets.
- For instance, Shiseido developed ImuGenerationRED Technology using botanical extracts (including fermented roselle extract and heart leaf extract) and has deployed it across its current Ultimune serum line (launched in July 2021). The entire Ultimune series has sold over 20 million global units cumulatively since its original launch in 2014.
Expanding Aging Population and Preventive Skincare Focus
Globally, aging populations are contributing to higher demand for functional cosmetics, particularly anti-aging products. Consumers aged 40 and above are turning to skincare enriched with retinol, hyaluronic acid, and peptides to reduce signs of aging. The emphasis is not only on treating wrinkles and age spots but also on prevention. Younger consumers in their late 20s and 30s are increasingly adopting preventive skincare regimens that include sun protection and antioxidants. This shift creates a strong foundation for recurring demand across age groups. Market growth is particularly robust in Asia and Europe, where aging demographics are more pronounced and skincare routines are deeply ingrained in daily habits.
Key Trend & Opportunities
Natural & Clean Label Functional Ingredients
Consumers are increasingly choosing functional cosmetics formulated with natural and clean-label ingredients. Botanical extracts, essential oils, marine actives, and fermented ingredients are gaining favor, especially in Asian markets. Transparency in labeling and the absence of harmful additives like parabens, sulfates, and artificial fragrances have become key purchasing factors. This shift opens significant opportunities for brands to align with sustainability and health-conscious consumer values. Regulatory support for organic and vegan formulations further encourages the transition toward cleaner products. As demand for “green beauty” surges, companies focusing on ethically sourced and eco-friendly functional ingredients are positioned to capture higher market share.
- For instance, Garnier, part of the L'Oréal Group, launched its Green Beauty initiative in 2020. As part of this initiative, the Garnier Bio line is certified organic by Ecocert (specifically under the COSMOS Organic standard) and recognized as vegan, containing no animal-derived ingredients.
Growing Popularity of Personalized and Targeted Functional Cosmetics
Advances in AI, diagnostics, and skin microbiome research are enabling personalized skincare solutions. Functional cosmetics tailored to individual skin types, conditions, and climates are gaining momentum, especially via direct-to-consumer platforms. Brands are integrating online skin assessments and smart beauty devices to recommend precise formulations. The demand for hyper-targeted solutions in areas like anti-aging, acne treatment, and pigmentation offers strong revenue potential. Consumers now expect products to address specific needs rather than generic concerns. This trend allows brands to develop niche, premium offerings while building loyalty through customized experiences. The intersection of personalization and functionality represents a key growth frontier.
Key Challenges
High Cost of Research, Development, and Ingredient Sourcing
Developing functional cosmetics requires significant R&D investment, especially for clinically tested formulations with proven efficacy. The cost of sourcing bioactive ingredients, developing stable delivery systems, and conducting trials adds to overall product development expenses. Smaller companies face barriers to entry due to high upfront costs and complex formulation standards. In addition, the demand for natural, sustainable ingredients often leads to supply chain challenges and price fluctuations. These factors can affect pricing strategies, particularly in price-sensitive markets. To remain competitive, brands must balance innovation with cost efficiency, while ensuring safety and regulatory compliance across geographies.
Regulatory Complexity and Evolving Compliance Standards
Functional cosmetics often fall into a regulatory gray area between pharmaceuticals and traditional cosmetics. Different countries have varying definitions and requirements for claims, safety, labeling, and permissible ingredients. This variation complicates product formulation and market entry, especially for global brands. The growing scrutiny of product claims—such as anti-aging or whitening effects—requires strict clinical validation and documentation. Non-compliance can lead to fines, recalls, or loss of consumer trust. As regulatory frameworks evolve, especially in markets like the EU, Japan, and the U.S., companies must invest in legal expertise and compliance systems. This adds operational complexity and slows down time-to-market.
Regional Analysis
North America
North America accounted for over 28% of the global functional cosmetics market share in 2024. Strong consumer awareness, high disposable income, and demand for premium skincare drive regional growth. The U.S. leads, with wide adoption of anti-aging and UV-protection products. Dermatologist-recommended brands and clinically tested formulations attract both younger and aging populations. Retail innovation and online platforms expand market reach. Canada also shows rising interest in clean-label and natural functional cosmetics. The region benefits from strong R&D, brand innovation, and regulatory support for advanced product launches, especially in skincare and hybrid cosmetics.
Europe
Europe held approximately 24% of the functional cosmetics market share in 2024, supported by high consumer preference for safe, sustainable, and multifunctional products. Germany, France, and the U.K. lead demand, driven by advanced beauty routines and regulatory alignment with safety standards. Anti-aging and skin-lightening agents are widely used across mature demographics. The EU’s strict cosmetic regulations encourage clean-label innovation and non-toxic formulations. Eco-conscious trends fuel demand for organic and vegan functional cosmetics. The presence of major global beauty brands and private-label growth in wellness-focused cosmetics further reinforces the region’s strong market position.
Asia Pacific
Asia Pacific dominated the functional cosmetics market with over 34% share in 2024, emerging as the largest regional market. South Korea, Japan, and China are major drivers, backed by strong beauty cultures and high skincare spending. Functional cosmetics are a staple in daily routines, with K-beauty and J-beauty trends setting global benchmarks. The region shows rapid demand for brightening, hydrating, and anti-aging solutions. Urbanization, rising middle-class income, and expanding e-commerce platforms enhance product access. Innovation in natural actives and skin microbiome-targeted products is strong. Local brands and multinationals alike invest heavily in research, personalization, and region-specific formulations.
Latin America
Latin America contributed around 7% of the global market share in 2024, with Brazil and Mexico leading the region. Economic recovery and a growing middle class fuel demand for affordable yet effective functional cosmetics. Consumers increasingly seek products with UV filters, anti-pollution actives, and conditioning agents suited to tropical climates. Brazil’s robust personal care industry promotes local innovation and domestic brand growth. Social media influence and regional influencers shape product trends, especially in skincare. Although price sensitivity remains a barrier, rising urbanization and greater retail penetration are expected to boost market growth in the coming years.
Middle East & Africa (MEA)
The Middle East & Africa held a smaller but growing share of approximately 4% in 2024. Demand is rising for skin-lightening and anti-aging cosmetics, particularly in the GCC countries and South Africa. The hot climate drives strong uptake of UV-protection and hydration-based products. Premiumization trends are visible in UAE and Saudi Arabia, where consumers prefer luxury skincare and haircare brands. Africa sees increasing penetration of functional cosmetics through e-commerce and retail expansion. Regulatory improvements and rising awareness of dermatological health support regional growth, although pricing and supply chain challenges continue to impact mass-market access.
Functional Cosmetics Market Segmentations:
By Functionality
- Conditioning Agents
- UV Filters
- Anti-Aging Agents
- Skin Lightning Agents
By Application
- Skin Care
- Hair Care
By Geography
- North America
- U.S.
- Canada
- Mexico
- Europe
- Germany
- France
- U.K.
- Italy
- Spain
- Rest of Europe
- Asia Pacific
- China
- Japan
- India
- South Korea
- South-east Asia
- Rest of Asia Pacific
- Latin America
- Brazil
- Argentina
- Rest of Latin America
- Middle East & Africa
- GCC Countries
- South Africa
- Rest of the Middle East and Africa
Competitive Landscape
The Functional Cosmetics Market features a highly competitive landscape, led by global players with strong brand portfolios and innovation pipelines. Companies like L’Oréal S.A., The Estée Lauder Companies Inc., Shiseido Company, and Procter & Gamble Co. dominate through continuous product development and dermatologically tested solutions. These firms invest heavily in R&D to enhance the efficacy of ingredients such as peptides, retinoids, and plant-based actives. Regional players like Amorepacific and Kao Corporation strengthen the market in Asia with tailored skincare innovations. Brand positioning through anti-aging, UV protection, and skin-brightening claims is key to market differentiation. Clean beauty trends and sustainability goals drive product reformulation and eco-friendly packaging. Partnerships with dermatologists, tech platforms, and retail chains help expand consumer outreach. E-commerce growth further intensifies brand competition, with digital-native brands entering the space with niche offerings. Overall, market rivalry remains high due to rapid innovation cycles and evolving consumer expectations for multifunctional, safe, and high-performance products.
Key Player Analysis
- The Clorox Company (owns Burt's Bees)
- Avon Products Inc.
- Amorepacific Corporation
- The Estée Lauder Companies Inc.
- Kao Corporation
- Mary Kay Inc.
- Unilever N.V.
- Revlon Inc.
- Coty Inc.
- Beiersdorf AG
- Johnson & Johnson Consumer Inc.
- Colgate-Palmolive Company
- L'Oréal S.A.
- Shiseido Company, Limited
- Procter & Gamble Co.
Recent Developments
- In September 2025, Doughlicious is launching its Cookie Dough Skillet range, which includes a first-of-its-kind Chocolate Chip & Banana Chunky Oat Baked Cookie Dough Skillet with Plant-Based Collagen Support and a sharing-friendly Chocolate Chip Baked Cookie Dough Skillet.
- In October 2025, Aterian, Inc. launched Tallow Skin Care, a line of beef tallow-based balms and salves under Healing Solutions. Products contain grass-fed tallow and natural ingredients, available on Amazon, Walmart, and their website.
Report Coverage
The research report offers an in-depth analysis based on Functionality, Application and Geography. It details leading market players, providing an overview of their business, product offerings, investments, revenue streams, and key applications. Additionally, the report includes insights into the competitive environment, SWOT analysis, current market trends, as well as the primary drivers and constraints. Furthermore, it discusses various factors that have driven market expansion in recent years. The report also explores market dynamics, regulatory scenarios, and technological advancements that are shaping the industry. It assesses the impact of external factors and global economic changes on market growth. Lastly, it provides strategic recommendations for new entrants and established companies to navigate the complexities of the market.
Future Outlook
- Demand for anti-aging and skin-repair cosmetics will increase across age groups.
- Skincare will remain the dominant application segment in both mass and premium categories.
- Brands will invest more in biotech-based active ingredients for enhanced efficacy.
- Growth of clean-label and vegan cosmetics will drive reformulations and eco-friendly packaging.
- Asia Pacific will continue leading the market due to strong demand in China and South Korea.
- Personalization through AI and skin diagnostics will shape future product offerings.
- Functional haircare solutions will gain traction, especially for scalp and damage repair.
- Online retail and influencer marketing will expand consumer access and brand visibility.
- Regulations on product claims and ingredient safety will become stricter across regions.
- Regional and niche brands will capture market share through targeted innovation and pricing.
Request a Free Sample
Fill in your details and we'll send you a free sample report.
- Sample data tables & charts
- Research methodology
Need a Custom Version of This Report?
Tailor the scope, geography, or segments to your exact requirements.
- Custom geography or segment scope
- Direct access to our analyst team
Frequently Asked Questions
What is the current market size for the Functional cosmetics market, and what is its projected size in 2032?
At what Compound Annual Growth Rate is the Functional cosmetics market projected to grow between 2024 and 2032?
Which Functional cosmetics market segment held the largest share in 2024?
What are the primary factors fueling the growth of the Functional cosmetics market?
Who are the leading companies in the Functional cosmetics market?
Which region commanded the largest share of the Functional cosmetics market in 2024?
Table of Content
Chapter 1. Report Introduction
- 1.1 Report Description & Purpose
- 1.1.1 Report Title & Market Definition
- 1.1.2 Unique Selling Propositions (USP) & Key Differentiators
- 1.1.3 Value Proposition for Stakeholders
- 1.2 Research Objectives
- 1.2.1 Market Sizing Objectives (Volume & Revenue)
- 1.2.2 Segmentation Objectives
- 1.2.3 Competitive Intelligence Objectives
- 1.2.4 Forecast & Scenario Objectives
- 1.3 Report Scope
- 1.3.1 Functional Cosmetics Scope – Types & Subtypes Covered
- 1.3.2 Geographic Scope – Regions & Countries Covered
- 1.3.3 Historical Period, Base Year & Forecast Period (2024; forecast to 2032)
- 1.3.4 Inclusions & Exclusions
- 1.4 HS Code & Classification Framework
- 1.5 Currency, Units & Pricing Basis
- 1.6 Target Stakeholders
- 1.7 Limitations & Assumptions
Chapter 2. Executive Summary
- 2.1 Global Functional Cosmetics Market Snapshot
- 2.1.1 Market Size – Historical (2024) & Forecast (2024-2032) (2024: USD 50,193 million → 2032: USD 105,267.5 million)
- 2.1.2 Volume & Revenue – Global Totals
- 2.1.3 Key Market Highlights – Top Five Facts
- 2.2 Functional Cosmetics Market Segmentation Snapshot
- 2.2.1 Market Split by Region – 2024 vs. 2032
- 2.3 Competitive Snapshot
- 2.3.1 Top 10 Players by Revenue Share – 2024
- 2.3.2 Top 10 Players by Volume Share – 2024
- 2.3.3 Recent Strategic Developments (18-Month Summary)
- 2.4 Key Investment Highlights & Strategic Conclusions
Chapter 3. Functional Cosmetics Market Dynamics & Industry Analysis
- 3.1 Market Overview & Context
- 3.1.1 Functional Cosmetics Market Position in the Broader Automotive Value Chain
- 3.1.2 OEM vs. Replacement Market Dynamics
- 3.1.3 Market Maturity & Development Stage by Region
- 3.2 Functional Cosmetics Market Drivers
- 3.3 Functional Cosmetics Market Restraints & Challenges
- 3.4 Functional Cosmetics Market Opportunities
- 3.5 Porter's Five Forces Analysis
- 3.5.1 Threat of New Entrants
- 3.5.2 Bargaining Power of Suppliers
- 3.5.3 Bargaining Power of Buyers
- 3.5.4 Threat of Substitutes
- 3.5.5 Competitive Rivalry – Intensity Assessment
- 3.6 Functional Cosmetics Value Chain Analysis
- 3.6.1 Upstream – Raw Material/Input Suppliers
- 3.6.1.1 Raw Material/Input 1
- 3.6.1.2 Raw Material/Input 2
- 3.6.1.3 Raw Material/Input 3
- 3.6.2 Midstream – Production/Manufacturing/Service Delivery
- 3.6.2.1 Production/Process Overview
- 3.6.2.2 Key Facility Locations & Capacity by Manufacturer
- 3.6.3 Downstream – Distribution & End Consumer
- 3.6.3.1 Primary Channel – B2B/OEM
- 3.6.3.2 Secondary Channels – Dealer, Retail, Online, Direct
- 3.6.4 Value Chain Profitability Analysis
- 3.6.1 Upstream – Raw Material/Input Suppliers
- 3.7 PESTEL Analysis
- 3.7.1 Political Factors
- 3.7.2 Economic Factors
- 3.7.3 Social Factors
- 3.7.4 Technological Factors
- 3.7.5 Environmental Factors
- 3.7.6 Legal Factors
- 3.8 Functional Cosmetics Supply Chain Analysis
- 3.8.1 Raw Material/Input Supply Risk Assessment
- 3.8.2 Manufacturing Concentration Risk (Geographic Exposure)
- 3.8.3 Trade Disruption Impact Analysis
- 3.9 Regulatory & Policy Landscape
Note: The regulatory and policy landscape section covers regulations based on their applicability to the market, Functional Cosmetics category, geography, and scope of the study. Only regulatory frameworks with a material impact on operations, compliance, trade, sustainability, or market access are analyzed in detail.
Chapter 4. Key Investment Pockets & Opportunity Analysis
- 4.1 Functional Cosmetics Market Attractiveness Analysis
- 4.1.1 By Region – Investment Attractiveness Matrix (Volume × CAGR)
- 4.2 Absolute Revenue Growth Opportunity
- 4.2.1 By Region – Absolute USD Growth Through 2032
- 4.3 Incremental Volume Opportunity
- 4.3.1 By Region – Incremental Volume Through 2032
- 4.3.2 Segment – Incremental Volume
- 4.4 Emerging Submarket Opportunity Deep Dive (Subject to Applicability)
- 4.5 Emerging Market Opportunity Scorecards
- 4.5.1 United States
- 4.5.2 Europe
- 4.5.3 Asia
- 4.5.4 Middle East & Africa
Note: Emerging Market Opportunity Scorecards will be included based on relevance and strategic importance. Regions listed are indicative and may vary depending on data availability and market dynamics.
Chapter 5. Functional Cosmetics Import-Export Analysis & Trade Flows
- 5.1 Global Trade Overview
- 5.1.1 Global Export Value by Country (2024)
- 5.1.2 Global Export Volume by Country (2024)
- 5.1.3 Global Import Value by Country (2024)
- 5.1.4 Global Import Volume by Country (2024)
- 5.1.5 Net Trade Balance by Country (2024)
- 5.2 Export Analysis – Segment
- 5.2.1 Type 1 (HS Code)
- 5.2.2 Type 2 (HS Code)
- 5.2.3 Type 3 (HS Code)
- 5.2.4 Type 4 (HS Code)
- 5.2.5 Type 5 (HS Code)
- 5.3 Import Analysis – Segment
- 5.3.1 Type 1 (HS Code)
- 5.3.2 Type 2 (HS Code)
- 5.3.3 Type 3 (HS Code)
- 5.3.4 Type 4 (HS Code)
- 5.3.5 Type 5 (HS Code)
- 5.4 Average Unit Trade Prices
- 5.4.1 Average Export Price – Segment & Country
- 5.4.2 Average Import Price – Segment & Source Country
- 5.4.3 Price Trends (2024)
- 5.5 Key Trade Route Analysis
- 5.5.1 Trade Route 1
- 5.5.2 Trade Route 2
- 5.5.3 Trade Route 3
- 5.5.4 Trade Route 4
- 5.5.5 Trade Route 5
- 5.6 Trade Policy Impact Assessment
- 5.6.1 US Anti-Dumping & Section 301 Tariffs
- 5.6.2 EU Customs Union Impact
- 5.6.3 Major Free Trade Agreements
- 5.6.4 USMCA Rules of Origin
Note: Trade policy analysis will be included only where relevant to the Functional Cosmetics market.
Chapter 6. Competitive Landscape & Company Benchmarking
- 6.1 Functional Cosmetics Market Concentration & Structure
- 6.1.1 Herfindahl-Hirschman Index (HHI) – vs. 2024
- 6.1.2 Tier 1, Tier 2 & Tier 3 Market Structure
- 6.1.3 Global, Regional & Local Player Dynamics
- 6.2 Functional Cosmetics Market Share Analysis – 2024
- 6.2.1 Global Revenue Share by Company
- 6.2.2 Global Volume Share by Company
- 6.2.3 Regional Revenue Share
- 6.2.4 Market Share Evolution ( vs. 2024)
- 6.2.5 OEM Segment Share by Company
- 6.2.6 Replacement Segment Share by Company
- 6.3 Production/Delivery Capacity & Facility Analysis
- 6.3.1 Global Installed Capacity
- 6.3.2 Capacity Utilization Rates
- 6.3.3 Production/Output Volume
- 6.3.4 Facility Locations & Capacity Map
- 6.3.5 Planned Capacity Additions
- 6.4 Functional Cosmetics Competitive Benchmarking Matrix
- 6.4.1 Revenue, Volume, CAGR & Profitability Comparison
- 6.4.2 Channel Revenue Mix
- 6.4.3 Geographic Revenue Exposure
- 6.4.4 R&D Intensity
- 6.4.5 Sustainability Maturity
- 6.5 Strategic Developments in Functional Cosmetics (Last 24 Months)
- 6.5.1 Mergers, Acquisitions & Divestments
- 6.5.2 New Functional Cosmetics Launches
- 6.5.3 Facility Expansions
- 6.5.4 Strategic Alliances, Joint Ventures & Partnerships
- 6.5.5 Distribution Expansion & Market Entry
- 6.5.6 Sustainability & ESG Initiatives
- 6.6 Competitive Strategy Mapping
- 6.6.1 Leader, Challenger, Follower & Niche Classification
- 6.6.2 Pricing Strategy Comparison
- 6.6.3 Channel Strategy Matrix
Note: Strategic developments are included based on their materiality and the availability of reliable information.
Chapter 7. Global Functional Cosmetics Market – By Distribution Channel
- 7.1 Segment Overview
- 7.1.1 Volume & Revenue Split by Channel (2024 & 2032)
- 7.1.2 Channel Mix Evolution (2024-2032)
Chapter 8. Regional Market Analysis – Global Overview
- 8.1 Global Regional Overview
- 8.1.1 Regional Volume Share
- 8.1.2 Regional Revenue Share
- 8.1.3 Regional Volume by Region
- 8.1.4 Regional Revenue by Region
- 8.1.5 Regional Forecast Through 2032
- 8.2 Cross-Regional Segment Analysis
- 8.2.1 By Distribution Channel
- 8.2.2 By Brand/Price Tier
Chapter 9. North America Functional Cosmetics Market
- 9.1 United States
- 9.2 Canada
- 9.3 Mexico
Chapter 10. Europe Functional Cosmetics Market
- 10.1 Germany
- 10.2 France
- 10.3 Italy
- 10.4 United Kingdom
- 10.5 Spain
- 10.6 Poland
- 10.7 Russia
- 10.8 Netherlands
- 10.9 Belgium
- 10.10 Sweden
- 10.11 Denmark
- 10.12 Norway
- 10.13 Rest of Europe
Chapter 11. Asia Pacific Functional Cosmetics Market
- 11.1 China
- 11.2 India
- 11.3 Japan
- 11.4 South Korea
- 11.5 Thailand
- 11.6 Indonesia
- 11.7 Vietnam
- 11.8 Malaysia
- 11.9 Australia
- 11.10 Rest of Asia Pacific
Chapter 12. Latin America Functional Cosmetics Market
- 12.1 Brazil
- 12.2 Argentina
- 12.3 Colombia
- 12.4 Chile
- 12.5 Rest of Latin America
Chapter 13. Middle East Functional Cosmetics Market
- 13.1 Saudi Arabia
- 13.2 United Arab Emirates
- 13.3 Turkey
- 13.4 Israel
- 13.5 Iran
- 13.6 Rest of the Middle East
Chapter 14. Africa Functional Cosmetics Market
- 14.1 South Africa
- 14.2 Egypt
- 14.3 Nigeria
- 14.4 Morocco
- 14.5 Rest of Africa
Chapter 15. Functional Cosmetics Company Profiles
- 15.1 [Company 01]
- 15.1.1 Company Overview
- 15.1.2 Key Management Personnel
- 15.1.3 Products & Services Portfolio
- 15.1.4 Financial Performance
- 15.1.5 Key Market Focus & Geographic Presence
- 15.1.6 Recent Developments & Strategic Initiatives
Note: The company profile list is preliminary and may change based on research findings, market developments, data availability, and client requirements.
Chapter 16. Appendices
- Appendix A – List of Abbreviations & Acronyms
- Appendix B – Industry Classification Code Reference – Full Series
- Appendix C – Production & Capacity Data Tables
- Appendix D – End-Use & Demand Base Tables
- Appendix E – Consumption & Replacement Rate Assumptions
- Appendix F – ASP Reference Tables
- Appendix G – Manufacturing & Facility Database
- Appendix H – Import-Export Data Tables
- Appendix I – Regulatory Summary Tables
- Appendix J – Primary Research Participant List (Anonymized)
- Appendix K – Primary Research Questionnaire Framework
- Appendix L – Data Sources & Bibliography
- Appendix M – Market Size Divergence & Source Comparison
Chapter 17. Research Methodology
- 17.1 Research Framework & Philosophy
- 17.2 Secondary Research – Sources, Hierarchy & Data Extraction
- 17.3 Data Modeling – Bottom-Up & Top-Down Market Sizing
- 17.4 Primary Research – Stakeholder Framework, LOI & Sample Sizes
- 17.5 Forecast Methodology – Regression, Scenario & Sensitivity Analysis
- 17.6 Quality Control – Four-Layer Validation Framework
- 17.7 Limitations & Standard Assumptions
- 17.8 Disclaimer
