Market Overview
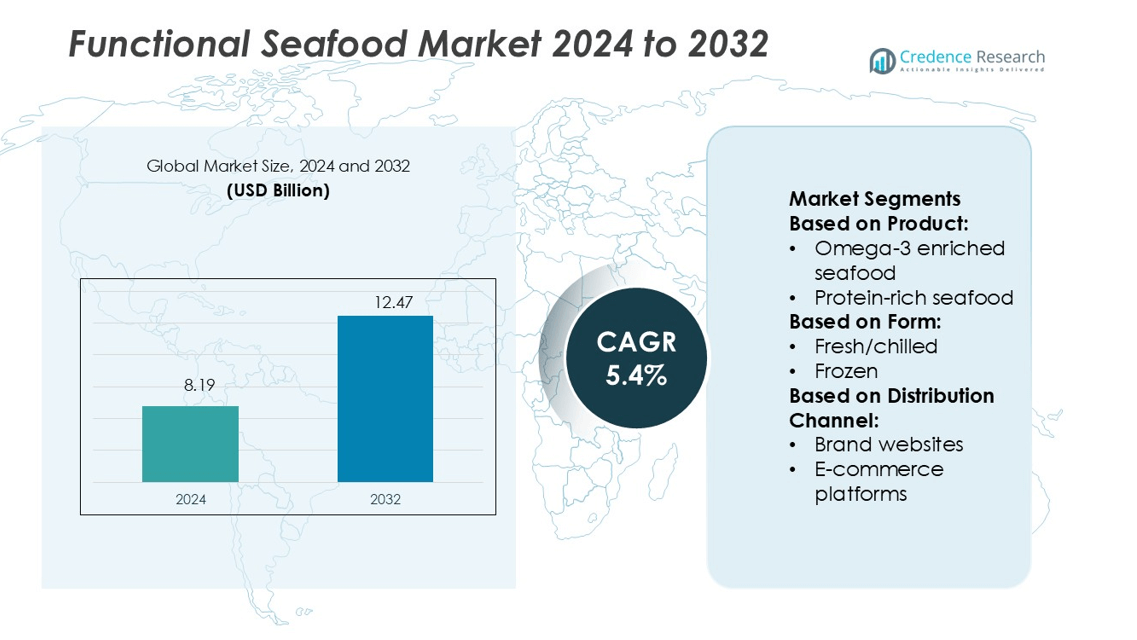
Functional Seafood Market size was valued USD 8.19 billion in 2024 and is anticipated to reach USD 12.47 billion by 2032, at a CAGR of 5.4% during the forecast period.
| REPORT ATTRIBUTE | DETAILS |
|---|---|
| Historical Period | 2020-2023 |
| Base Year | 2024 |
| Forecast Period | 2025-2032 |
| Functional Seafood Market Size 2024 | USD 8.19 billion |
| Functional Seafood Market, CAGR | 5.4% |
| Functional Seafood Market Size 2032 | USD 12.47 billion |
The functional seafood market features strong competition from major companies such as Universal Canning Inc., Maruha Nichiro Corporation, Wild Plant Foods, Icicle Seafoods Inc., Tri Marine, Trident Seafoods, Thai Union Group PCL, American Tuna, LDH (La Doria) Ltd, and StarKist Co. These players focus on omega-3 enrichment, protein fortification, and sustainable sourcing to strengthen their product portfolios. Asia Pacific leads the global market with a 34% share, supported by abundant marine resources, rising health awareness, and rapid retail expansion. The region’s strong consumer base and advanced processing capabilities make it a key driver of global functional seafood growth.
Market Insights
- The functional seafood market was valued at USD 8.19 billion in 2024 and is projected to reach USD 12.47 billion by 2032, growing at a CAGR of 5.4%.
- Rising health awareness and growing demand for omega-3 enriched and protein-fortified seafood are driving steady market expansion.
- Asia Pacific holds a 34% regional share, supported by abundant marine resources, advanced processing facilities, and a strong consumer base.
- The market faces restraints from high production costs, complex fortification processes, and strict regulatory standards in key regions.
- Competitive players focus on sustainable sourcing, clean-label positioning, and e-commerce growth, with omega-3 enriched seafood leading the product segment with a significant market share.
Market Segmentation Analysis:
By Product
Omega-3 enriched seafood dominates the functional seafood market with a 39% share. Its strong position is driven by proven cardiovascular and cognitive health benefits, which boost consumer trust and repeat purchases. Companies also invest in sustainable omega-3 sourcing and bioavailability improvements to enhance product appeal. Protein-rich seafood holds the second-largest share, supported by rising demand for high-protein diets and fitness trends. Vitamin and mineral fortified seafood, along with collagen-based variants, cater to niche wellness segments seeking targeted health benefits.
- For instance, Universal Canning Inc. processes approximately 1.2 to 1.5 million 202×306 sardine cans daily in its Philippines plants, reflecting scale that enables R&D into higher-omega formulations.
By Form
Fresh/chilled seafood leads this segment with a 41% market share, supported by its superior nutritional value and clean-label appeal. Consumers perceive fresh products as healthier, which drives premium pricing and brand loyalty. Growth is further supported by improved cold chain logistics and retail expansion. Frozen seafood ranks second due to its longer shelf life and convenience. Canned and dried forms maintain steady demand in regions with limited access to fresh products. Powdered and supplement formats attract health-conscious consumers seeking easy consumption options.
- For instance, canning industry uses retort sterilization technology to process skipjack tuna and other fish. A temperature of 121 °C is standard for ensuring product safety and shelf stability. The specific capacity of a production line can vary significantly between facilities.
By Distribution Channel
E-commerce platforms dominate the distribution segment with a 45% share, supported by rising online grocery adoption and direct-to-consumer strategies. Consumers prefer online channels for their wide product selection and home delivery convenience. Brand websites hold a growing share as companies build stronger customer relationships and loyalty programs. These platforms also support targeted marketing and subscription models, which boost recurring sales. Online expansion continues to be a key driver of accessibility and market penetration for functional seafood products.
Key Growth Drivers
Rising Consumer Focus on Health and Nutrition
The growing awareness of preventive health drives demand for functional seafood. Consumers increasingly prefer products enriched with omega-3, proteins, vitamins, and minerals for heart, brain, and immune health. Functional seafood offers a natural source of these nutrients, making it more appealing than synthetic supplements. Strong clinical research and marketing campaigns support product credibility. This shift is most visible among urban and aging populations seeking clean-label and nutrient-rich options, directly contributing to expanding consumption volumes and premium product adoption across regions.
- For instance, Icicle’s acquisition of Snopac allows processing of more than 1,000,000 pounds (round weight) per day at combined shore and vessel operations.
Expansion of Product Innovation and Fortification
Continuous product innovation strengthens the functional seafood market. Companies are integrating advanced fortification technologies to improve nutrient bioavailability and product stability. This includes microencapsulation and natural extraction methods that retain taste and texture. Innovation also extends to ready-to-eat formats and supplement-grade powders, attracting fitness-focused and convenience-driven consumers. Premium packaging and transparent labeling further build consumer trust. The development of multi-functional products, such as omega-3 and collagen blends, creates strong differentiation and supports sustained market growth across global retail channels.
- For instance, Tri Marine further expanded its deployment of FlyWire’s electronic monitoring on its distant-water longline tuna vessels. The multi-year collaboration has demonstrably lowered overall program costs, including those associated with EM data review, and resulted in an 80% reduction in EM hardware costs.
Growth in E-Commerce and Direct-to-Consumer Channels
The rapid expansion of e-commerce platforms boosts functional seafood accessibility. Consumers increasingly purchase seafood through brand websites and online marketplaces due to convenience and variety. Online platforms enable targeted promotions, subscriptions, and loyalty programs that increase repeat purchases. Strong cold chain infrastructure and improved logistics support timely delivery and product freshness. This trend also allows smaller brands to enter new markets without heavy distribution costs. The online retail model continues to play a strategic role in expanding the market’s reach and consumer base.
Key Trends & Opportunities
Rising Demand for Clean-Label and Sustainable Products
Clean-label trends are shaping product development strategies in the functional seafood market. Consumers prefer products with minimal additives, traceable sourcing, and certified sustainable fishing practices. Companies are adopting eco-friendly packaging and transparent labeling to align with environmental goals. Certifications such as MSC or ASC improve consumer trust and brand value. This shift creates strong growth opportunities for brands positioned on sustainability and health. As awareness grows, clean-label functional seafood is becoming a premium segment with strong global demand potential.
- For instance, Trident has adopted traceability systems so that 99 % of its seafood products are sourced from fisheries certified under Global Sustainable Seafood Initiative (GSSI) schemes, including MSC and ASC.
Expansion of Functional Formats and Hybrid Products
The market is seeing increased innovation in product formats. Beyond traditional fresh and frozen seafood, companies are introducing functional powders, capsules, and snack bars infused with marine nutrients. Hybrid products combining collagen, peptides, and omega-3 are gaining traction among wellness-focused consumers. This diversification allows companies to target new customer groups such as athletes, seniors, and busy professionals. Multi-functional and portable products align with lifestyle trends and help brands expand into health and supplement categories, driving future revenue streams.
- For instance, PPG Industries produces PSX® 700, a high-performance polysiloxane coating known for its excellent durability, color retention, and chemical resistance. This product is suitable for protecting surfaces in industrial and logistics facilities.
Integration of Advanced Processing and Preservation Technologies
Technological advancements are enhancing product shelf life and nutritional value. Freeze-drying, high-pressure processing, and natural preservation methods help retain nutrient density without compromising quality. These innovations reduce spoilage, cut logistics costs, and enable global shipping. Companies adopting these technologies can enter high-growth markets with strong regulatory requirements. Such advancements also support clean-label claims by reducing the need for chemical additives. This trend positions functional seafood as a modern, science-backed food category with strong potential in both retail and nutraceutical segments.
Key Challenges
High Production and Processing Costs
The functional seafood market faces cost challenges due to complex processing and fortification methods. Extracting omega-3 and bioactive compounds requires specialized technology and strict quality control. Maintaining freshness during storage and transportation adds further expenses. These costs can limit pricing flexibility and market penetration, especially for small and mid-sized producers. Competitive pressure from low-cost protein sources also affects margins. To remain profitable, companies must balance innovation with scalable, cost-efficient production strategies.
Stringent Regulatory and Quality Compliance
Regulatory frameworks for fortified and functional foods are complex and vary by region. Companies must meet strict labeling, nutrient claims, and food safety standards to sell functional seafood globally. Non-compliance can lead to product recalls and reputational damage. Achieving consistent nutrient levels and securing certifications increases operational complexity. These regulatory hurdles can delay product launches and restrict entry into high-potential markets. Firms must invest heavily in compliance infrastructure to ensure smooth market expansion and sustained brand trust.
Regional Analysis
North America
North America holds a 32% share of the functional seafood market, supported by strong consumer awareness of health and wellness. High demand for omega-3 enriched and protein-rich seafood drives growth in the U.S. and Canada. Retailers and e-commerce platforms offer wide product availability, supported by robust cold chain infrastructure. Rising interest in sustainable and clean-label products further strengthens premium product adoption. The region benefits from a well-established regulatory framework that supports fortified food innovation. Major companies invest in product diversification and targeted marketing to meet evolving consumer preferences, especially in urban and health-conscious segments.
Europe
Europe accounts for 28% of the functional seafood market, driven by rising demand for nutrient-dense and environmentally sustainable products. Countries such as Germany, the U.K., France, and the Nordics lead in clean-label and eco-certified seafood. Strict regulatory standards and advanced processing infrastructure enhance product quality and consumer trust. Consumers increasingly choose fortified seafood for heart health, immunity, and lifestyle benefits. E-commerce platforms and specialty stores expand product accessibility. European manufacturers also focus on traceability, transparency, and responsible sourcing, aligning with the region’s strong environmental and health-focused consumer base.
Asia Pacific
Asia Pacific leads the global functional seafood market with a 34% share, fueled by strong seafood consumption patterns in China, Japan, and South Korea. The region benefits from abundant marine resources and fast-growing urban populations with rising disposable incomes. Consumers show increasing interest in functional products addressing immunity and cognitive health. Government initiatives supporting aquaculture and fortified foods further boost growth. Advanced processing technologies and product innovation strengthen export competitiveness. Online platforms and modern retail formats help brands reach a wider consumer base, making Asia Pacific a critical growth engine for the global market.
Latin America
Latin America holds a 4% share of the functional seafood market, supported by growing awareness of dietary health benefits. Brazil and Chile lead the regional market due to strong seafood production capabilities and export potential. Consumers are gradually shifting toward fortified and protein-rich products, supported by expanding retail and online distribution networks. Government efforts to promote healthy eating habits are increasing domestic demand. However, limited processing infrastructure and high production costs restrain faster growth. Investment in cold chain systems and fortified product development is expected to strengthen market penetration in the coming years.
Middle East & Africa
The Middle East & Africa region represents 2% of the functional seafood market, showing steady but emerging growth potential. Rising health consciousness and growing urban populations drive demand in Gulf countries and South Africa. Import reliance remains high, but investment in cold chain logistics and retail expansion supports market development. Premium omega-3 enriched seafood and convenient formats are gaining traction among affluent consumers. Limited local production and regulatory gaps challenge rapid expansion. Strategic partnerships with international suppliers and online retail channels are helping increase product availability and brand visibility in this region.
Market Segmentations:
By Product:
- Omega-3 enriched seafood
- Protein-rich seafood
By Form:
- Fresh/chilled
- Frozen
By Distribution Channel:
- Brand websites
- E-commerce platforms
By Geography
- North America
- U.S.
- Canada
- Mexico
- Europe
- Germany
- France
- U.K.
- Italy
- Spain
- Rest of Europe
- Asia Pacific
- China
- Japan
- India
- South Korea
- South-east Asia
- Rest of Asia Pacific
- Latin America
- Brazil
- Argentina
- Rest of Latin America
- Middle East & Africa
- GCC Countries
- South Africa
- Rest of the Middle East and Africa
Competitive Landscape
The functional seafood market is shaped by leading players such as Universal Canning Inc., Maruha Nichiro Corporation, Wild Plant Foods, Icicle Seafoods Inc., Tri Marine, Trident Seafoods, Thai Union Group PCL, American Tuna, LDH (La Doria) Ltd, and StarKist Co. The functional seafood market is highly competitive, driven by innovation, sustainability, and strong distribution networks. Companies are focusing on developing nutrient-enriched products such as omega-3, protein, and collagen-infused seafood to meet growing health-conscious consumer demand. Clean-label positioning and traceable sourcing are becoming key differentiators in attracting premium buyers. E-commerce and direct-to-consumer models are expanding market reach, supported by advanced cold chain infrastructure. Strong emphasis on eco-friendly packaging, quality certifications, and fortified product formulations is shaping industry strategies. Continuous investment in R&D and processing technologies enables firms to enhance product quality, shelf life, and global competitiveness.
Key Player Analysis
- Universal Canning Inc.
- Maruha Nichiro Corporation
- Wild Plant Foods
- Icicle Seafoods Inc.
- Tri Marine
- Trident Seafoods
- Thai Union Group PCL
- American Tuna
- LDH (La Doria) Ltd
- StarKist Co.
Recent Developments
- In April 2025, Spirulina innovator SimpliiGood by AlgaeCore Technologies, Ltd. is advancing to commercial production of its 100% plant-based smoked salmon analog made from highly nutritious spirulina microalgae. EU regulatory approval, the company is scaling up operations with pilots underway in Europe and Israel.
- In June 2024, Thai Union announced the introduction of John West’s ECOTWIST, an innovative packaging solution that emphasizes user-friendliness, sustainability, and reduced waste. It is available in the U.K., one of the Thai Union’s key markets, with plans to potentially expand ECOTWIST to other countries.
- In June 2024, StarKist partnered with Cornerstones and Feed the Children to host the 3rd annual Summer Food and Resource Rally in Northern Virginia. This event aimed to provide food assistance and resources to families in need during the summer months when children are not receiving school meals.
- In July 2023, Wild Planet Foods established a new agreement with Whole Foods Market to introduce five of its seafood products in stores. These products consist of premium canned seafood that emphasizes sustainability. This collaboration enhanced Wild Planet Foods’ existing range of canned fish items available at the grocery retailer, ensuring low mercury levels and high-quality offering
Report Coverage
The research report offers an in-depth analysis based on Product, Form, Distribution Channel and Geography. It details leading market players, providing an overview of their business, product offerings, investments, revenue streams, and key applications. Additionally, the report includes insights into the competitive environment, SWOT analysis, current market trends, as well as the primary drivers and constraints. Furthermore, it discusses various factors that have driven market expansion in recent years. The report also explores market dynamics, regulatory scenarios, and technological advancements that are shaping the industry. It assesses the impact of external factors and global economic changes on market growth. Lastly, it provides strategic recommendations for new entrants and established companies to navigate the complexities of the market.
Future Outlook
- The market will expand steadily with rising demand for nutrient-enriched seafood.
- Omega-3 and protein-rich products will remain key growth categories.
- E-commerce platforms will play a larger role in product distribution.
- Clean-label and sustainable sourcing will become a core consumer expectation.
- Technological innovation will improve product shelf life and quality.
- Fortified seafood supplements will see strong adoption among health-conscious buyers.
- Regulatory compliance will shape product positioning in international markets.
- Emerging economies will offer new opportunities for market penetration.
- Strategic partnerships will strengthen global supply chains and distribution reach.
- Branding and transparency will drive consumer trust and market loyalty.

Request a Free Sample
Fill in your details and we'll send you a free sample report.
- Sample data tables & charts
- Research methodology
Need a Custom Version of This Report?
Tailor the scope, geography, or segments to your exact requirements.
- Custom geography or segment scope
- Direct access to our analyst team
Frequently Asked Questions
What is the current market size for Functional Seafood Market, and what is its projected size in 2032?
At what Compound Annual Growth Rate is the Functional Seafood Market projected to grow between 2025 and 2032?
Which Functional Seafood Market segment held the largest share in 2024?
What are the primary factors fueling the growth of the Functional Seafood Market?
Who are the leading companies in the Functional Seafood Market?
Table of Content
Chapter 1 Market Segmentation
- 1.1 Segmentation Framework
- 1.1.1 Product and Service Classification
- 1.1.2 Application and End-Use Classification
- 1.1.3 Technology and Solution Classification
- 1.1.4 Customer and Distribution Channel Classification
- 1.1.5 Geographic Segmentation
- 1.1.6 Market Segment Definitions and Boundaries
Chapter 2 Introduction
- 2.1 Report Objectives and Scope
- 2.2 Product Definition and Industry Terminology
- 2.3 Market Inclusions and Exclusions
- 2.4 Research Process
- 2.4.1 Primary Research and Expert Interviews
- 2.4.2 Secondary Research and Source Review
- 2.4.3 Top-Down and Bottom-Up Estimation
- 2.4.4 Data Triangulation and Verification
- 2.5 Market Size Measurement Basis
- 2.5.1 2024: USD 8.19 billion → 2032: USD 12.47 billion
- 2.6 Historical and Forecast Reference Periods
- 2.6.1 Base Year: 2024
- 2.6.2 Forecast Period: 2024-2032
- 2.7 Research Assumptions and Limitations
Chapter 3 Executive Summary
- 3.1 Market Snapshot and Key Findings
- 3.2 Base-Year Market Size, 2024
- 3.3 Forecast Market Size, 2032
- 3.4 Revenue and Volume Growth Outlook
- 3.5 Key Demand and Supply Indicators
- 3.6 Leading Market Segments
- 3.7 Fastest-Growing Market Opportunities
- 3.8 Regional Performance Highlights
- 3.9 Technology and Industry Transformation
- 3.10 Competitive Landscape Summary
- 3.11 Analyst View and Strategic Implications
Chapter 4 Global Functional Seafood Market Trends and Developments
- 4.1 Historical Industry Development
- 4.2 Recent Market Trends and Developments
- 4.3 Demand and Customer Behavior Trends
- 4.4 Technology and Product Innovation
- 4.5 Artificial Intelligence, Automation and Digitalization
- 4.6 Local Manufacturing and Supply Chain Realignment
- 4.7 Industry Partnerships, Mergers and Acquisitions
- 4.8 Sustainability and Circular Economy Developments
- 4.9 Government and Private Sector Investment Trends
- 4.10 Emerging Business Models and Commercialization
- 4.11 Industry Developments and Announcements
Chapter 5 Global Functional Seafood Market Production, Supply and Demand Analysis
- 5.1 Demand Trend and Consumption Analysis
- 5.2 Demand Forecast, 2024-2032
- 5.3 Production and Output Trend
- 5.4 Production and Output Forecast, 2024-2032
- 5.5 Installed Capacity and Capacity Utilization
- 5.6 Company-Wise Production Plants and Statistics
- 5.6.1 Installed Production Capacity
- 5.6.2 Actual Production
- 5.6.3 Planned Capacity and Expansion Targets
- 5.7 Supply Chain Structure and Procurement Trends
- 5.8 Supply-Demand Gap and Bottlenecks
- 5.9 Import Dependence and Sourcing Structure
- 5.10 Contract Manufacturing and Outsourcing
- 5.11 Regional Supply and Demand Concentration
Chapter 6 Global Functional Seafood Market Pricing Analysis
- 6.1 Pricing Structure and Measurement
- 6.2 Historical Pricing Trends
- 6.3 Pricing Outlook, 2024-2032
- 6.4 Average Selling Price and Unit Economics
- 6.5 Pricing by Product and Market Segment
- 6.6 Geographic Pricing Differences
- 6.7 Key Input, Energy, Labor and Logistics Costs
- 6.8 Contract Pricing and Purchasing Models
- 6.9 Pricing Sensitivity and Competitive Positioning
- 6.10 Price, Margin and Profitability Implications
Chapter 7 Global Functional Seafood Market Dynamics
- 7.1 Market Growth Drivers
- 7.1.1 Demand-Side Drivers
- 7.1.2 Technology and Innovation Drivers
- 7.1.3 Infrastructure and Investment Drivers
- 7.1.4 Regulatory and Policy Drivers
- 7.2 Market Restraints
- 7.2.1 Cost and Affordability Constraints
- 7.2.2 Technology and Adoption Barriers
- 7.2.3 Supply Chain and Operational Constraints
- 7.3 Market Challenges
- 7.3.1 Competitive Pressure and Margin Erosion
- 7.3.2 Skills, Infrastructure and Implementation Gaps
- 7.4 Emerging Market Opportunities
- 7.5 Market Dynamics Impact and Time-Horizon Assessment
Chapter 8 Global Functional Seafood Value Chain Analysis
- 8.1 Industry Value Chain Overview
- 8.2 Upstream Suppliers and Critical Inputs
- 8.3 Technology and Component Providers
- 8.4 Manufacturing or Service Delivery
- 8.5 Distribution, Channel Partners and Integrators
- 8.6 Downstream Applications and End Users
- 8.7 Value Addition and Profit Pools
- 8.8 Vertical Integration and Outsourcing
- 8.9 Supplier Concentration and Risk
- 8.10 Supply Chain Localization and Resilience
Chapter 9 Global Functional Seafood Market Regulations and Policies
- 9.1 Relevant Laws, Standards and Compliance Frameworks
- 9.2 Product, Service, Safety and Quality Requirements
- 9.3 Government Policies, Incentives and Subsidies
- 9.4 Imports, Exports and Trade Barriers
- 9.5 Public Procurement and Local Content Requirements
- 9.6 Environmental and Sustainability Compliance
- 9.7 Upcoming Policy Changes and Market Implications
Chapter 10 Global Functional Seafood Market Hotspots and Opportunities
- 10.1 Market Opportunity Mapping and Growth Hotspots
- 10.2 High-Growth Applications and Customer Groups
- 10.3 Underserved Markets and White-Space Opportunities
- 10.4 Emerging Technology and Product Opportunities
- 10.5 New Capacity and Investment Hotspots
- 10.6 Market Entry and Expansion Opportunities
- 10.7 Distribution and Partnership Opportunities
- 10.8 Near-Term and Long-Term Commercial Potential
- 10.9 Opportunity Attractiveness and Execution Risks
Chapter 11 Global Functional Seafood Market Outlook, 2024-2032
- 11.1 Market Size and Analysis
- 11.1.1 Revenue (Market Measurement: 2024: USD 8.19 billion → 2032: USD 12.47 billion)
- 11.1.2 Market Volume and Quantity Sold
- 11.1.3 Historical Market Size
- 11.1.4 Base-Year Market Size, 2024
- 11.2 Market Forecast, 2024-2032
- 11.2.1 Revenue Forecast to 2032
- 11.2.2 Volume Forecast to 2032
- 11.2.3 CAGR and Year-on-Year Growth
- 11.2.4 Incremental Revenue Opportunity
- 11.3 Forecast Assumptions and Scenario Analysis
- 11.3.1 Base-Case Forecast
- 11.3.2 Optimistic and Conservative Scenarios
- 11.3.3 Technology, Pricing and Policy Sensitivities
- 11.4 Market Attractiveness and Growth Outlook
Chapter 12 Global Functional Seafood Market Segmentation and Outlook
- 12.1 Segmentation Summary and Market Shares, 2024
- 12.2 Largest and Fastest-Growing Segments
- 12.3 Segment Growth Comparison
- 12.4 Segment Attractiveness and Priority Matrix
Chapter 13 Global Functional Seafood Geographic Market Outlook, 2024-2032
- 13.1 Regional Market Size and Share, 2024
- 13.2 Regional Market Forecast, 2024-2032
- 13.3 Regional Pricing, Production and Demand Differences
- 13.4 North America
- 13.4.1 United States
- 13.4.2 Canada
- 13.4.3 Mexico
- 13.5 Europe
- 13.5.1 Germany
- 13.5.2 France
- 13.5.3 Italy
- 13.5.4 United Kingdom
- 13.5.5 Spain
- 13.5.6 Poland
- 13.5.7 Russia
- 13.5.8 Netherlands
- 13.5.9 Belgium
- 13.5.10 Sweden
- 13.5.11 Denmark
- 13.5.12 Norway
- 13.5.13 Rest of Europe
- 13.6 Asia Pacific
- 13.6.1 China
- 13.6.2 India
- 13.6.3 Japan
- 13.6.4 South Korea
- 13.6.5 Thailand
- 13.6.6 Indonesia
- 13.6.7 Vietnam
- 13.6.8 Malaysia
- 13.6.9 Australia
- 13.6.10 Rest of Asia Pacific
- 13.7 Latin America
- 13.7.1 Brazil
- 13.7.2 Argentina
- 13.7.3 Colombia
- 13.7.4 Chile
- 13.7.5 Rest of Latin America
- 13.8 Middle East
- 13.8.1 Saudi Arabia
- 13.8.2 United Arab Emirates
- 13.8.3 Turkey
- 13.8.4 Israel
- 13.8.5 Iran
- 13.8.6 Rest of the Middle East
- 13.9 Africa
- 13.9.1 South Africa
- 13.9.2 Egypt
- 13.9.3 Nigeria
- 13.9.4 Morocco
- 13.9.5 Rest of Africa
- 13.10 Regional Investment, Policy and Supply Chain Differences
- 13.11 Regional Competitive Landscape
- 13.12 Geographic Growth Hotspots
Chapter 14 Global Functional Seafood Technology, Innovation and Sustainability Outlook
- 14.1 Technology Landscape and Maturity
- 14.2 Product, Process and Service Innovation
- 14.3 AI, Automation and Digital Tools in the Industry
- 14.4 Technology Adoption and Performance Benchmarking
- 14.5 Innovation Pipeline and R&D Investment
- 14.6 Patent and Intellectual Property Trends
- 14.7 Energy Efficiency and Resource Management
- 14.8 Sustainability, Recycling and Circularity
- 14.9 Technology Roadmap, 2024-2032
- 14.10 Risks of Obsolescence and Technology Substitution
Chapter 15 Global Functional Seafood Market Key Strategic Imperatives
- 15.1 Growth and Market Entry Priorities
- 15.2 High-Return Products and Segments
- 15.3 Pricing, Profitability and Cost Optimization
- 15.4 Technology Investment and Product Differentiation
- 15.5 Supply Chain Localization and Resilience
- 15.6 Distribution and Customer Acquisition
- 15.7 Partnership, Acquisition and Capacity Strategy
- 15.8 Regional Expansion Priorities
- 15.9 Short-, Medium- and Long-Term Actions
Chapter 16 Competition Outlook
- 16.1 Industry Competition Characteristics
- 16.2 Market Structure and Concentration
- 16.3 Market Share and Competitive Positioning, 2024
- 16.4 Company-Wise Revenue and Product Benchmarking
- 16.5 Production and Service Capacity Benchmarking
- 16.6 Technology, Pricing and Differentiation
- 16.7 Regional Footprint and Distribution Strength
- 16.8 Mergers, Acquisitions and Strategic Alliances
- 16.9 New Entrants and Competitive Threats
- 16.10 Porter's Five Forces and Industry Attractiveness
- 16.11 Competitive Outlook, 2024-2032
Chapter 17 Company Profiles
- 17.1 Company Coverage and Selection Criteria
- 17.2 Leading Market Participants – Standard Profile Structure
- 17.2.1 Business Description
- 17.2.2 Company Ownership and Geographic Presence
- 17.2.3 Product and Service Portfolio
- 17.2.4 Manufacturing and Operating Footprint
- 17.2.5 Production Capacity and Expansion Plans
- 17.2.6 Financial Performance and Investment
- 17.2.7 Market Share and Competitive Position
- 17.2.8 Technology and Innovation Capabilities
- 17.2.9 Strategic Alliances or Partnerships
- 17.2.10 Recent Developments
- 17.2.11 Growth Strategy and Outlook
- 17.3 Other Relevant Market Participants
Note: Every listed company is profiled on the structure shown under the first company. The company list is preliminary and may change based on research findings, market developments, data availability and client requirements.
Chapter 18 Disclaimer
- 18.1 Research and Forecast Disclaimer
- 18.2 Data Source and Estimation Limitations
Note: The depth of individual sections depends on data availability for this market. Volume, capacity, trade and other unit-based metrics are included where applicable.