Market Overview
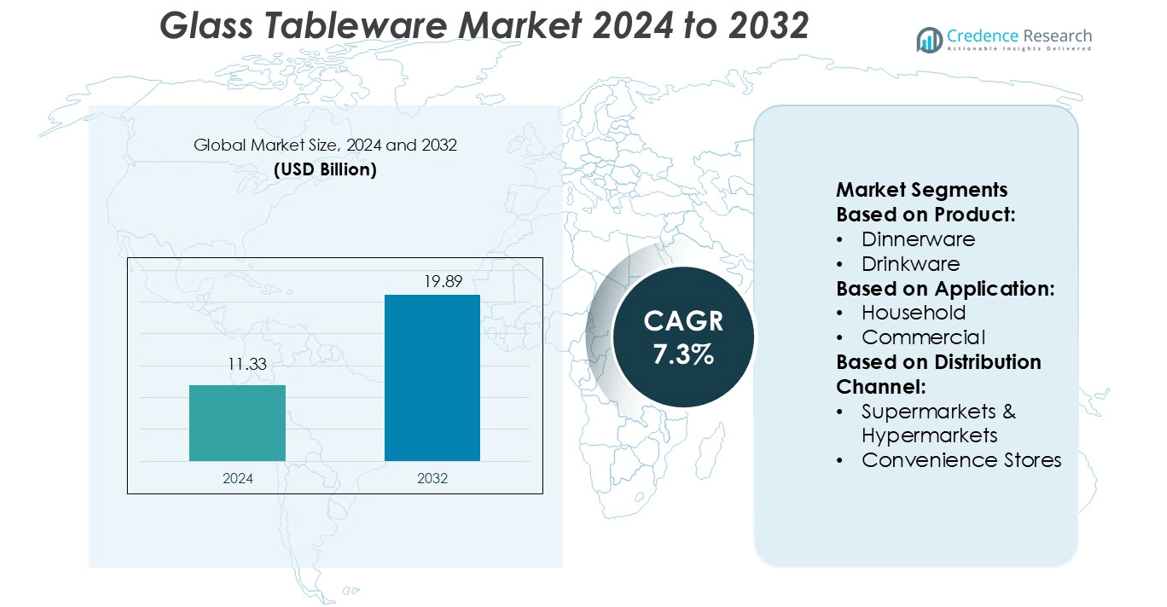
Glass Tableware Market size was valued USD 11.33 billion in 2024 and is anticipated to reach USD 19.89 billion by 2032, at a CAGR of 7.3% during the forecast period.
| REPORT ATTRIBUTE |
DETAILS |
| Historical Period |
2020-2023 |
| Base Year |
2024 |
| Forecast Period |
2025-2032 |
| Glass Tableware Market Size 2024 |
USD 11.33 billion |
| Glass Tableware Market, CAGR |
7.3% |
| Glass Tableware Market Size 2032 |
USD 19.89 billion |
The glass tableware market is driven by strong competition among top players including Libbey Inc., Luigi Bormioli, Waterford Crystal (part of Fiskars Group), Duralex International, Bormioli Rocco, Riedel Crystal, Steelite International, Arc International, Pasabahce (part of Sisecam Group), and Lenox Corporation. These companies focus on advanced manufacturing, design innovation, and sustainable production practices to strengthen their market presence. Asia Pacific leads the global market with a 34% share, supported by large-scale production, rising household demand, and strong export capacity. Expanding retail networks and growing hospitality industries across the region further boost market growth and global supply dominance.
Market Insights
- The Glass Tableware Market size was valued at USD 11.33 billion in 2024 and is projected to reach USD 19.89 billion by 2032, registering a CAGR of 7.3% during the forecast period.
- Increasing household spending and rising demand for elegant and durable dinnerware are key growth drivers.
- Strong competition among manufacturers is accelerating innovation in sustainable materials and advanced production techniques.
- Asia Pacific leads the market with a 34% share, supported by large-scale production, high domestic consumption, and growing exports.
- Dinnerware dominates the product segment with a 43% share, reflecting its strong presence in both household and commercial applications.
Access crucial information at unmatched prices!
Request your sample report today & start making informed decisions powered by Credence Research Inc.!
Download Sample
Market Segmentation Analysis:
By Product
Dinnerware dominates the glass tableware market with a 43% share. Its popularity stems from rising demand for aesthetic and functional table settings in households and restaurants. Manufacturers focus on introducing durable, scratch-resistant designs to enhance product lifespan and appeal. Drinkware holds a significant share due to increasing beverage consumption trends in both residential and commercial spaces. The “Others” category, including serveware and decorative pieces, shows steady growth as consumers prefer premium and customized designs to elevate dining experiences. Rising disposable income and lifestyle upgrades further boost segment performance.
- For instance, glass façade market, the unitized system leads because it permits off-site assembly and faster on-site insertion. The unitized method ensures exact tolerances: for example, Reynaers’ ElementFaçade 7 system supports wind loads up to 2,400 Pa and water tightness to 1,200 Pa, while maintaining a thermal frame U-value of 1.3 W/m²·K.
By Application
Household applications lead the glass tableware market with a 58% share. This dominance is driven by growing urbanization, expanding middle-class populations, and increased spending on home décor and kitchenware. Consumers prefer elegant and durable glass products to enhance dining aesthetics. The commercial segment is expanding rapidly with strong demand from hotels, cafés, and restaurants that seek durable, easy-to-clean, and cost-effective solutions. Global tourism growth and the expansion of the hospitality industry further accelerate commercial adoption, particularly in emerging markets.
- For instance, Luigi Bormioli’s SON.hyx® high-tech crystal glass is engineered for high durability, brilliant transparency, and resistance to breakage. The company offers a 25-year limited warranty that covers chipping on the rim and foot, as well as discoloration and cloudiness from dishwashing.
By Distribution Channel
Supermarkets and hypermarkets hold a 36% share, making them the leading distribution channel in the glass tableware market. Their dominance comes from the wide variety of options, attractive discounts, and easy product availability. Specialty stores and online platforms are gaining traction due to personalized offerings and convenient doorstep delivery. Convenience stores and other retail channels maintain steady sales, especially in semi-urban regions. The rising adoption of e-commerce platforms is reshaping buying behavior, with consumers increasingly preferring online purchases for their wider assortment and competitive pricing.
Key Growth Drivers
Rising Demand from Manufacturing and Metal Fabrication
The Australia Industrial Gases Market is growing strongly due to increasing usage in manufacturing and metal fabrication. Industrial gases like oxygen, nitrogen, and argon support cutting, welding, and refining operations. Expanding automotive, construction, and mining activities further boost demand for high-purity gases. Companies invest in advanced storage and distribution systems to ensure supply reliability. Rising infrastructure development projects also contribute to increased consumption. This steady demand from key industries is a primary growth engine for the market across the country.
- For instance, EFP 65 Unitised System supports glass thicknesses from 24 mm up to 68 mm, withstands design wind pressures of 2,400 Pa and safety pressures up to 3,300 Pa, and passes cyclic water tightness tests up to 1,200 Pa.
Expanding Healthcare and Medical Applications
The healthcare sector is a key demand driver for medical-grade oxygen, nitrogen, and carbon dioxide. Hospitals and clinics require stable gas supplies for respiratory care, anesthesia, and sterilization processes. Rising healthcare investments and growing patient volumes strengthen gas consumption. Government programs to modernize healthcare infrastructure create long-term supply contracts for gas producers. The pandemic experience has further highlighted the critical role of oxygen availability in emergency response. These factors make healthcare one of the most stable growth segments in the market.
- For instance, Saint-Gobain the group trialled flat glass compositions containing over 30% recycled glass (cullet) without compromising optical clarity or mechanical strength.Their manufacturing site in Pisa recovered and reinjected 7,000 m³ of treated water into its industrial circuit via osmosis and nanofiltration systems.
Energy Transition and Clean Hydrogen Initiatives
Australia’s focus on clean energy accelerates demand for industrial gases, particularly hydrogen. Large-scale hydrogen production projects are expanding to support decarbonization targets. Industrial gases enable cleaner energy processes, energy storage, and alternative fuel production. Strategic investments in electrolyzer capacity and export infrastructure create new opportunities for producers. Collaboration between public and private players supports scaling up production and distribution. This shift toward a hydrogen economy positions industrial gases as a critical enabler of Australia’s energy transition strategy.
Key Trends & Opportunities
Growth of On-Site Gas Generation Systems
Industries are shifting toward on-site gas generation systems to reduce dependence on bulk supply and cylinders. This approach lowers operational costs, ensures continuous availability, and improves purity levels. Manufacturing, healthcare, and electronics industries increasingly adopt PSA and cryogenic generation technologies. Companies also prefer long-term contracts with gas suppliers that offer on-site installation. This trend supports improved supply chain efficiency and gives producers new revenue models.
- For instance, Schott conducted melt optical glass using 100 % hydrogen instead of natural gas, maintaining optical quality and continuous 24/7 operation in a pilot melting tank. The firm uses a 5,000 Nm³ hydrogen storage tank in these trials and adapted burner systems accordingly.
Strategic Expansion in Remote Industrial Zones
Australia’s vast geography drives opportunities for gas suppliers to expand in remote mining and energy zones. On-site gas facilities and mobile supply solutions help meet the specific needs of these sectors. Investments in pipeline networks and liquefaction units enhance distribution reach. Companies offering flexible delivery models gain a competitive edge in underserved regions. This expansion aligns with the country’s resource-based economic structure.
- For instance, AGC and the University of Tokyo developed a laser glass processing technique that runs 1,000,000× faster than conventional methods for transparent materials. AGC’s M100/200 glass substrates for AR/MR glasses earned recognition.
Rising Adoption of Digital Monitoring Technologies
Digital tools for monitoring, metering, and automating gas supply are gaining traction. Advanced IoT sensors and cloud platforms help optimize usage, reduce wastage, and ensure safety. End-users value real-time monitoring for improved operational control. This trend creates opportunities for integrated service offerings combining hardware and software solutions. Gas producers benefit from enhanced service efficiency and stronger customer retention.
Key Challenges
High Production and Distribution Costs
Industrial gas production involves significant capital investment in liquefaction units, storage tanks, and transport infrastructure. Australia’s long transport distances add to distribution expenses, particularly for remote sites. Fluctuating energy prices further affect production costs, creating pricing pressure for suppliers. These high costs limit competitiveness for smaller market participants. Companies need to adopt cost-optimized supply models to maintain margins.
Stringent Environmental and Safety Regulations
Industrial gas production and handling are subject to strict environmental and safety standards in Australia. Compliance requires investment in emission controls, leak detection systems, and storage safety measures. Non-compliance can result in penalties, shutdowns, and reputational risks. Meeting these regulatory requirements increases operational costs for producers. Balancing compliance and profitability remains a key challenge for many market participants.
Regional Analysis
North America
North America holds a 24% share of the glass tableware market, driven by strong consumer spending and premium product demand. The U.S. leads the region, supported by a high preference for designer and durable glassware in households and hospitality. Growth in restaurants, cafés, and catering services further boosts commercial sales. Major brands focus on product innovation, launching tempered and eco-friendly glass options. Rising online retail penetration enhances product accessibility, especially in urban markets. The region also benefits from stable economic conditions and shifting consumer preferences toward sustainable, long-lasting dining products.
Europe
Europe accounts for a 28% share of the global glass tableware market, making it a key contributor. The region’s growth is supported by strong cultural emphasis on formal dining and aesthetic presentation. Germany, France, and Italy are major markets with a well-developed hospitality sector. Consumers prefer high-quality, elegant designs with durable finishes. Sustainability is a major trend, with manufacturers increasingly adopting recycled glass production. Specialty stores and premium retail chains dominate distribution, while e-commerce is gaining traction. Europe remains a hub for luxury glassware brands, supporting steady revenue growth.
Asia Pacific
Asia Pacific leads the glass tableware market with a 34% share, supported by rapid urbanization and growing middle-class populations. China and India drive large-scale production and domestic consumption due to strong household demand. Expanding hospitality and food service industries in Japan, South Korea, and Southeast Asia contribute to regional growth. Rising disposable income and modern dining trends are fueling preference for stylish yet affordable products. The region also benefits from strong manufacturing capabilities, making it a global export hub. Online channels and supermarket retail formats play a major role in distribution.
Latin America
Latin America holds a 7% share of the glass tableware market, with Brazil and Mexico as the leading contributors. Urban lifestyle shifts and rising hospitality investments are increasing demand. Consumers show growing interest in elegant tableware at affordable price points. Local manufacturers compete with imported products from Asia and Europe. Expansion of supermarket chains and online retail platforms boosts product availability. The region is witnessing steady growth supported by improving economic conditions and expanding middle-income groups. Price-sensitive consumers drive strong sales of mid-range glassware products.
Middle East & Africa
The Middle East & Africa region accounts for a 7% share of the glass tableware market, driven by expanding hospitality and tourism sectors. The UAE and Saudi Arabia lead the market with strong demand from luxury hotels and restaurants. Rising disposable income and a growing focus on premium dining experiences support higher consumption. Retail expansion, especially in shopping malls and supermarkets, enhances accessibility. Regional demand is also supported by increasing home décor spending. Manufacturers focus on launching elegant and durable collections to cater to changing consumer preferences in urban areas.
Market Segmentations:
By Product:
By Application:
By Distribution Channel:
- Supermarkets & Hypermarkets
- Convenience Stores
By Geography
- North America
- Europe
- Germany
- France
- U.K.
- Italy
- Spain
- Rest of Europe
- Asia Pacific
- China
- Japan
- India
- South Korea
- South-east Asia
- Rest of Asia Pacific
- Latin America
- Brazil
- Argentina
- Rest of Latin America
- Middle East & Africa
- GCC Countries
- South Africa
- Rest of the Middle East and Africa
Competitive Landscape
The Glass Tableware Market features strong competition among key players such as Libbey Inc., Luigi Bormioli, Waterford Crystal (part of Fiskars Group), Duralex International, Bormioli Rocco, Riedel Crystal, Steelite International, Arc International, Pasabahce (part of Sisecam Group), and Lenox Corporation. The glass tableware market is shaped by innovation, design, and manufacturing efficiency. Companies focus on delivering durable, elegant, and sustainable products to meet shifting consumer preferences. Many manufacturers are investing in advanced glass tempering technologies and eco-friendly production processes to enhance quality and reduce environmental impact. Strategic distribution through retail chains, specialty stores, and online platforms strengthens global reach. The market sees clear differentiation between premium handcrafted collections and affordable mass-market offerings. Partnerships with hospitality chains and hotels play a crucial role in expanding brand visibility. Consistent product innovation and branding efforts are key competitive strategies.
Shape Your Report to Specific Countries or Regions & Enjoy 30% Off!
Key Player Analysis
- Libbey Inc.
- Luigi Bormioli
- Waterford Crystal (part of Fiskars Group)
- Duralex International
- Bormioli Rocco
- Riedel Crystal
- Steelite International
- Arc International
- Pasabahce (part of Sisecam Group)
- Lenox Corporation
Recent Developments
- In January 2025, AGC Glass Europe is set to invest a significant amount in a new production line at its Lodelinsart facility in Belgium for FINEO ultra-thin insulating vacuum glass. This initiative aims to enhance glass manufacturing capabilities, responding to increasing customer demand for innovative solutions. Set to begin operations in mid-2026, the line is expected to boost production of FINEO.
- In June 2024, Steelite International, a hospitality supply industry leader, announced the acquisition of Utopia Tableware Ltd. This strategic acquisition combines Utopia’s innovative products and Steelite’s global presence, promising growth across the UK and Europe.
- In February 2024, Saint-Gobain India has launched the production of India’s first low-carbon glass, aiming to meet the growing demand for sustainable building materials in the construction industry. This innovative glass manufacturing process is expected to reduce carbon emissions by approximately 40% compared to existing products, utilizing two-thirds recycled content and renewable energy sources.
- In July 2023, HeatCure, a transparent nanotechnology coating, launched its operations in India. The primary function of this nanotechnology-based coating is to block heat gain from glass doors, windows, and facades.
Report Coverage
The research report offers an in-depth analysis based on Product, Application, Distribution Channel and Geography. It details leading market players, providing an overview of their business, product offerings, investments, revenue streams, and key applications. Additionally, the report includes insights into the competitive environment, SWOT analysis, current market trends, as well as the primary drivers and constraints. Furthermore, it discusses various factors that have driven market expansion in recent years. The report also explores market dynamics, regulatory scenarios, and technological advancements that are shaping the industry. It assesses the impact of external factors and global economic changes on market growth. Lastly, it provides strategic recommendations for new entrants and established companies to navigate the complexities of the market.
Future Outlook
- Demand for sustainable and recyclable glass tableware will continue to rise globally.
- Premium and luxury glassware will gain traction in high-income markets.
- Manufacturers will invest more in automated production to improve efficiency.
- Online retail channels will become a dominant distribution platform.
- Customized and designer tableware collections will attract urban consumers.
- Growth in hospitality and tourism will boost commercial demand.
- Energy-efficient production technologies will support lower manufacturing costs.
- Eco-label certifications will become a key differentiator for brands.
- Asia Pacific will maintain its lead in production and export capacity.
- Strategic mergers and acquisitions will strengthen global market consolidation.


