
Paid tools and counsel now carry most donor acquisition
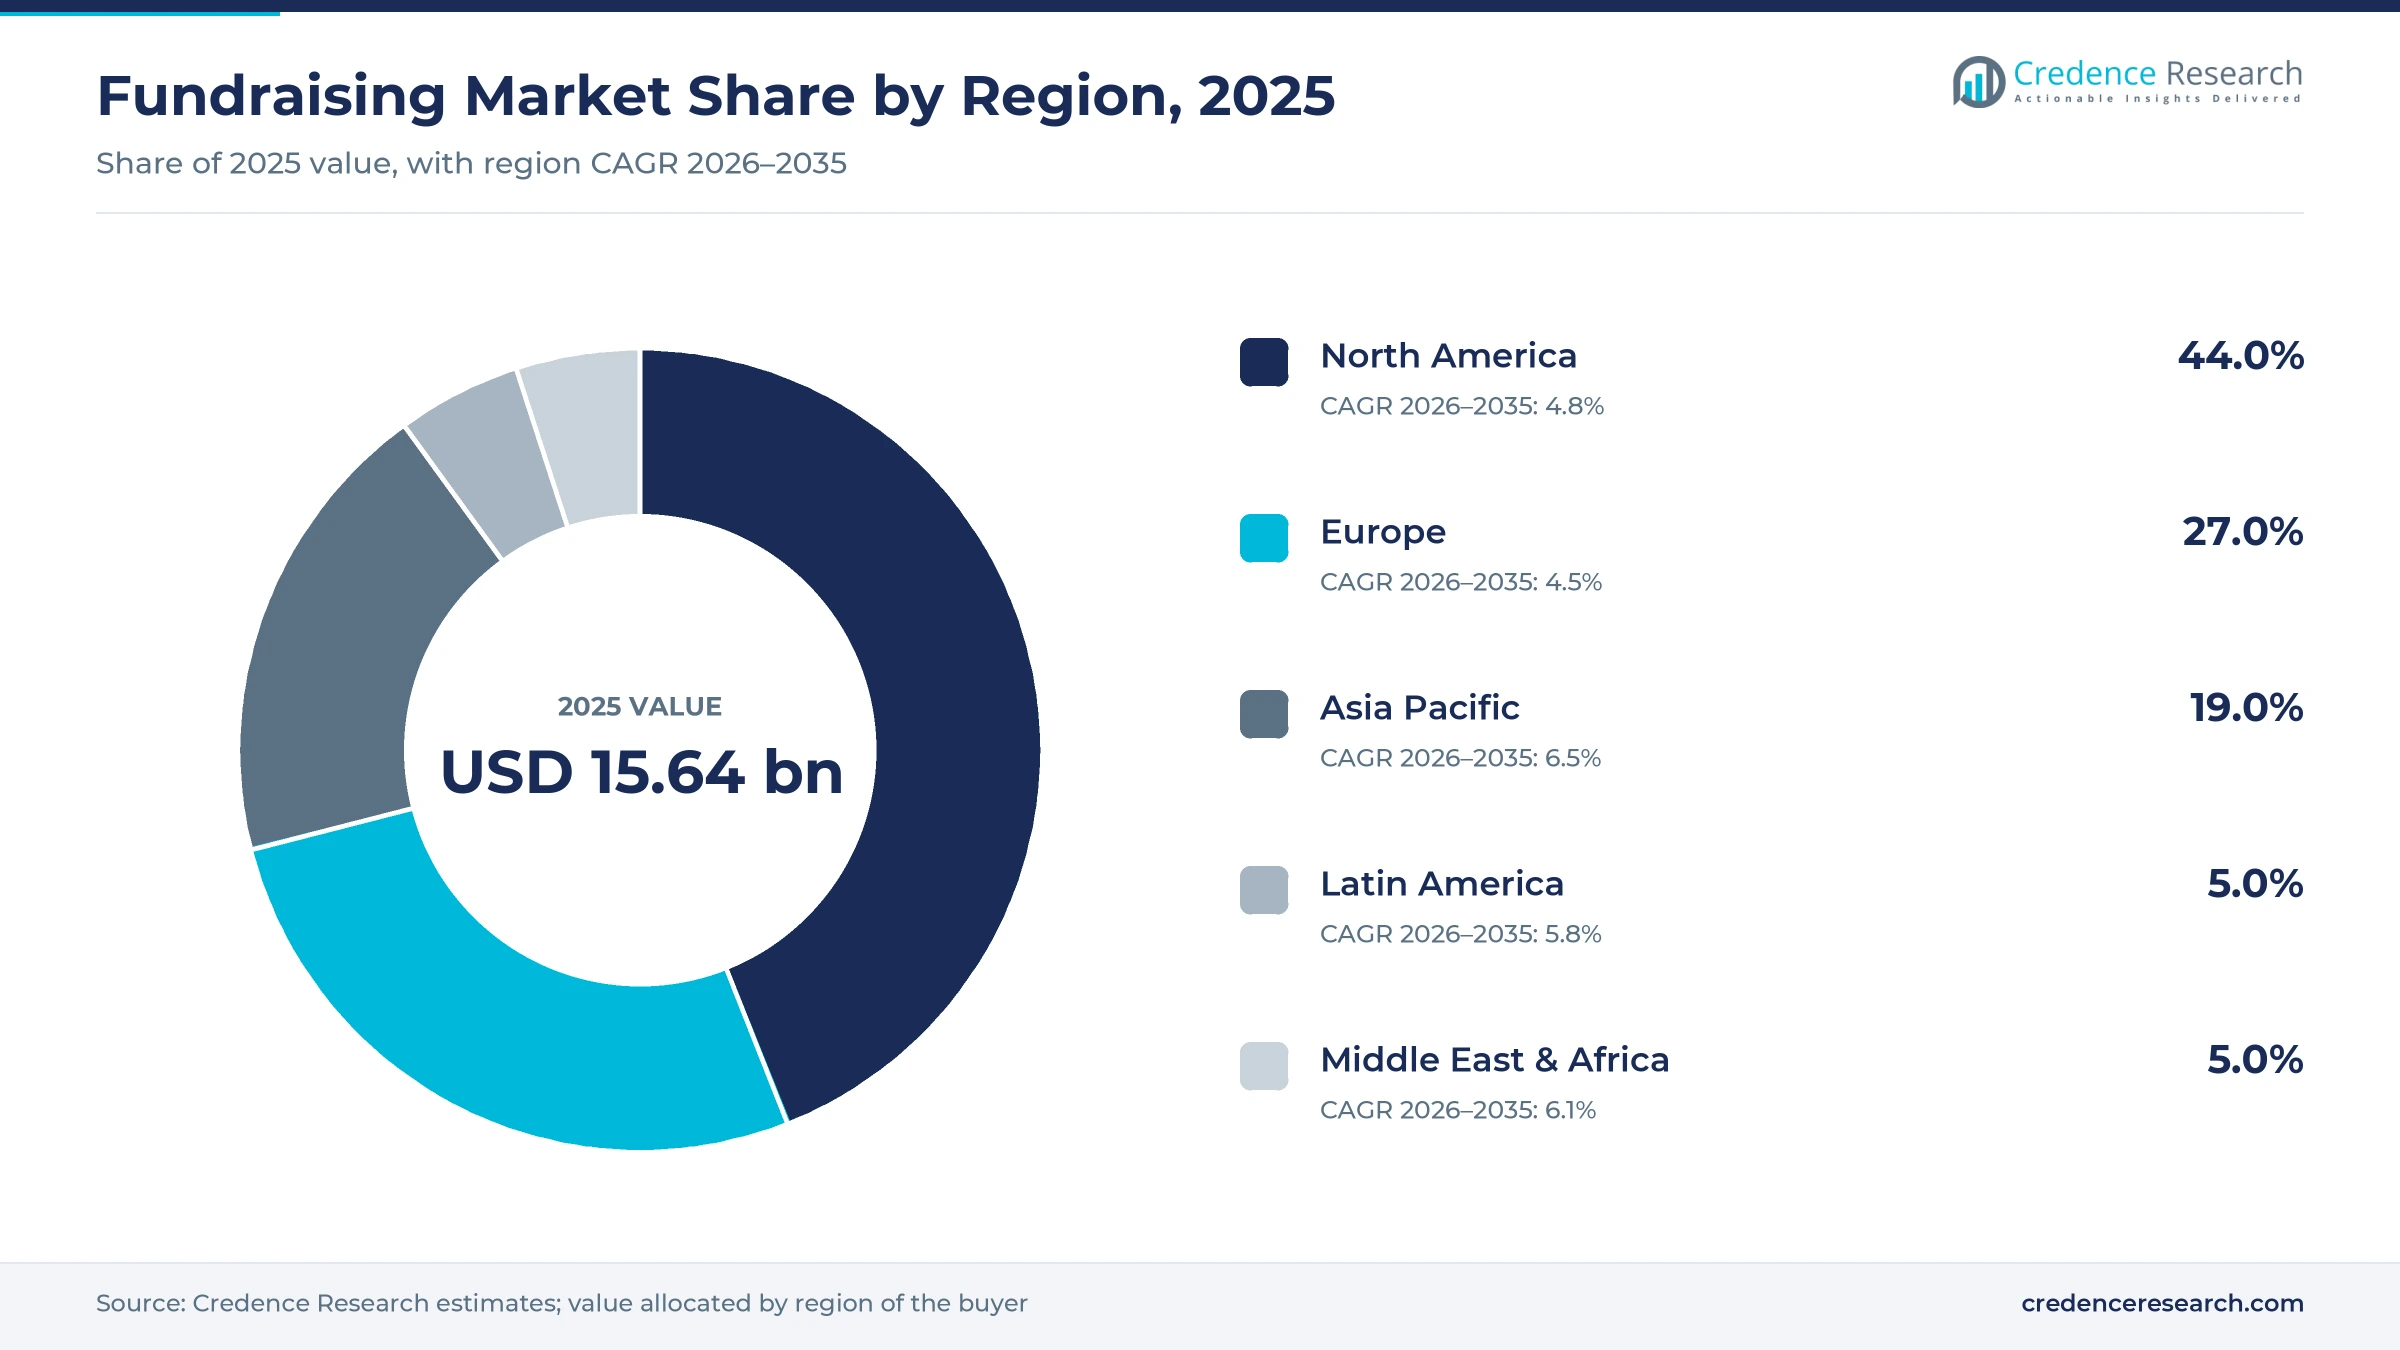
The global fundraising market was valued at USD 15.64 billion in 2025 and is projected to increase from USD 16.45 billion in 2026 to USD 25.96 billion by 2035, registering a CAGR of 5.20% during 2026–2035. Demand comes from charities, universities, hospitals, congregations and political committees that pay software vendors, payment platforms and campaign counsel to find donors, process gifts and keep supporters giving. North America held the largest regional share, 44.0% in 2025, because U.S. donors gave a record USD 617.20 billion in 2025, according to Giving USA, and much of that money passes through paid donor databases, direct-response agencies and online forms. Asia Pacific is the fastest-growing region at 6.5% a year as Indian corporate giving and Australian online appeals move onto hosted platforms. The main commercial change is the arrival of AI agents inside donor databases, which shifts budget from manual prospect research toward software subscriptions priced per seat.
Paid donor acquisition and retention services define the market
The market counts what mission-driven organizations pay outside suppliers to raise money, including donor management and CRM subscriptions, online giving forms, event and peer-to-peer platforms, payment and platform fees on gifts, campaign counsel and outsourced direct mail, telephone and face-to-face programs. Buyers sign annual software contracts, pay per-transaction fees on each gift and hire consultants on fixed retainers for capital campaigns.
The value of donations themselves, in-house fundraising salaries and investment-fund placement work are excluded. Value sits with platform vendors that hold donor records, with payment layers that take a share of every online gift and with counsel firms whose advice decides how major gifts are solicited.
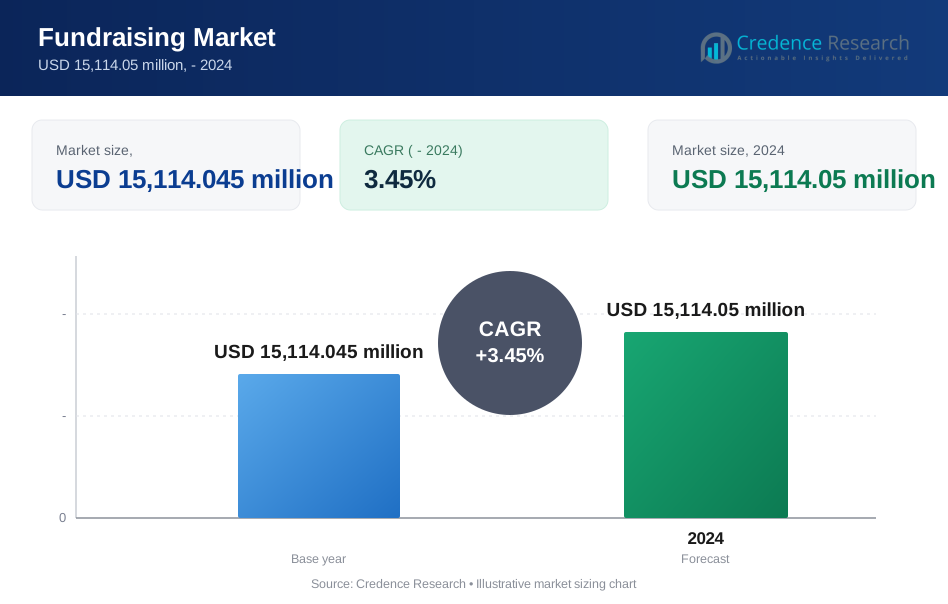
Fundraising Market Insights
- The global fundraising market was valued at USD 15.64 billion in 2025 and is projected to reach USD 25.96 billion by 2035, growing at a 5.20% CAGR during 2026–2035.
- North America held 44.0% of 2025 value because U.S. charities, colleges and political committees buy the largest share of donor databases, payment services and campaign counsel.
- Direct mail and telefundraising held 30.0% of 2025 value, while recurring giving grows fastest at 6.7% a year as monthly donors anchor online revenue.
- Blackbaud made its first AI Development Agent generally available to U.S. Raiser's Edge NXT customers on March 17, 2026, moving donor stewardship tasks into software.
- Private equity-backed buyers absorbed several counsel and direct-response firms in 2025 and 2026, including MissionWired's purchase of BWF in June 2026.
Direct mail leads as recurring giving grows fastest
Large organizations lead while smaller ones adopt low-cost platforms
Based on organization size, the market is categorized into large organizations and small and mid-sized organizations. Large Organizations led with 58.0% of 2025 value because universities, hospital foundations and national charities buy enterprise donor databases, multiyear campaign counsel and outsourced mail programs together. Small and Mid-Sized Organizations grow fastest at 5.8% a year as low-cost donor management tools reach them, and Bloomerang, which added online giving through its January 2024 purchase of Qgiv, says it supports more than 16,000 nonprofits. Free tools lower the entry cost, although small buyers are the first to cut paid add-ons when budgets tighten.
Charities lead as college campaigns add spending fastest
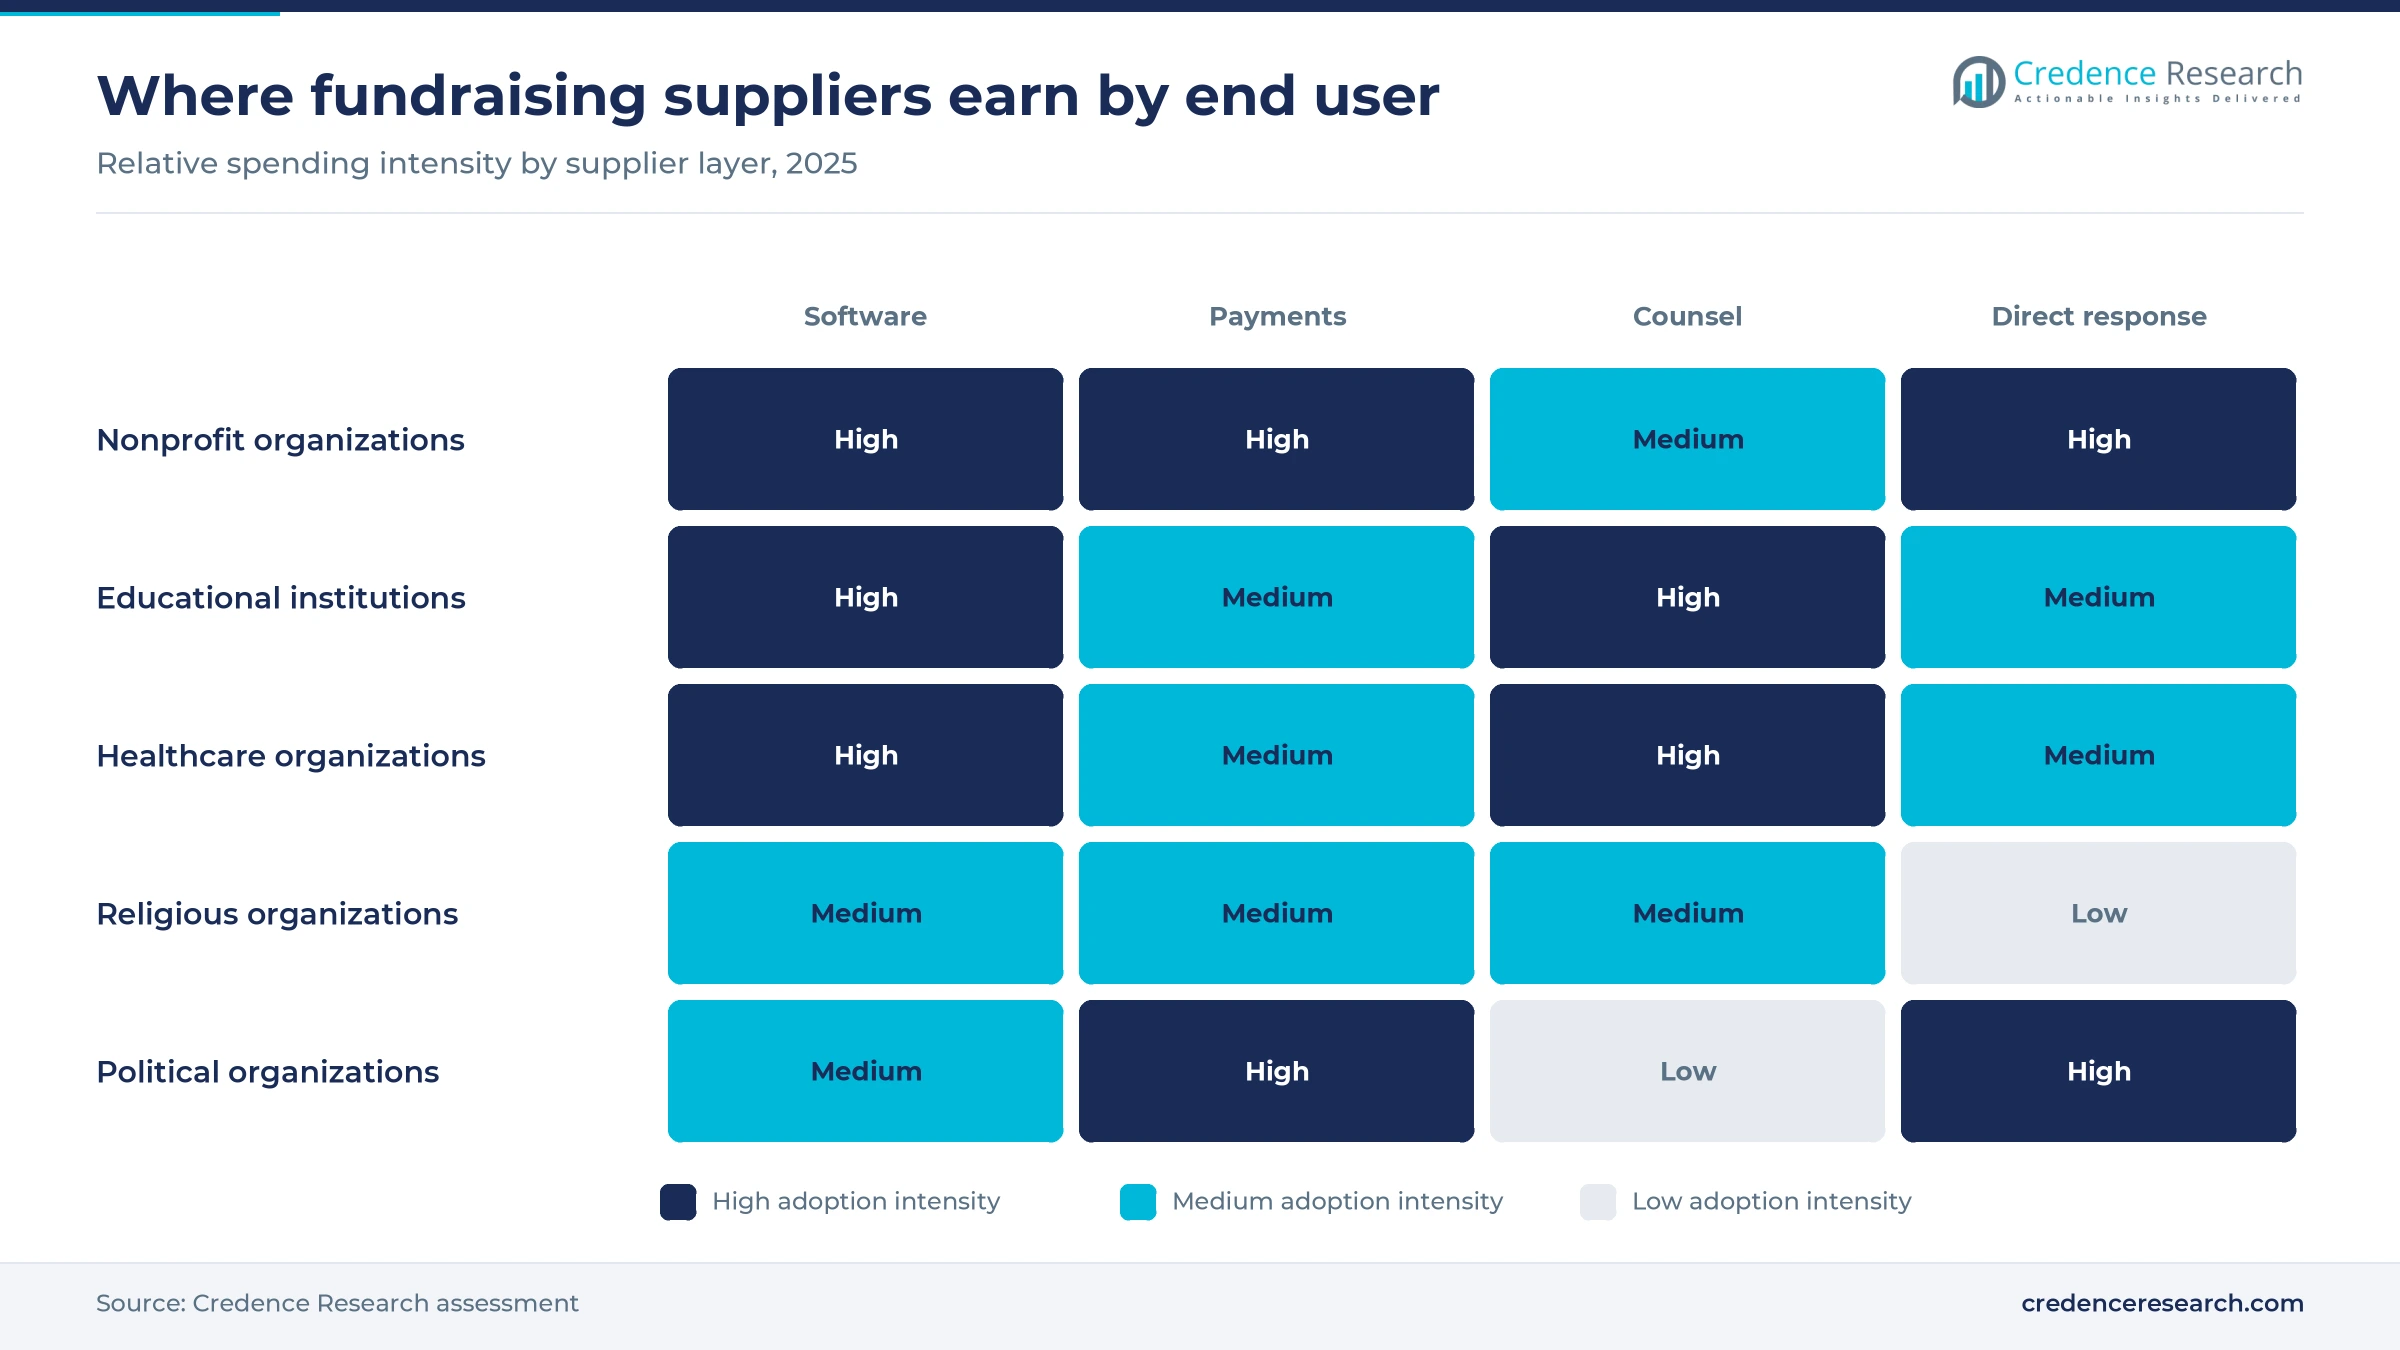
Based on end user, the market is categorized into nonprofit organizations, educational institutions, healthcare organizations, religious organizations, political organizations and others. Nonprofit Organizations led with 38.0% of 2025 value because human services, environmental and international charities depend on mass individual giving that needs paid acquisition and processing. Educational Institutions grow fastest at 6.1% a year as campaigns expand, and CASE estimates U.S. colleges raised USD 78.8 billion in fiscal 2025, up 4%, while alumni giving rose 10.9% from fewer alumni donors. Religious organizations add the least new spending, since Giving USA shows giving to religion rose only 2.4% in 2025.
Printed appeals lead while monthly giving compounds fastest
Based on fundraising model, the market is categorized into direct mail and telefundraising, recurring giving, event-based fundraising, peer-to-peer fundraising and crowdfunding. Direct Mail and Telefundraising led with 30.0% of 2025 value because older donors still answer printed appeals, and agencies bill for list rental, printing, mail handling and calling. Recurring Giving grows fastest at 6.7% a year as monthly programs replace one-off appeals, and the M+R Benchmarks 2026 study found monthly gifts made up 27% of online revenue in 2025, rising to 37% at extra-large nonprofits. Each retained monthly donor also lowers acquisition cost per dollar raised.
| Segment Group | Leading Sub-segment | Share, 2025 | Fastest-growing Sub-segment | CAGR, 2026–2035 |
|---|---|---|---|---|
| By Organization Size | Large Organizations | 58.0% | Small and Mid-Sized Organizations | 5.8% |
| By End User | Nonprofit Organizations | 38.0% | Educational Institutions | 6.1% |
| By Fundraising Model | Direct Mail and Telefundraising | 30.0% | Recurring Giving | 6.7% |
Per-gift fees and retainers set what nonprofits pay
Pricing in this market splits into three layers with different economics for suppliers. Online tools charge a percentage of each gift, so vendor revenue tracks donation volume rather than staff numbers, and free or tip-funded plans have pushed the headline platform fee toward zero for small organizations. Card networks still set a floor of about 2% per gift that no vendor can remove. Counsel is priced differently, because the AFP Code of Ethics bars members from accepting compensation based on a percentage of contributions, so firms bill fixed retainers tied to campaign length. Large organizations negotiate subscription and processing rates together, which favors vendors that own both layers.
| Offer or segment | Typical price or fee | Basis |
|---|---|---|
| Hosted donation forms, free plan | 2.95%–3.95% platform fee plus processing | Donorbox pricing page, 2026 |
| Card processing at nonprofit rates | 2.2% + USD 0.30 (Stripe) or 1.99% + USD 0.49 (PayPal) per gift | Donorbox pricing page, 2026 |
| AI-optimized donation forms | 4% per transaction plus processing | Fundraise Up, via TechCrunch, January 2025 |
| Personal crowdfunding | 2.9% + USD 0.30 per U.S. donation | GoFundMe pricing page, 2026 |
| Campaign counsel retainer | USD 5,000–30,000 per month | Credence Research estimate from fixed-fee engagement models |
Request a Free Sample
Fill in your details and we'll send you a free sample report.
- Sample data tables & charts
- Research methodology
Concentrated wealth and online gifts lift supplier spend
Concentrated wealth shifts budgets toward major-gift counsel
Giving is concentrating in fewer and larger donors, which pushes organizations to spend on prospect research, wealth screening and campaign counsel rather than on mass appeals alone. According to Giving USA 2026, bequests rose 19.7% to USD 62.19 billion in 2025, while giving by individuals rose a slower 4.1%. The Fundraising Effectiveness Project estimated that dollars rose 5% in 2025 even as donor counts fell 3.6%, continuing a decline that began in 2021. Planned-giving programs, gift-acceptance policies and major-donor portfolios each require specialist advice, so counsel firms such as CCS Fundraising and Graham-Pelton sell multiyear engagements. Organizations without a major-gift pipeline gain little from this shift and stay exposed to small-donor attrition.
Online giving growth moves spending to forms, ads and payments
Each dollar that moves online carries a processing fee, a platform fee or a software subscription, so digital growth expands supplier revenue faster than total giving. The M+R Benchmarks 2026 study of 180 nonprofits found online revenue rose 15% in 2025, and digital ad spending rose 18%. Nonprofits reinvested about USD 0.10 in ads per dollar of online revenue, which creates a steady budget line for digital agencies and ad platforms. GivingTuesday raised about USD 4 billion in the United States on Dec. 2, 2025, up 13% from 2024, according to the GivingTuesday Data Commons. Vendors that combine donation pages, payments and donor records capture most of this growth, while print-only agencies lose share.
AI agents in donor databases raise software spending per seat
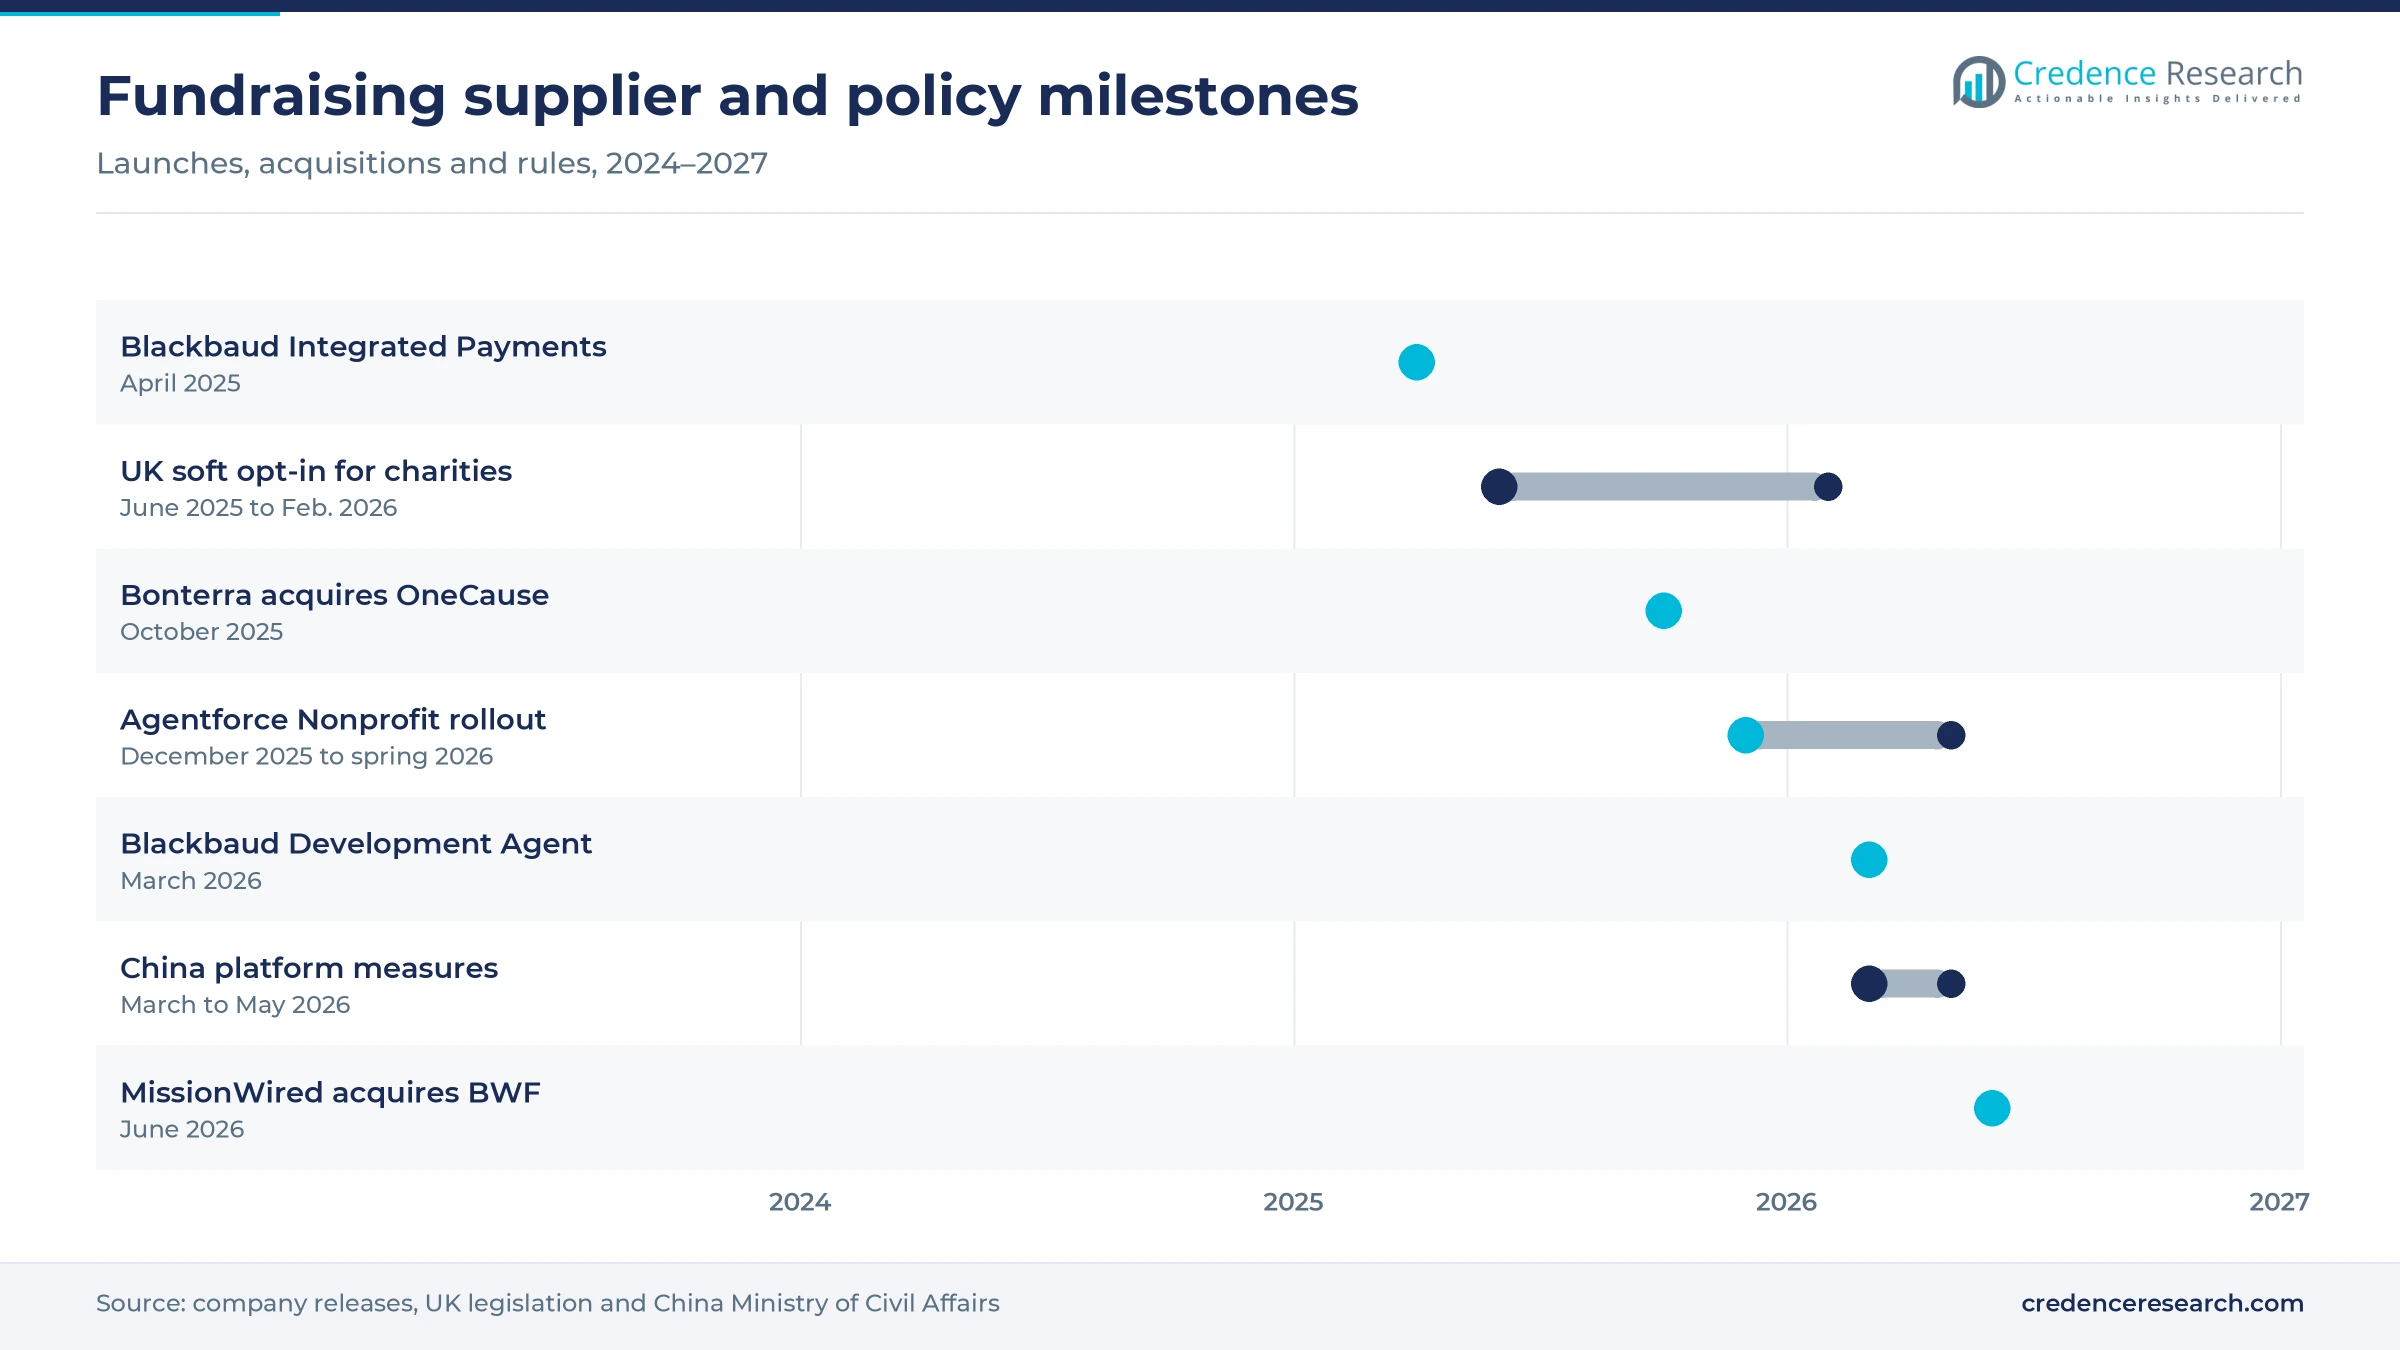
Vendors are adding AI agents that draft outreach, research prospects and answer donors, which lets them charge more per seat and gives fundraisers a reason to upgrade. Blackbaud made its Development Agent generally available to U.S. Raiser's Edge NXT customers on March 17, 2026, with an international release and Enterprise Fundraising CRM support still planned. Salesforce announced Agentforce Nonprofit on Dec. 2, 2025, with a Prospect Research agent available at launch and a Donor Support agent scheduled for beta in spring 2026. Fundraise Up raised USD 70 million in January 2025 to expand AI donation forms used by more than 3,000 organizations. Large organizations with clean donor data benefit first, while small teams with fragmented records gain less.
Embedded payments turn donor software into a transaction business
Software vendors increasingly earn on the gift itself, since a payment layer attached to the donor database takes a share of every transaction. Blackbaud launched Blackbaud Integrated Payments on April 23, 2025, extending its processing to third-party tools for auctions, text-to-give, canvassing and telemarketing. Givebutter says it serves more than 70,000 nonprofits and has processed USD 7 billion in donations, while GoFundMe recorded about 79 million donations in 2025, including 32 million to nonprofits. Payment revenue rises with gift volume rather than seat counts, which makes vendor income less exposed to staff cuts at charities. Organizations, however, give up some pricing power, because switching processors means rebuilding forms and recurring-gift mandates.
Roll-ups and free platforms reshape supplier economics
Private equity roll-ups rise in campaign counsel and direct response
Counsel and direct-response firms are shifting toward private equity ownership to fund analytics and technology practices, creating openings for combined advisory and data services across higher education, health and charities. MissionWired, backed by Stone-Goff Partners, acquired BWF on June 5, 2026, and plans to combine it with Zuri Group as BWF Zuri. Carey & Co. added Lautman Maska Neill & Company in July 2026, its third purchase in about 18 months after Schultz & Williams and Noble Accounting. Northlane Capital Partners, whose principals have invested about USD 1.8 billion of equity, backed Plus Delta Partners, a fundraising training firm, in January 2025. Buyers gain one contract for strategy, data and appeals, while independent boutiques face pricing pressure from larger groups.
Free and tip-funded platforms emerge as the default for small charities
Online giving vendors are shifting toward donor-paid tips and free plans to win small organizations that resist subscription fees, creating openings for later upsells in CRM, events and payments. Zeffy lists every feature as free and says it covers card and transaction fees, relying on voluntary contributions from donors. Givebutter charges nothing when tips are enabled and says 92% of donors add one, while accounts that switch tips off pay a 3% platform fee plus processing. GoFundMe also runs fundraisers in 20 countries with a 0% platform fee. Paid-form vendors must now justify their fees with higher conversion, which compresses take rates for mid-market suppliers and pushes them toward premium analytics.
U.K. charities gain a cheaper route to email and text supporters
The U.K. soft opt-in for charities opens a clear opening for email, SMS and CRM suppliers, because charities can now market electronically to interested supporters without separate consent. The charitable purpose soft opt-in came into force on Feb. 5, 2026, under section 114 of the Data (Use and Access) Act 2025, which received Royal Assent on June 19, 2025, according to the Fundraising Regulator. The rule covers email, text and social media messages but not telephone calls, and it applies only to contact details collected on or after the start date. Charities therefore need data-capture forms, opt-out handling and consent records rebuilt in their donor databases. CRM vendors and digital agencies serving U.K. charities can sell those changes as projects in 2026 and 2027.
Galas and auctions open cross-selling for event platforms
Galas, auctions and walk events remain a large opening for suppliers that combine ticketing, mobile bidding and donor records in one system. Bonterra acquired OneCause on Oct. 15, 2025, adding more than 6,000 nonprofit clients, and OneCause says it has helped over 14,000 nonprofits in the U.S. and Canada raise USD 8 billion since 2008. Event revenue arrives in a few nights a year, so organizations pay for mobile bidding, text appeals and check-in tools that raise the yield per guest. General event management software vendors rarely handle gift receipts or charitable tax rules, which leaves this niche to specialists. Suite owners can then sell CRM and payments to event-only clients.
Fewer donors and rising postage constrain growth
A shrinking donor base raises the cost of each new gift
Fewer people give each year, which raises the cost of acquiring a donor and squeezes agencies paid to replace lapsed supporters. The Charities Aid Foundation estimated that U.K. giving fell 10% to GBP 14 billion in 2025, and that about 31 million people gave, down from 37 million in 2016. Direct-response agencies and small charities that rely on mass appeals are most exposed. Suppliers respond by selling retention analytics, although retention gains rarely offset a smaller donor pool.
Postage costs and falling mail volume pressure direct response
Printed appeals remain the largest model, yet postage keeps rising faster than response rates. U.S. Marketing Mail volume fell 1.9% in July 2025 from a year earlier while revenue rose 1.9% after the July 13 price increase, according to The NonProfit Times. Mail houses, list brokers and charities with older donor files absorb most of this cost. Agencies offset part of it with direct mail automation software that trims low-value segments, which also reduces billed volume.
Data-security failures carry regulatory and reputational costs
Donor databases hold bank details and giving histories, so a breach at one vendor exposes thousands of organizations at once. The U.S. Federal Trade Commission finalized an order against Blackbaud on May 20, 2024, requiring it to delete data it no longer needs and to run a comprehensive security program after its 2020 ransomware breach. Smaller vendors face the same expectations with thinner security budgets. Buyers now add security reviews to procurement, which lengthens sales cycles for every supplier in the market.
Platform rules and weaker matching cut China's online giving
Platform rules can shrink online giving quickly where a few internet companies control the channel. Tencent's 99 Giving Day raised about 1.08 billion yuan in 2024, down 71.7% from the previous year, after stricter matching criteria, according to The Diplomat. Five Chinese authorities then adopted new public fundraising platform measures on March 25, 2026, effective May 1, 2026. Charities that rely on one designated platform are most exposed, and foreign suppliers have little access to Chinese donors.
North America leads as Asia Pacific grows fastest
| Region | Value, 2025 (USD billion) | Share, 2025 | CAGR, 2026–2035 |
|---|---|---|---|
| North America | 6.88 | 44.0% | 4.8% |
| Europe | 4.22 | 27.0% | 4.5% |
| Asia Pacific | 2.97 | 19.0% | 6.5% |
| Latin America | 0.78 | 5.0% | 5.8% |
| Middle East & Africa | 0.78 | 5.0% | 6.1% |
North America leads on political, college and charity spending
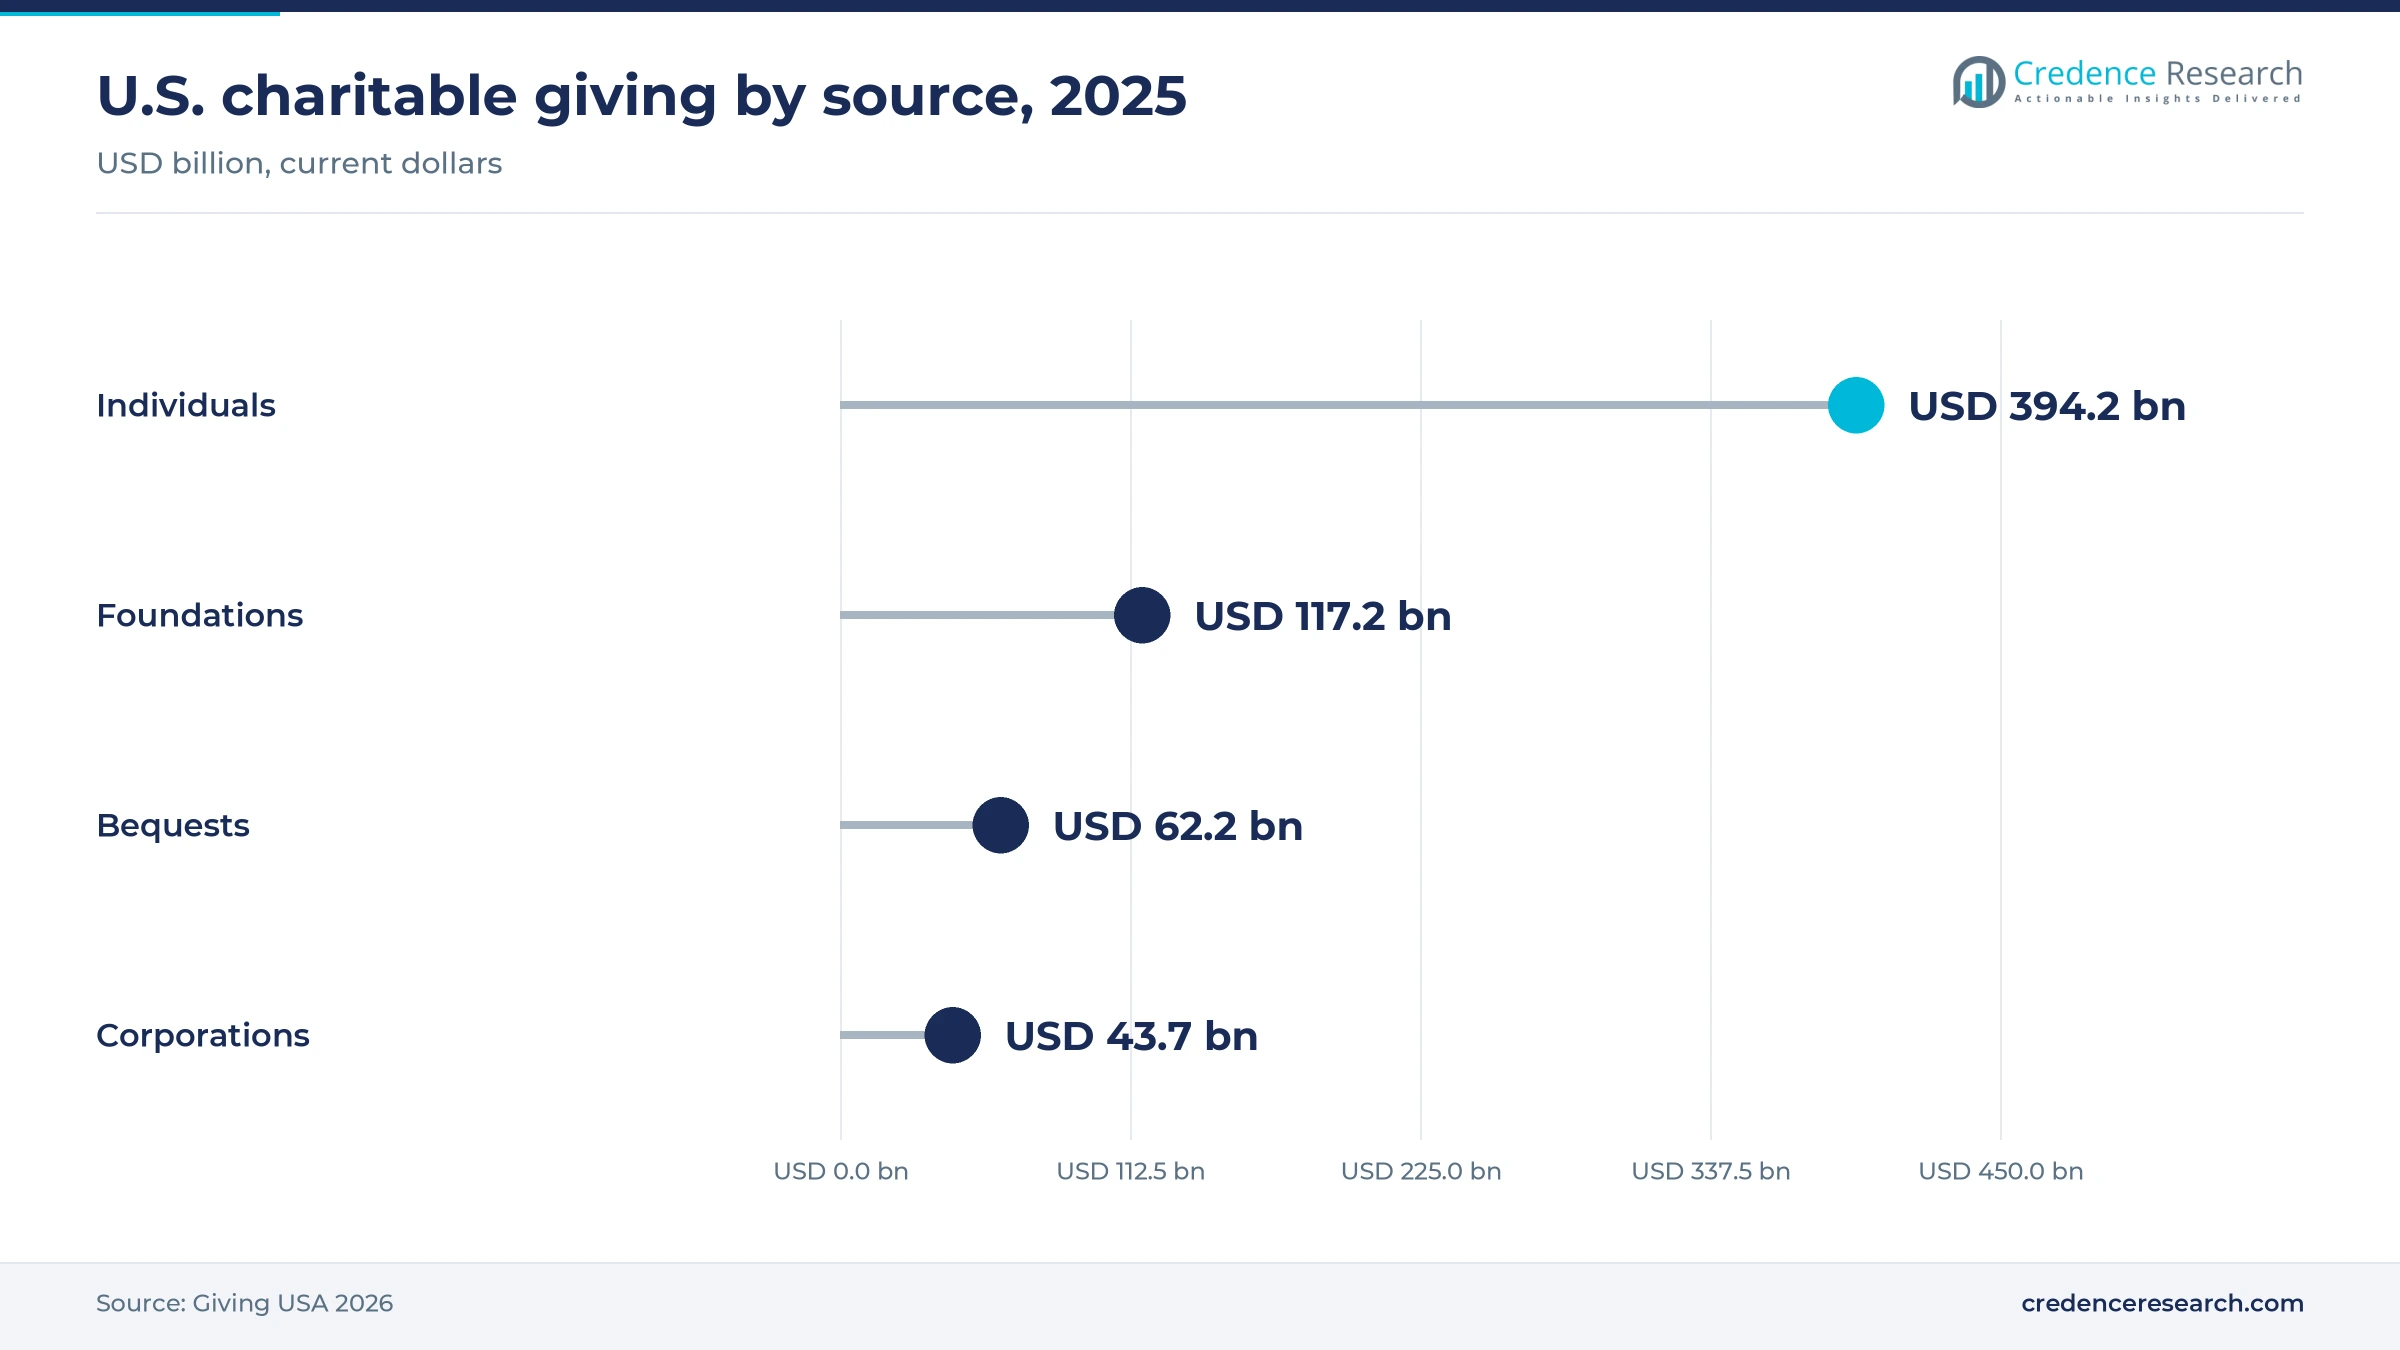
North America held 44.0% of 2025 value and grows at 4.8% a year. U.S. charities, colleges and political committees buy the most donor software and counsel, and individuals alone gave USD 394.2 billion in 2025, according to Giving USA, a gift flow that increasingly passes through paid forms and processors. In Canada, just over 5 million tax filers claimed CAD 12.8 billion in donations in 2023, according to Statistics Canada, although donors earning under CAD 60,000 fell 5.7%. That split favors vendors selling major-gift tools over mass-acquisition programs.
Europe grows slowest as U.K. giving falls
Europe held 27.0% of 2025 value and grows at 4.5% a year, the slowest pace among the five regions. The United Kingdom has the deepest supplier base, with telephone, face-to-face and digital agencies overseen by the Fundraising Regulator, but the fall in U.K. giving noted above limits agency budgets. The soft opt-in change creates CRM project work, while GDPR consent rules in the EU keep acquisition costs high.
Asia Pacific grows fastest on Indian CSR and Australian donors
Asia Pacific held 19.0% of 2025 value and grows fastest at 6.5% a year, although the pace differs sharply by country. Indian companies spent Rs 34,908.75 crore on mandatory CSR programs in fiscal 2024, according to the National CSR Portal, which creates demand for grant and donor management tools at implementing charities. GoFundMe ranked Australia fourth among its markets for donors per capita in 2025. The China platform contraction described above caps growth in the largest economy, which leaves India and Australia as the main sources of new spending.
Latin America builds on record Brazilian giving
Latin America held 5.0% of 2025 value and grows at 5.8% a year. Brazilians gave a record R$24.3 billion in individual donations in 2024, and the median gift per donor rose from R$300 to R$480 since 2022, according to the Pesquisa Doação Brasil by IDIS. Instant payment rails let small charities accept digital gifts without card fees, which favors local donation-page providers over imported CRM suites. Outside Brazil, public data on supplier spending are thin, so the split across other countries rests on Credence Research estimates.
Middle East and Africa grow around state giving platforms
The Middle East and Africa held 5.0% of 2025 value and grow at 6.1% a year from a small base. Saudi Arabia's Ehsan national platform collected SR 4.5 billion through 135 million donations in 2025, according to figures presented by the Saudi Data and Artificial Intelligence Authority. State platforms like Ehsan capture zakat and Ramadan giving that would otherwise need private payment and CRM vendors, which narrows the opening for international suppliers. Growth comes instead from international NGO offices and Gulf charities that buy CRM and payment tools for overseas donors, a Credence Research estimate where public data are thin.
Acquisitions and AI launches mark 2025 and 2026
| Development | Status and market relevance |
|---|---|
| In April 2025, Blackbaud launched Blackbaud Integrated Payments, extending its processing to third-party auction, text-to-give, canvassing and telemarketing tools. | Product launch, commercially available; it moves Blackbaud further into transaction revenue. |
| In October 2025, Bonterra acquired OneCause, adding more than 6,000 nonprofit clients and its auction, ticketing and mobile bidding software. | Completed acquisition; it joins event software to Bonterra's CRM and payments suite. |
| In December 2025, Salesforce announced Agentforce Nonprofit with four AI agents for fundraising, programs, volunteers and donor support. | Announcement with two agents generally available and two in beta; it raises the AI standard for CRM rivals. |
| In March 2026, Blackbaud made its Development Agent generally available to U.S. Raiser's Edge NXT customers. | Operational launch in the U.S.; international release and other products are planned. |
| In June 2026, MissionWired acquired BWF and announced plans to combine it with Zuri Group as BWF Zuri. | Completed acquisition, combination planned; it concentrates campaign counsel and technology consulting. |
AI agents and embedded payments shape vendor choice
- AI prospect research agents scan donor records and public wealth signals to rank prospects and draft outreach, cutting research hours for major-gift officers.
- Embedded payment processing ties card, wallet and bank transfers to the donor record, so recurring mandates and receipts update without manual reconciliation.
- Mobile bidding and event platforms run auctions, ticketing and text appeals from guests' phones, which raises the yield per attendee at galas.
- Peer-to-peer campaign pages let supporters raise money from their own networks for walks, rides and birthdays, with nonprofit crowdfunding platforms competing mainly on fees.
Need a Custom Version of This Report?
Tailor the scope, geography, or segments to your exact requirements.
- Custom geography or segment scope
- Direct access to our analyst team
Software suites and counsel firms compete on data
Competition in this market runs on two separate tracks with different buying criteria. Software vendors compete on the depth of donor data, payments and AI tools, while counsel firms compete on campaign track records in higher education, health and large charities. Blackbaud remains the largest specialist suite for large organizations, and it is adding AI agents and payments to defend that base. Bonterra has built a rival suite through acquisitions, the latest being OneCause in events. Salesforce sells its nonprofit CRM through implementation partners and is moving into AI agents. Below them, Givebutter, Bloomerang, Donorbox and Fundraise Up compete for small and mid-sized organizations with low or tip-funded pricing. GoFundMe leads personal crowdfunding and sells GoFundMe Pro to nonprofits. In counsel, CCS Fundraising, Campbell & Company, Graham-Pelton and BWF win capital campaigns through sector teams and references, which new entrants find hard to copy, while Carey & Co. pairs campaign counsel with direct response.
How concentrated is the supply side?
Supply is split between a few software suites and a long tail of agencies and boutiques. Blackbaud, Bonterra and Salesforce hold the largest installed bases among large organizations, while Bloomerang, Givebutter, Donorbox and dozens of form vendors compete for small charities on price. Counsel and direct-response work stays fragmented, although the roll-ups described above are concentrating it. Barriers sit in donor data, since migrating years of gift history, recurring mandates and tax receipts is costly. Margins are highest in payment processing attached to software and lowest in print production, where postage is a pass-through.
Companies profiled and their roles in this market
| Company | Type | Role in the market |
|---|---|---|
| Blackbaud, Inc. | Software suite | Raiser's Edge NXT donor CRM, online giving, payments and AI agents |
| Bonterra | Software suite | EveryAction CRM, OneCause events, DonorDrive peer-to-peer and GiveGab giving days |
| Salesforce, Inc. | CRM platform | Nonprofit Cloud and Agentforce Nonprofit AI agents for fundraising teams |
| GoFundMe (GoFundMe Pro) | Giving platform | Personal crowdfunding and GoFundMe Pro donation and peer-to-peer software |
| Givebutter | Giving platform | Tip-funded donation forms, events, CRM and payments for small nonprofits |
| Bloomerang | Donor CRM | Donor management CRM with Qgiv online giving and event tools |
| Fundraise Up | Specialist | AI-optimized donation forms priced per transaction |
| Donorbox | Giving platform | Hosted donation forms, recurring giving and peer-to-peer pages |
| CCS Fundraising | Counsel firm | Campaign counsel, planning studies and interim fundraising staff |
| Campbell & Company | Counsel firm | Campaign counsel, major gift strategy and fundraising communications |
| Graham-Pelton | Counsel firm | Capital campaign counsel and development planning for nonprofits |
| BWF (MissionWired) | Counsel firm | Full-scope campaigns, donor analytics and technology consulting |
| Carey & Co. | Counsel and direct response | Campaign counsel, outsourced fundraising and Lautman Maska Neill direct response programs |
Supplier revenue now follows each gift, not each donor
Credence Research's view is that the fundraising market is becoming a transaction and software business with a consulting layer on top. Supplier revenue now depends less on how many people give and more on how much of each gift passes through paid forms, processors and AI tools. That favors suites that own donor data and payments, and it exposes print agencies and small form vendors that lack a data advantage. Counsel firms keep pricing power in capital campaigns, but private equity owners will push them to bundle analytics and technology work with their advice.
Giving statistics and fee structures anchor the estimates
The report uses 2025 as the base year and 2026 to 2035 as the forecast period. Market values come from the Credence Research model, which updates the earlier 2024 estimate on this page to 2025 and then checks the result against public giving statistics and supplier fee structures. Regional and segment splits are Credence Research estimates built from public giving data. Sources include Giving USA, Statistics Canada, the Charities Aid Foundation, IDIS, company releases and pricing pages, regulator notices and trade press. No interviews or surveys were conducted for this edition of the report. No public statistic measures spending on counsel and direct-response agencies, so those layers carry most of the uncertainty in the estimate.
Digital share of giving carries spending through 2035
Through 2035, fundraising spending should grow faster than total giving, because a rising share of gifts moves through paid digital channels. Recurring programs, AI-assisted major-gift work and embedded payments are the main sources of new supplier revenue. Print and telephone programs will shrink as a share of value, yet they remain material while older donors hold most wealth. Rules on donor data in the U.K., the EU and China will keep shaping which channels stay open. Suppliers that own donor records and payments are best placed, and boutique counsel firms will keep consolidating.
Donor counts and AI adoption decide the range to 2035
The outcome depends on two variables, the number of active donors and how fast AI tools raise spending per organization. The downside case assumes donor counts keep falling at the pace measured since 2021 and that postage inflation cuts mail programs faster than digital spending rises. The upside case assumes AI agents lift subscription prices across large organizations and that recurring giving keeps rising faster than one-off gifts. The base case sits between them, with payments growth offsetting slower counsel and print demand.
| Scenario | CAGR, 2026–2035 | Value, 2035 | What has to hold |
|---|---|---|---|
| Downside | 3.8% | USD 23.01 billion | Donor counts fall 3% to 4% a year and mail volumes shrink faster |
| Base | 5.20% | USD 25.96 billion | Online giving and payments offset slower print and counsel spending |
| Upside | 6.5% | USD 28.99 billion | AI agents raise software spend per seat and monthly giving keeps compounding |
Frequently Asked Questions
How big is the fundraising market?
What does the fundraising market include?
Which fundraising model holds the largest share?
Which region leads the fundraising market?
What are the main fundraising industry trends?
Who are the leading companies in the fundraising market?
How much do online fundraising platforms charge?
How fast is online giving growing?
Table of Content
Chapter 1 Market Segmentation
- 1.1 Segmentation Framework
- 1.1.1 Product and Service Classification
- 1.1.2 Application and End-Use Classification
- 1.1.3 Technology and Solution Classification
- 1.1.4 Customer and Distribution Channel Classification
- 1.1.5 Geographic Segmentation
- 1.1.6 Market Segment Definitions and Boundaries
- 1.2 By Organization Size
- 1.2.1 Large Organizations
- 1.2.2 Small and Mid-Sized Organizations
- 1.3 By End User
- 1.3.1 Nonprofit Organizations
- 1.3.2 Educational Institutions
- 1.3.3 Healthcare Organizations
- 1.3.4 Religious Organizations
- 1.3.5 Political Organizations
- 1.3.6 Others
- 1.4 By Fundraising Model
- 1.4.1 Direct Mail and Telefundraising
- 1.4.2 Recurring Giving
- 1.4.3 Event-Based Fundraising
- 1.4.4 Peer-to-Peer Fundraising
- 1.4.5 Crowdfunding
Chapter 2 Introduction
- 2.1 Report Objectives and Scope
- 2.2 Product Definition and Industry Terminology
- 2.3 Market Inclusions and Exclusions
- 2.4 Research Process
- 2.4.1 Primary Research and Expert Interviews
- 2.4.2 Secondary Research and Source Review
- 2.4.3 Top-Down and Bottom-Up Estimation
- 2.4.4 Data Triangulation and Verification
- 2.5 Market Size Measurement Basis
- 2.5.1 2025: USD 15.64 billion → 2035: USD 25.96 billion
- 2.6 Historical and Forecast Reference Periods
- 2.6.1 Historical Period: 2018-2025
- 2.6.2 Base Year: 2025
- 2.6.3 Forecast Period: 2025-2035
- 2.7 Research Assumptions and Limitations
Chapter 3 Executive Summary
- 3.1 Market Snapshot and Key Findings
- 3.2 Base-Year Market Size, 2025
- 3.3 Forecast Market Size, 2035
- 3.4 Revenue and Volume Growth Outlook
- 3.5 Key Demand and Supply Indicators
- 3.6 Leading Market Segments
- 3.7 Fastest-Growing Market Opportunities
- 3.8 Regional Performance Highlights
- 3.9 Technology and Industry Transformation
- 3.10 Competitive Landscape Summary
- 3.11 Analyst View and Strategic Implications
Chapter 4 Global Fundraising Market Trends and Developments
- 4.1 Historical Industry Development, 2018-2025
- 4.2 Recent Market Trends and Developments
- 4.3 Demand and Customer Behavior Trends
- 4.4 Technology and Product Innovation
- 4.5 Artificial Intelligence, Automation and Digitalization
- 4.6 Local Manufacturing and Supply Chain Realignment
- 4.7 Industry Partnerships, Mergers and Acquisitions
- 4.8 Sustainability and Circular Economy Developments
- 4.9 Government and Private Sector Investment Trends
- 4.10 Emerging Business Models and Commercialization
- 4.11 Industry Developments and Announcements
Chapter 5 Global Fundraising Market Production, Supply and Demand Analysis
- 5.1 Demand Trend and Consumption Analysis, 2018-2025
- 5.2 Demand Forecast, 2025-2035
- 5.3 Production and Output Trend, 2018-2025
- 5.4 Production and Output Forecast, 2025-2035
- 5.5 Installed Capacity and Capacity Utilization
- 5.6 Company-Wise Production Plants and Statistics
- 5.6.1 Installed Production Capacity
- 5.6.2 Actual Production
- 5.6.3 Planned Capacity and Expansion Targets
- 5.7 Supply Chain Structure and Procurement Trends
- 5.8 Supply-Demand Gap and Bottlenecks
- 5.9 Import Dependence and Sourcing Structure
- 5.10 Contract Manufacturing and Outsourcing
- 5.11 Regional Supply and Demand Concentration
Chapter 6 Global Fundraising Market Pricing Analysis
- 6.1 Pricing Structure and Measurement
- 6.2 Historical Pricing Trends, 2018-2025
- 6.3 Pricing Outlook, 2025-2035
- 6.4 Average Selling Price and Unit Economics
- 6.5 Pricing by Product and Market Segment
- 6.6 Geographic Pricing Differences
- 6.7 Key Input, Energy, Labor and Logistics Costs
- 6.8 Contract Pricing and Purchasing Models
- 6.9 Pricing Sensitivity and Competitive Positioning
- 6.10 Price, Margin and Profitability Implications
Chapter 7 Global Fundraising Market Dynamics
- 7.1 Market Growth Drivers
- 7.1.1 Demand-Side Drivers
- 7.1.2 Technology and Innovation Drivers
- 7.1.3 Infrastructure and Investment Drivers
- 7.1.4 Regulatory and Policy Drivers
- 7.2 Market Restraints
- 7.2.1 Cost and Affordability Constraints
- 7.2.2 Technology and Adoption Barriers
- 7.2.3 Supply Chain and Operational Constraints
- 7.3 Market Challenges
- 7.3.1 Competitive Pressure and Margin Erosion
- 7.3.2 Skills, Infrastructure and Implementation Gaps
- 7.4 Emerging Market Opportunities
- 7.5 Market Dynamics Impact and Time-Horizon Assessment
Chapter 8 Global Fundraising Value Chain Analysis
- 8.1 Industry Value Chain Overview
- 8.2 Upstream Suppliers and Critical Inputs
- 8.3 Technology and Component Providers
- 8.4 Manufacturing or Service Delivery
- 8.5 Distribution, Channel Partners and Integrators
- 8.6 Downstream Applications and End Users
- 8.7 Value Addition and Profit Pools
- 8.8 Vertical Integration and Outsourcing
- 8.9 Supplier Concentration and Risk
- 8.10 Supply Chain Localization and Resilience
Chapter 9 Global Fundraising Market Regulations and Policies
- 9.1 Relevant Laws, Standards and Compliance Frameworks
- 9.2 Product, Service, Safety and Quality Requirements
- 9.3 Government Policies, Incentives and Subsidies
- 9.4 Imports, Exports and Trade Barriers
- 9.5 Public Procurement and Local Content Requirements
- 9.6 Environmental and Sustainability Compliance
- 9.7 Data Protection, AI and Cybersecurity Compliance
- 9.8 Upcoming Policy Changes and Market Implications
Chapter 10 Global Fundraising Market Hotspots and Opportunities
- 10.1 Market Opportunity Mapping and Growth Hotspots
- 10.2 High-Growth Applications and Customer Groups
- 10.3 Underserved Markets and White-Space Opportunities
- 10.4 Emerging Technology and Product Opportunities
- 10.5 New Capacity and Investment Hotspots
- 10.6 Market Entry and Expansion Opportunities
- 10.7 Distribution and Partnership Opportunities
- 10.8 Near-Term and Long-Term Commercial Potential
- 10.9 Opportunity Attractiveness and Execution Risks
Chapter 11 Global Fundraising Market Outlook, 2025-2035
- 11.1 Market Size and Analysis
- 11.1.1 Revenue (Market Measurement: 2025: USD 15.64 billion → 2035: USD 25.96 billion)
- 11.1.2 Market Volume and Quantity Sold
- 11.1.3 Historical Market Size, 2018-2025
- 11.1.4 Base-Year Market Size, 2025
- 11.2 Market Forecast, 2025-2035
- 11.2.1 Revenue Forecast to 2035
- 11.2.2 Volume Forecast to 2035
- 11.2.3 CAGR and Year-on-Year Growth
- 11.2.4 Incremental Revenue Opportunity
- 11.3 Forecast Assumptions and Scenario Analysis
- 11.3.1 Base-Case Forecast
- 11.3.2 Optimistic and Conservative Scenarios
- 11.3.3 Technology, Pricing and Policy Sensitivities
- 11.4 Market Attractiveness and Growth Outlook
Chapter 12 Global Fundraising Market Segmentation and Outlook
- 12.1 Segmentation Summary and Market Shares, 2025
- 12.2 Largest and Fastest-Growing Segments
- 12.3 By Organization Size - Market Size and Forecast, 2025-2035
- 12.3.1 Segment Definition and Scope
- 12.3.2 Historical Market Size, 2018-2025
- 12.3.3 Revenue Forecast, 2025-2035
- 12.3.4 Volume Forecast, 2025-2035
- 12.3.5 Base-Year Market Share, 2025
- 12.3.6 Segment CAGR and Growth Drivers
- 12.3.7 Subsegment Market Size and Forecast
- 12.3.7.1 Large Organizations
- 12.3.7.2 Small and Mid-Sized Organizations
- 12.3.8 Subsegment Pricing and Adoption Trends
- 12.3.9 Leading Suppliers and Competition
- 12.3.10 Regional Demand and Opportunities
- 12.4 By End User - Market Size and Forecast, 2025-2035
- 12.4.1 Segment Definition and Scope
- 12.4.2 Historical Market Size, 2018-2025
- 12.4.3 Revenue Forecast, 2025-2035
- 12.4.4 Volume Forecast, 2025-2035
- 12.4.5 Base-Year Market Share, 2025
- 12.4.6 Segment CAGR and Growth Drivers
- 12.4.7 Subsegment Market Size and Forecast
- 12.4.7.1 Nonprofit Organizations
- 12.4.7.2 Educational Institutions
- 12.4.7.3 Healthcare Organizations
- 12.4.7.4 Religious Organizations
- 12.4.7.5 Political Organizations
- 12.4.7.6 Others
- 12.4.8 Subsegment Pricing and Adoption Trends
- 12.4.9 Leading Suppliers and Competition
- 12.4.10 Regional Demand and Opportunities
- 12.5 By Fundraising Model - Market Size and Forecast, 2025-2035
- 12.5.1 Segment Definition and Scope
- 12.5.2 Historical Market Size, 2018-2025
- 12.5.3 Revenue Forecast, 2025-2035
- 12.5.4 Volume Forecast, 2025-2035
- 12.5.5 Base-Year Market Share, 2025
- 12.5.6 Segment CAGR and Growth Drivers
- 12.5.7 Subsegment Market Size and Forecast
- 12.5.7.1 Direct Mail and Telefundraising
- 12.5.7.2 Recurring Giving
- 12.5.7.3 Event-Based Fundraising
- 12.5.7.4 Peer-to-Peer Fundraising
- 12.5.7.5 Crowdfunding
- 12.5.8 Subsegment Pricing and Adoption Trends
- 12.5.9 Leading Suppliers and Competition
- 12.5.10 Regional Demand and Opportunities
- 12.6 Segment Growth Comparison
- 12.7 Segment Attractiveness and Priority Matrix
Chapter 13 Global Fundraising End-Use and Application Market Outlook
- 13.1 End-Use Industry and Customer Demand Structure
- 13.2 Leading Applications and Customer Groups
- 13.3 End-Use Market Size, Share and Forecast
- 13.4 Major End-Use Industry Deep Dives
- 13.4.1 Customer Requirements and Use Cases
- 13.4.2 Demand and Replacement Cycles
- 13.4.3 Technical and Regulatory Considerations
- 13.4.4 Purchasing and Procurement Models
- 13.4.5 Leading Vendors and Distribution Channels
- 13.4.6 Forecast and Commercial Opportunities
- 13.5 Emerging Applications and Cross-Segment Demand
- 13.6 End-Use Industry Investment Priorities
Chapter 14 Global Fundraising Geographic Market Outlook, 2025-2035
- 14.1 Regional Market Size and Share, 2025
- 14.2 Regional Market Forecast, 2025-2035
- 14.3 Regional Pricing, Production and Demand Differences
- 14.4 North America
- 14.4.1 United States
- 14.4.2 Canada
- 14.4.3 Mexico
- 14.5 Europe
- 14.5.1 Germany
- 14.5.2 France
- 14.5.3 Italy
- 14.5.4 United Kingdom
- 14.5.5 Spain
- 14.5.6 Poland
- 14.5.7 Russia
- 14.5.8 Netherlands
- 14.5.9 Belgium
- 14.5.10 Sweden
- 14.5.11 Denmark
- 14.5.12 Norway
- 14.5.13 Rest of Europe
- 14.6 Asia Pacific
- 14.6.1 China
- 14.6.2 India
- 14.6.3 Japan
- 14.6.4 South Korea
- 14.6.5 Thailand
- 14.6.6 Indonesia
- 14.6.7 Vietnam
- 14.6.8 Malaysia
- 14.6.9 Australia
- 14.6.10 Rest of Asia Pacific
- 14.7 Latin America
- 14.7.1 Brazil
- 14.7.2 Argentina
- 14.7.3 Colombia
- 14.7.4 Chile
- 14.7.5 Rest of Latin America
- 14.8 Middle East
- 14.8.1 Saudi Arabia
- 14.8.2 United Arab Emirates
- 14.8.3 Turkey
- 14.8.4 Israel
- 14.8.5 Iran
- 14.8.6 Rest of the Middle East
- 14.9 Africa
- 14.9.1 South Africa
- 14.9.2 Egypt
- 14.9.3 Nigeria
- 14.9.4 Morocco
- 14.9.5 Rest of Africa
- 14.10 Regional Investment, Policy and Supply Chain Differences
- 14.11 Regional Competitive Landscape
- 14.12 Geographic Growth Hotspots
Chapter 15 Global Fundraising Technology, Innovation and Sustainability Outlook
- 15.1 Technology Landscape and Maturity
- 15.2 Product, Process and Service Innovation
- 15.3 AI, Automation and Digital Tools in the Industry
- 15.4 Technology Adoption and Performance Benchmarking
- 15.5 Innovation Pipeline and R&D Investment
- 15.6 Patent and Intellectual Property Trends
- 15.7 Energy Efficiency and Resource Management
- 15.8 Sustainability, Recycling and Circularity
- 15.9 Technology Roadmap, 2025-2035
- 15.10 Risks of Obsolescence and Technology Substitution
Chapter 16 Global Fundraising Market Key Strategic Imperatives
- 16.1 Growth and Market Entry Priorities
- 16.2 High-Return Products and Segments
- 16.3 Pricing, Profitability and Cost Optimization
- 16.4 Technology Investment and Product Differentiation
- 16.5 Supply Chain Localization and Resilience
- 16.6 Distribution and Customer Acquisition
- 16.7 Partnership, Acquisition and Capacity Strategy
- 16.8 Regional Expansion Priorities
- 16.9 Short-, Medium- and Long-Term Actions
Chapter 17 Competition Outlook
- 17.1 Industry Competition Characteristics
- 17.2 Market Structure and Concentration
- 17.3 Market Share and Competitive Positioning, 2025
- 17.4 Company-Wise Revenue and Product Benchmarking
- 17.5 Production and Service Capacity Benchmarking
- 17.6 Technology, Pricing and Differentiation
- 17.7 Regional Footprint and Distribution Strength
- 17.8 Mergers, Acquisitions and Strategic Alliances
- 17.9 New Entrants and Competitive Threats
- 17.10 Porter's Five Forces and Industry Attractiveness
- 17.11 Competitive Outlook, 2025-2035
Chapter 18 Company Profiles
- 18.1 Company Coverage and Selection Criteria
- 18.2 Blackbaud, Inc.
- 18.2.1 Business Description
- 18.2.2 Company Ownership and Geographic Presence
- 18.2.3 Product and Service Portfolio
- 18.2.4 Manufacturing and Operating Footprint
- 18.2.5 Production Capacity and Expansion Plans
- 18.2.6 Financial Performance and Investment
- 18.2.7 Market Share and Competitive Position
- 18.2.8 Technology and Innovation Capabilities
- 18.2.9 Strategic Alliances or Partnerships
- 18.2.10 Recent Developments
- 18.2.11 Growth Strategy and Outlook
- 18.3 Bonterra
- 18.4 Salesforce, Inc.
- 18.5 GoFundMe (GoFundMe Pro)
- 18.6 Givebutter
- 18.7 Bloomerang
- 18.8 Fundraise Up
- 18.9 Donorbox
- 18.10 CCS Fundraising
- 18.11 Campbell & Company
- 18.12 Graham-Pelton
- 18.13 BWF (MissionWired)
- 18.14 Carey & Co.
- 18.15 Other Relevant Market Participants
Note: Every listed company is profiled on the structure shown under the first company. The company list is preliminary and may change based on research findings, market developments, data availability and client requirements.
Chapter 19 Disclaimer
- 19.1 Research and Forecast Disclaimer
- 19.2 Data Source and Estimation Limitations
Note: The depth of individual sections depends on data availability for this market. Volume, capacity, trade and other unit-based metrics are included where applicable.

