Geriatric drugs follow a fast-aging world population
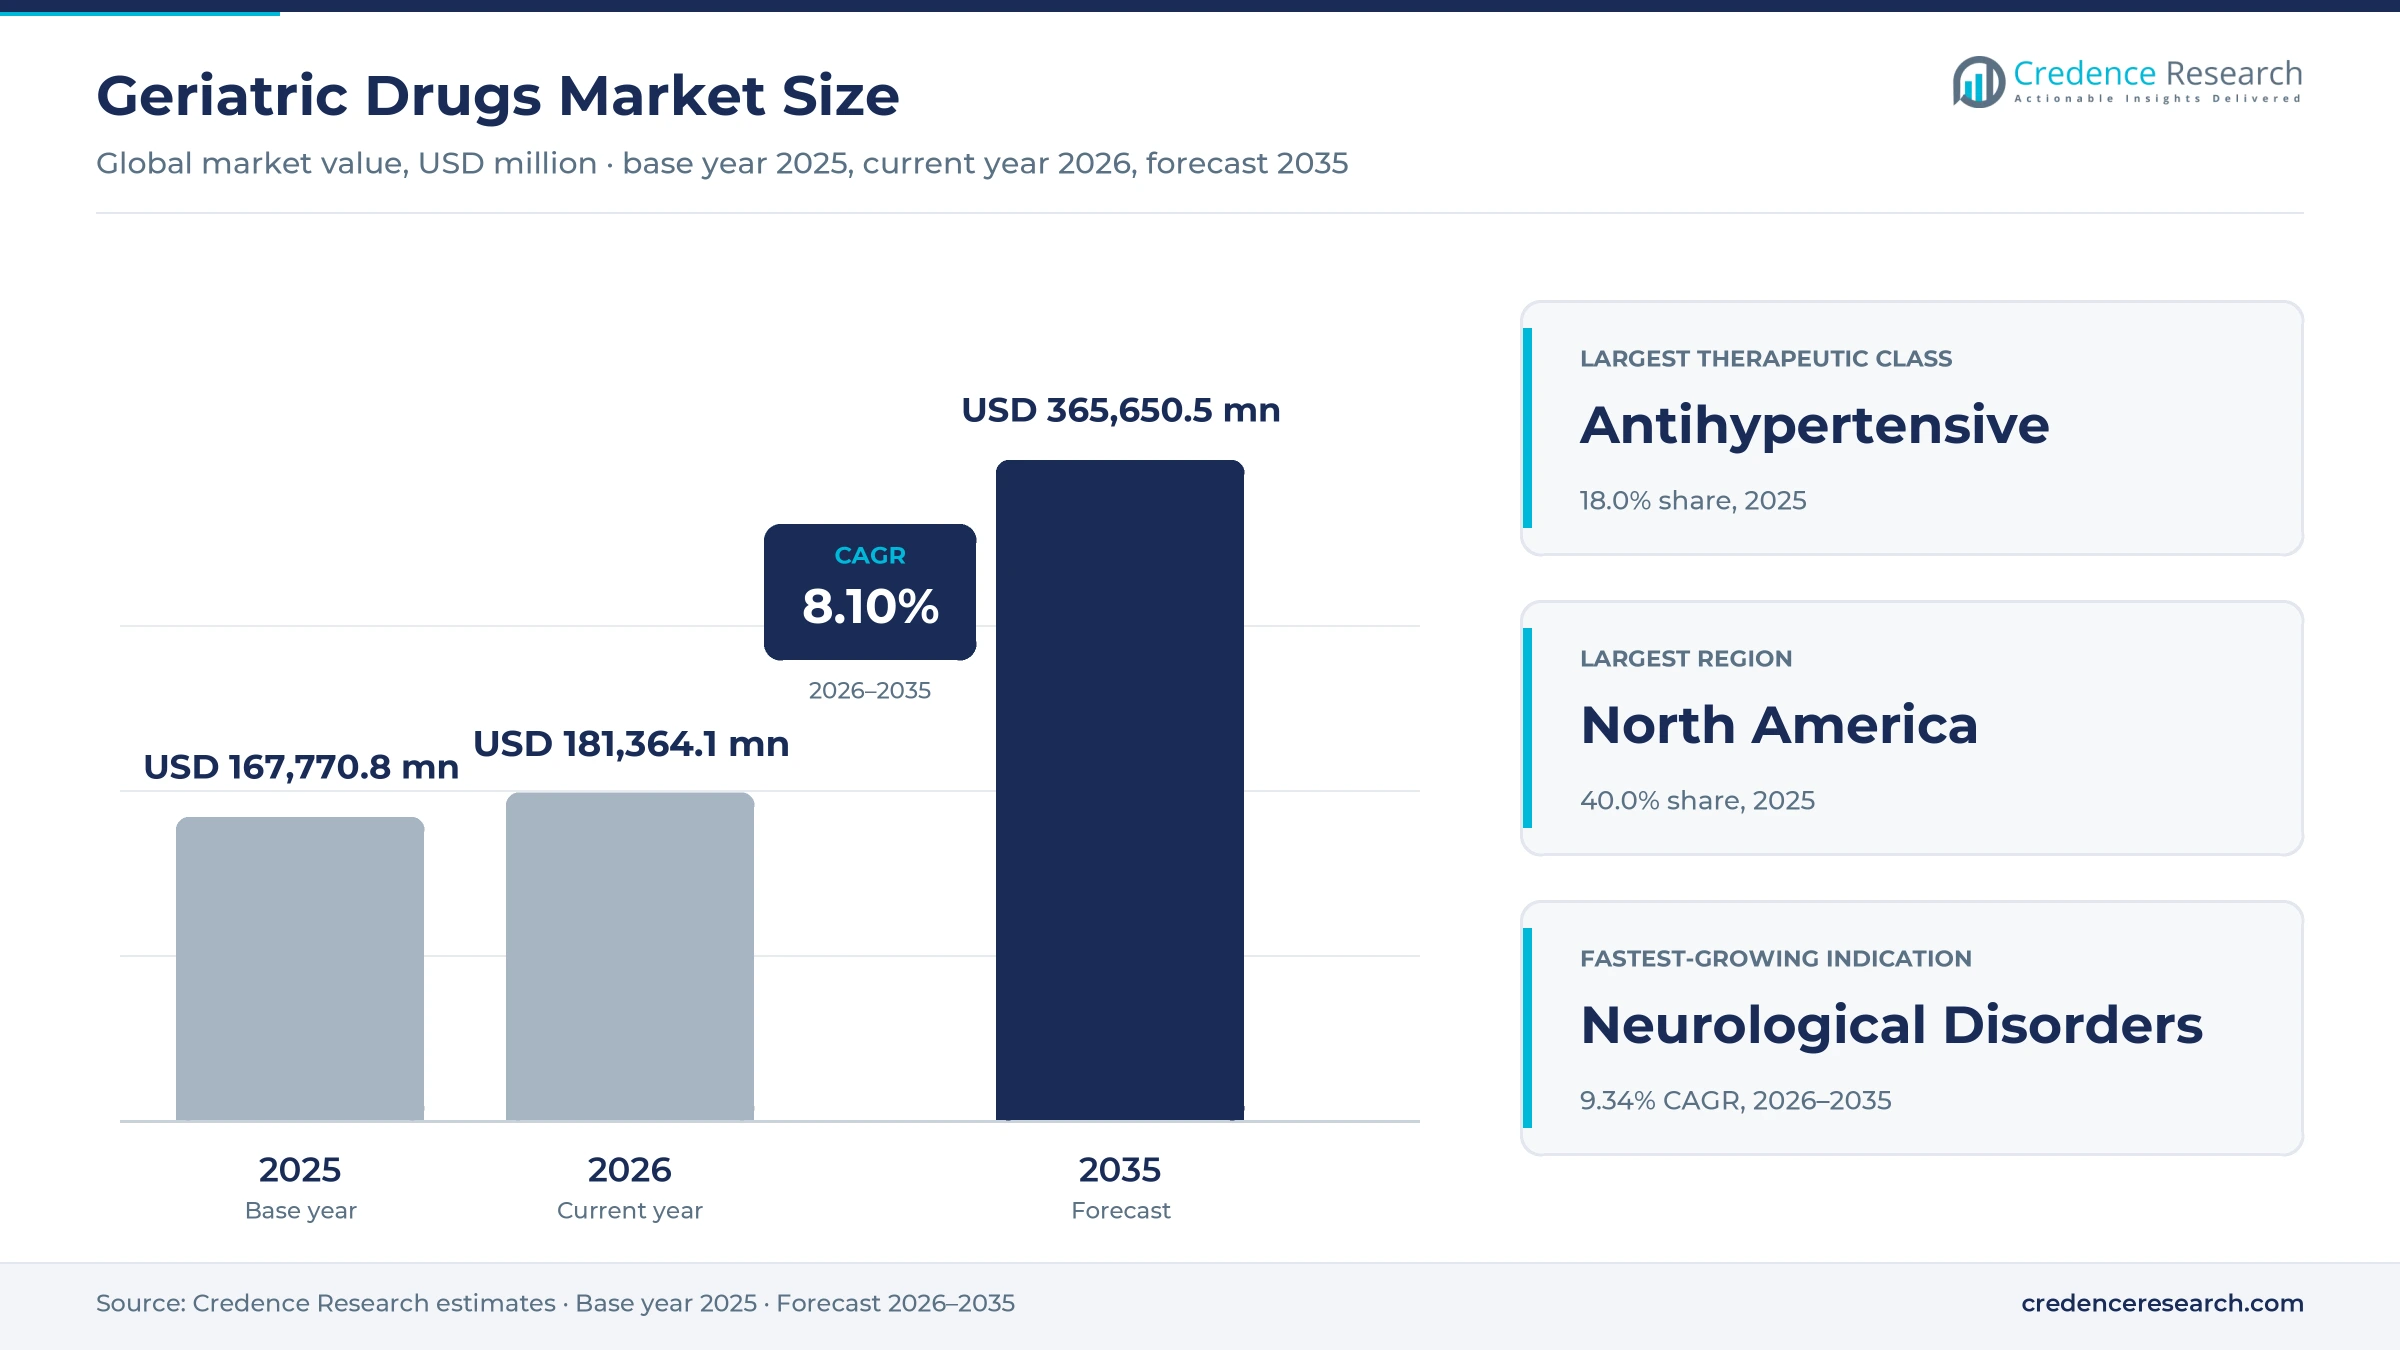
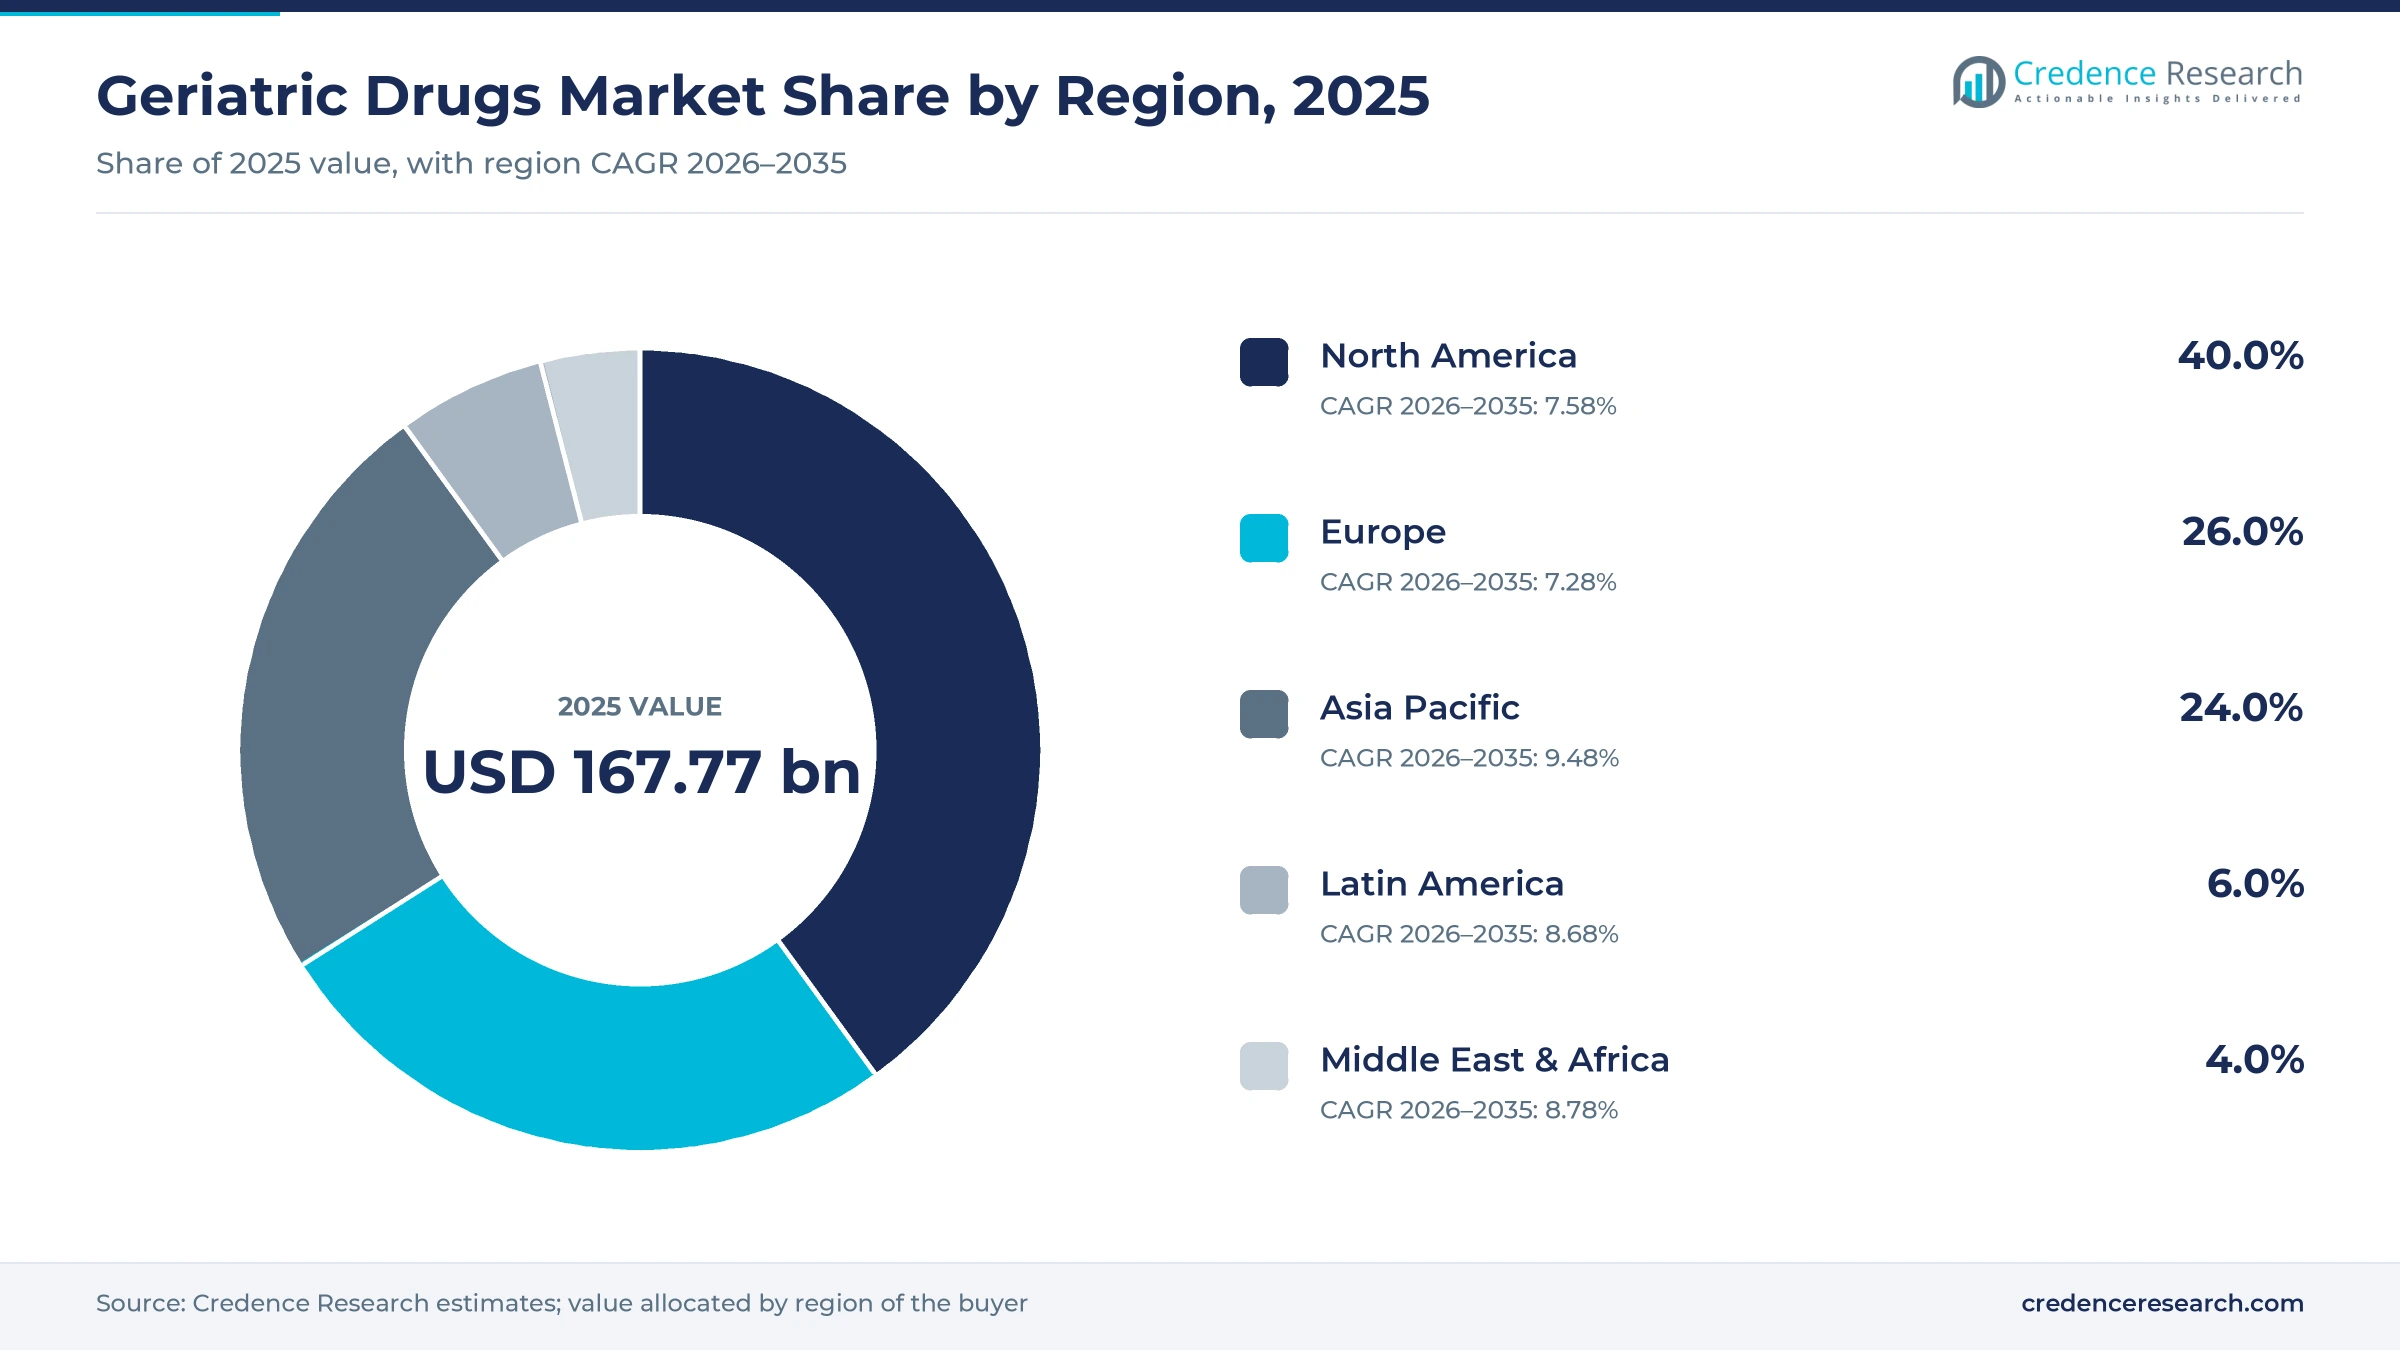
The global geriatric drugs market was valued at USD 167.77 billion in 2025 and is projected to increase from USD 181.36 billion in 2026 to USD 365.65 billion by 2035, registering a CAGR of 8.10% during 2026–2035. Demand comes from adults aged 65 and older who live with high blood pressure, heart disease, diabetes, arthritis, dementia, cancer and lung disease, and who often take several medicines each day. North America held the largest regional share, 40.0% in 2025, because Medicare and private insurers fund long-term therapy for a large older population. Asia Pacific is the fastest-growing region at 9.48% a year, as China, Japan, South Korea and India add millions of older adults each year. The main change is in U.S. pricing, where Medicare negotiated prices for 10 widely used medicines took effect in January 2026, while new antibody therapy for early Alzheimer's disease raises spending per treated patient.
Which medicines for adults over 65 does the scope include?
The market counts manufacturer revenue from prescription medicines used mainly by adults aged 65 and older, including pain relievers, blood pressure medicines, statins, diabetes therapy, acid reducers, blood thinners and antipsychotics. It covers oral, topical, injected and inhaled products sold through hospital, retail and online pharmacies and through nursing homes.
The scope excludes vaccines, dietary supplements, medical devices, home care services and over-the-counter vitamins. Medicines used by both younger and older adults are counted for the share of use attributed to the older population, so totals do not double count products across age groups.
Geriatric Drugs Market Insights
- The geriatric drugs market grows from USD 167.77 billion in 2025 to USD 365.65 billion by 2035, an 8.10% CAGR over 2026–2035, as the 60-plus population heads toward 2.1 billion.
- North America held 40.0% of global geriatric drug value in 2025, backed by Medicare drug coverage and a large insured older population.
- Antihypertensive medicines led therapeutic classes with 18.0% of 2025 value, because high blood pressure is the most common chronic condition in older adults.
- Medicare negotiated prices for 10 drugs, including Eliquis, Xarelto and Jardiance, took effect on Jan. 1, 2026, lowering net prices for older patients.
- The FDA approved Kisunla for early Alzheimer's disease in July 2024 and Leqembi Iqlik for weekly home maintenance in August 2025.
Blood pressure pills lead, diabetes therapy grows fastest
Why do blood pressure medicines lead the class mix?
Based on therapeutics, the market is categorized into analgesics, antihypertensive, statins, antidiabetic, proton pump inhibitors, anticoagulant, antipsychotic and others. Antihypertensive medicines led with 18.0% of 2025 value, because most adults over 65 take at least one tablet to control blood pressure. Antidiabetic therapy grows fastest at 9.54% a year, as GLP-1 and SGLT2 medicines reach older patients with type 2 diabetes and heart risk.
How do tablets and injections split value?
Based on route of administration, the market is categorized into oral, topical, parenteral, inhalation and others. Oral products led with 70.0% of 2025 value, because daily tablets remain the standard for heart, diabetes, acid and pain treatment. Parenteral products grow fastest at 9.60% a year, as dementia antibodies, weekly diabetes injections and cancer therapy raise spending per patient.
Which conditions carry the most value?
Based on indication, the market is categorized into cardiovascular diseases, arthritis and bone health, neurological disorders, cancer, diabetes and metabolic disorders, respiratory diseases and others. Cardiovascular Diseases led with 30.0% of 2025 value, because heart failure, atrial fibrillation and high blood pressure are widespread after 65. Neurological Disorders grow fastest at 9.34% a year, as antibody therapy for early Alzheimer's disease enters routine care.
Where do older patients fill prescriptions?
Based on distribution channel, the market is categorized into hospital pharmacy, retail pharmacy, online pharmacy and others. Retail Pharmacy led with 55.0% of 2025 value, because older adults refill chronic prescriptions at local pharmacies every month. Online Pharmacy grows fastest at 10.31% a year, as mail order, 90-day supplies and home delivery suit patients with limited mobility.
| Segment Group | Leading Sub-segment | Share, 2025 | Fastest-growing Sub-segment | CAGR, 2026–2035 |
|---|---|---|---|---|
| By Therapeutics | Antihypertensive | 18.0% | Antidiabetic | 9.54% |
| By Route of Administration | Oral | 70.0% | Parenteral | 9.60% |
| By Indication | Cardiovascular Diseases | 30.0% | Neurological Disorders | 9.34% |
| By Distribution Channel | Retail Pharmacy | 55.0% | Online Pharmacy | 10.31% |
Request a Free Sample
Fill in your details and we'll send you a free sample report.
- Sample data tables & charts
- Research methodology
Longer lives, chronic disease and new dementia antibodies
How does population aging expand the patient base?
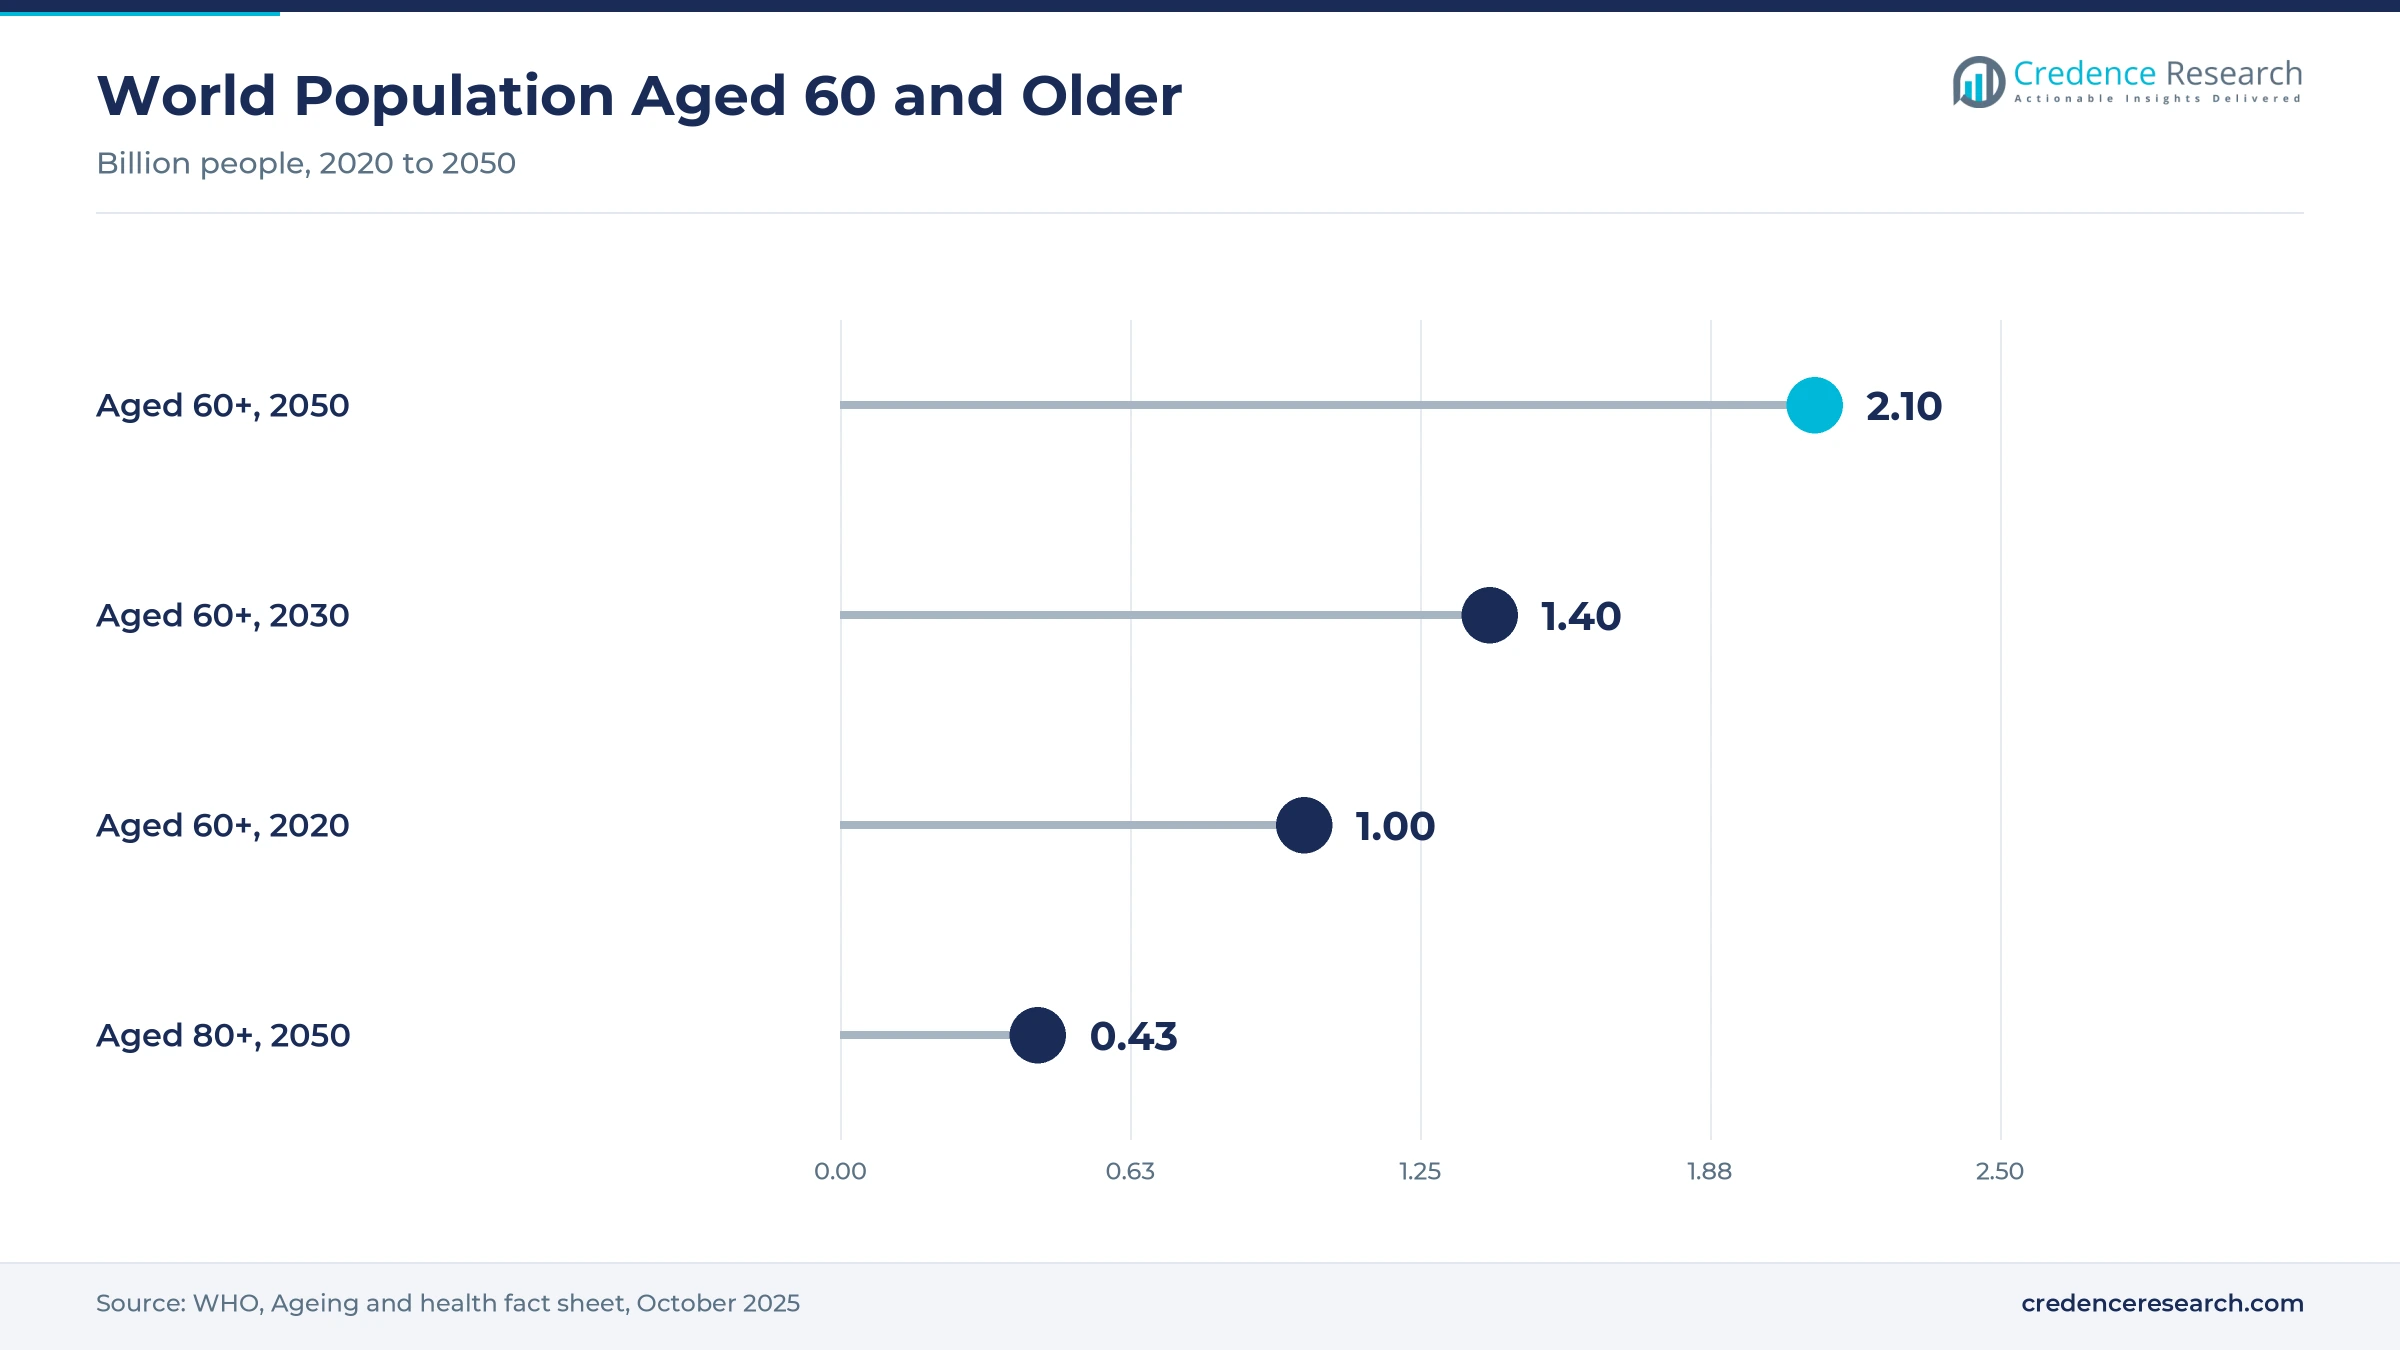
Population aging is the core driver, because the number of people who need daily chronic medicines rises every year. The WHO reports that people aged 60 and older will number 1.4 billion by 2030 and 2.1 billion by 2050, up from 1 billion in 2020. The number aged 80 and older is expected to triple to 426 million by 2050. As a result, demand for heart, diabetes, pain and memory medicines in the geriatric drugs market grows faster than the general population.
Why does multiple chronic disease raise spending per person?
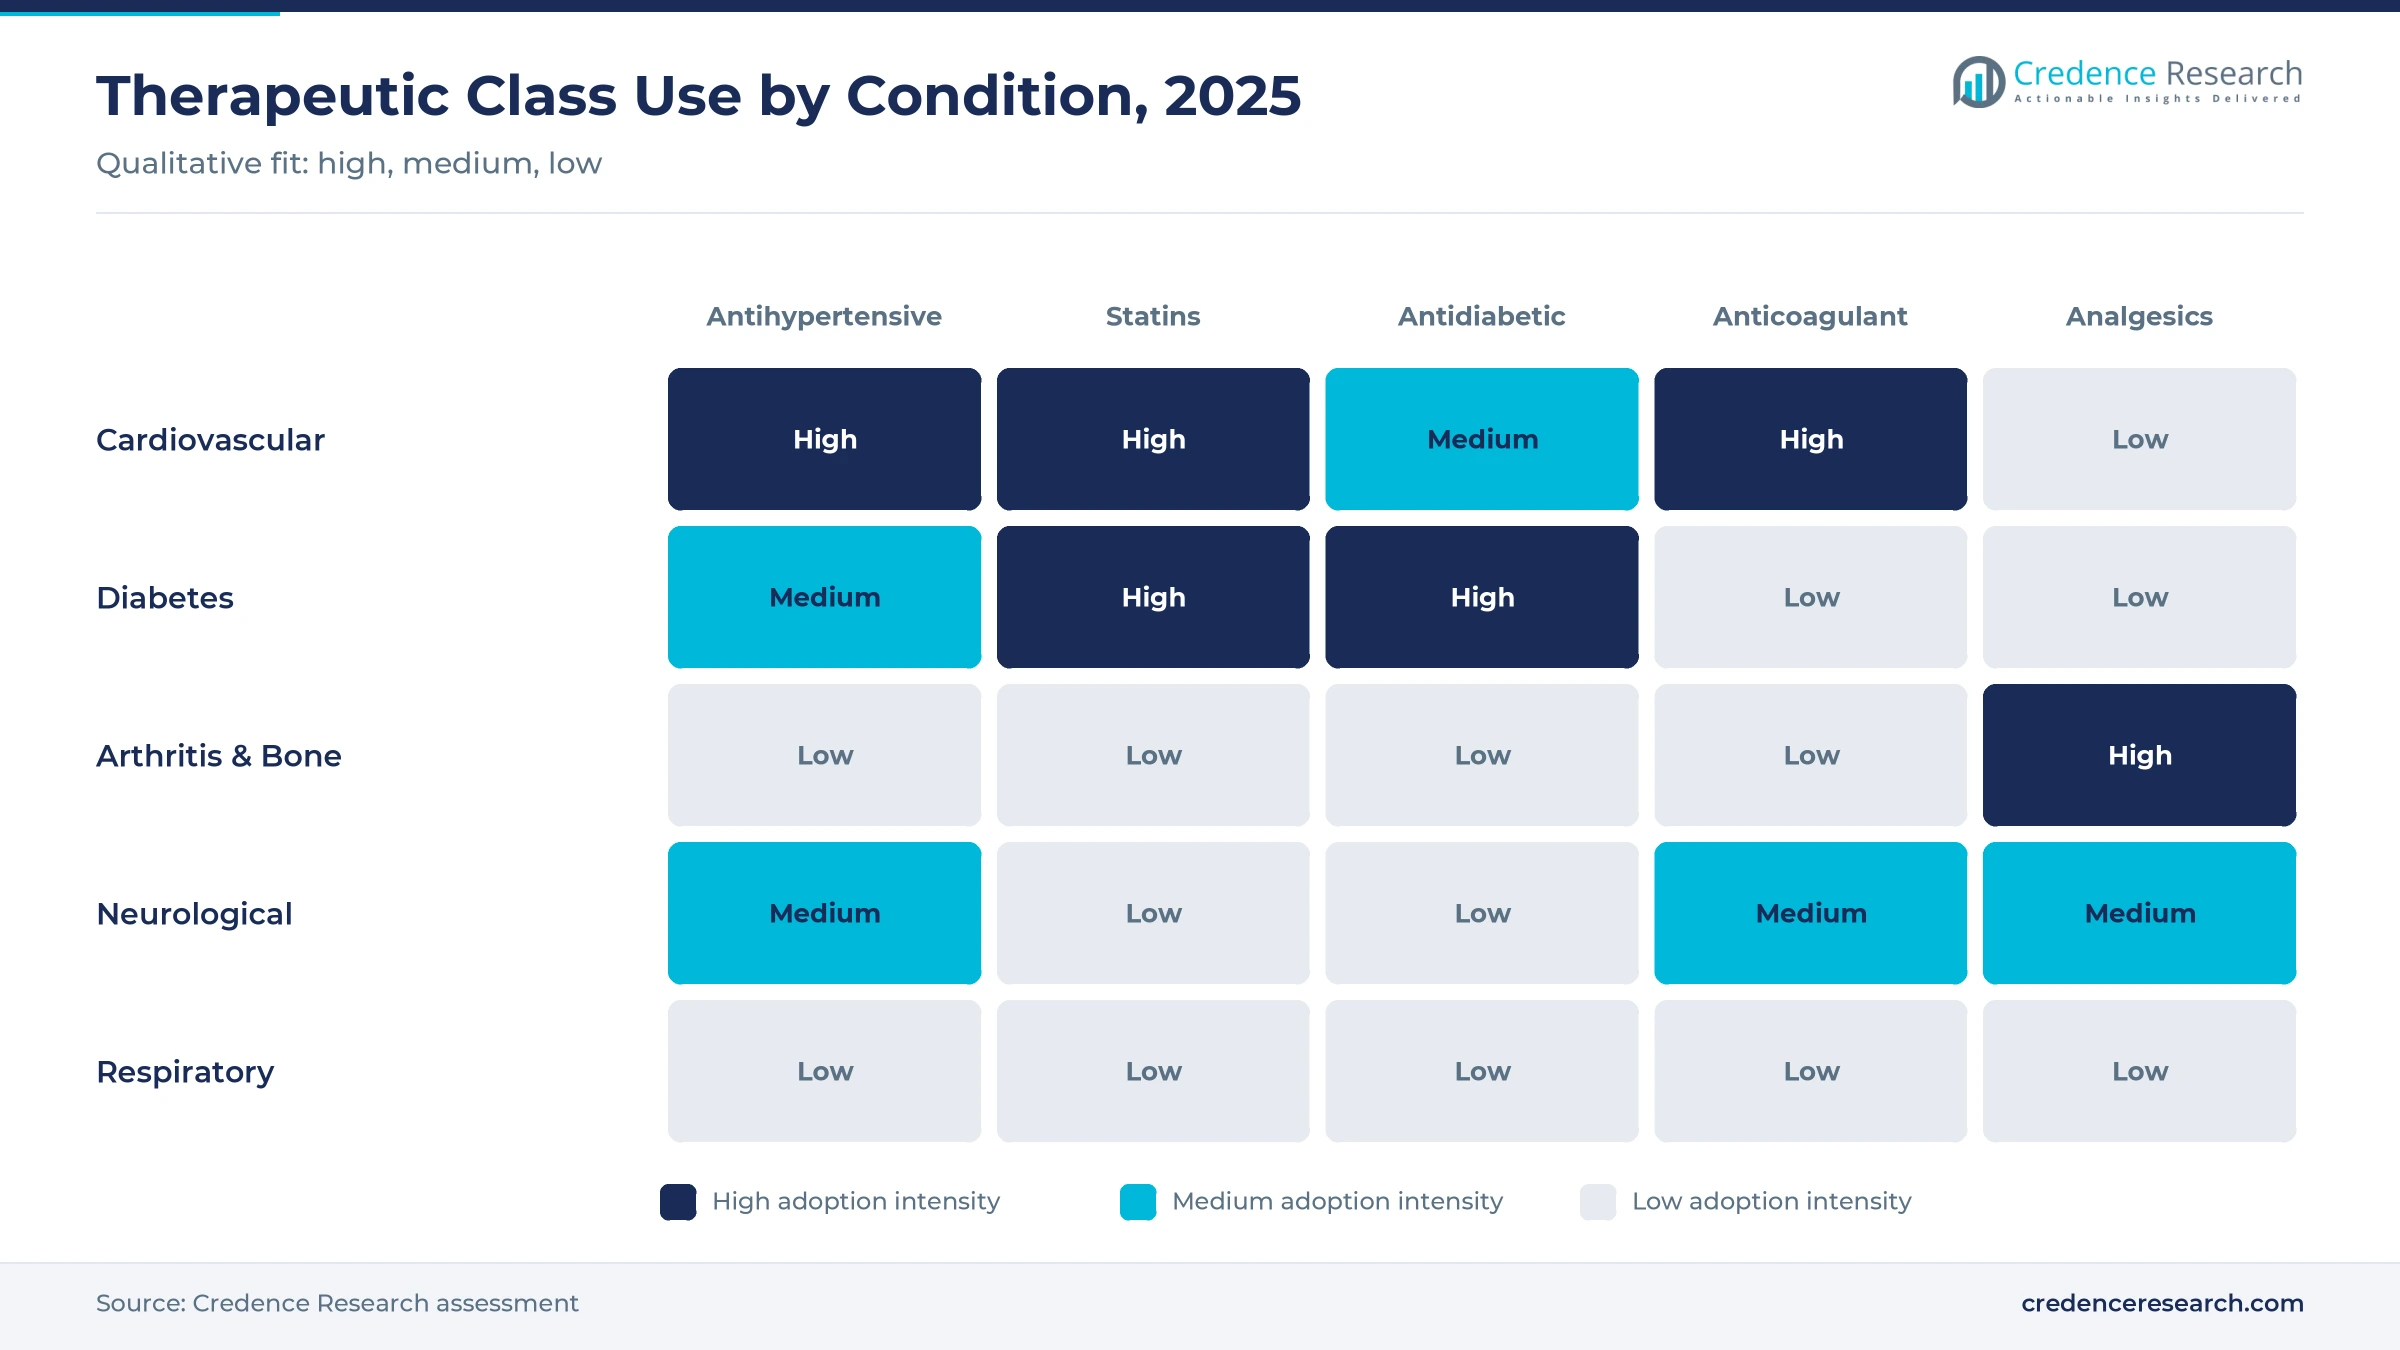
Older adults often live with several chronic conditions at once, which multiplies the number of medicines each patient takes. A typical patient over 75 may combine a blood pressure pill, a statin, an anticoagulant for atrial fibrillation and antidiabetic therapy for type 2 diabetes. Because these regimens continue for life, pharmacy spending per older adult is several times higher than for younger adults. This pattern supports steady demand for chronic medicines across all five regions and every pharmacy channel.
How are dementia antibodies adding new value?
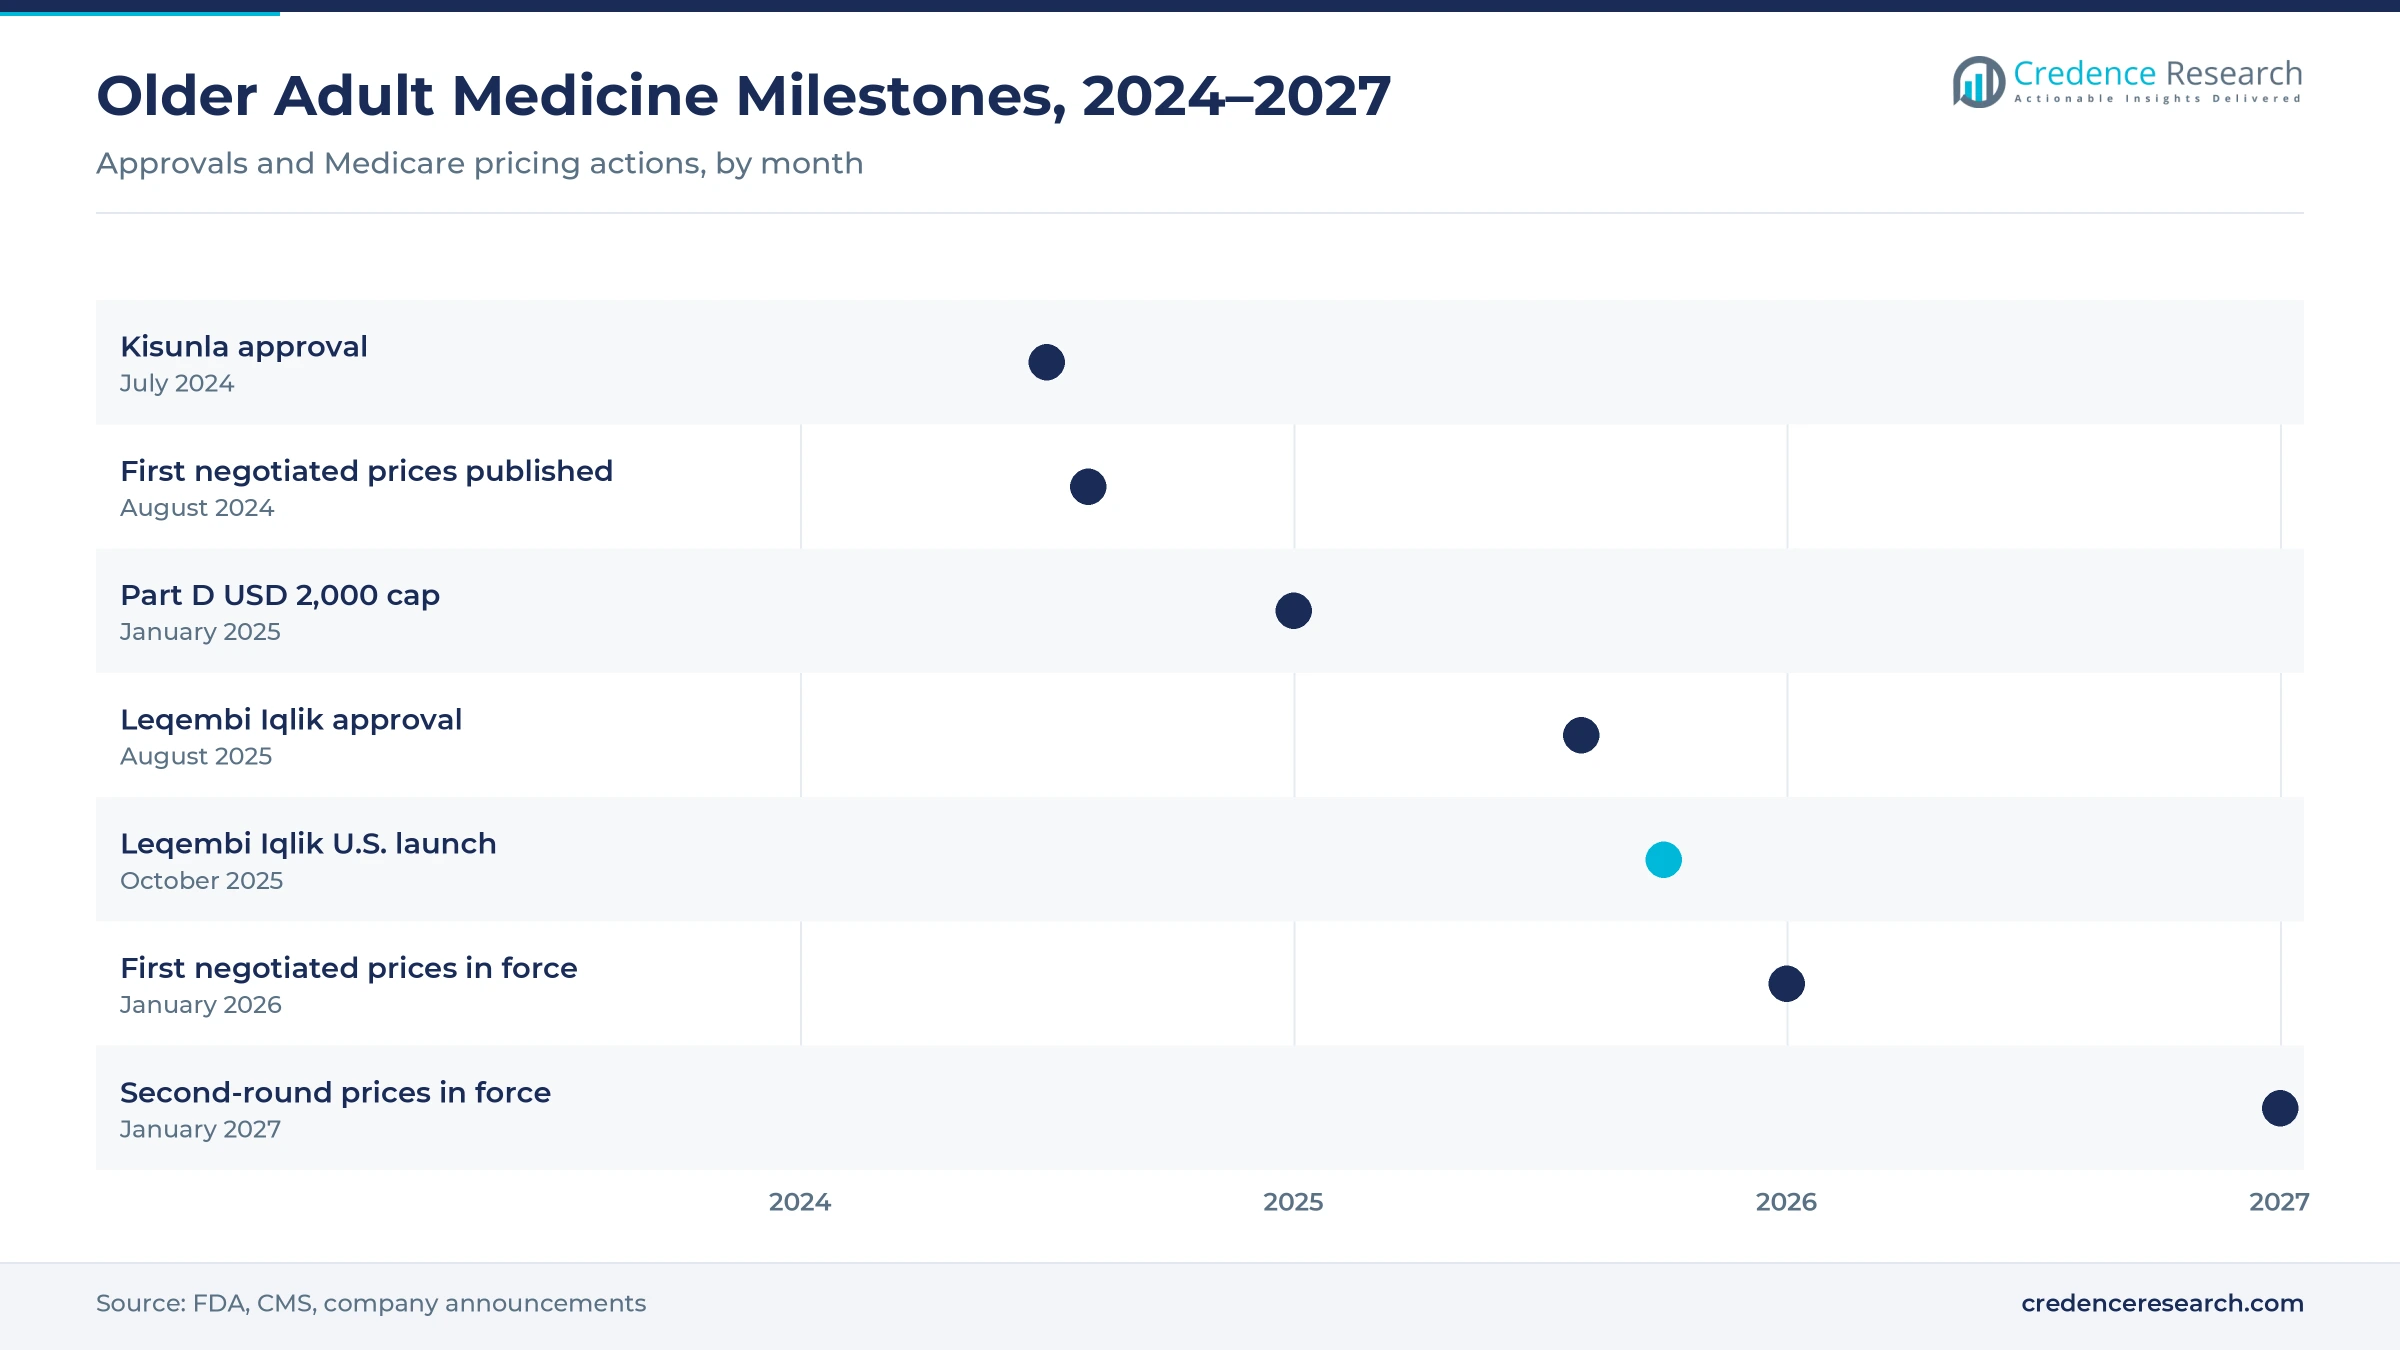
Antibody therapy for early Alzheimer's disease is adding a new, high-value class to care for older adults. On July 2, 2024, the FDA approved Kisunla (donanemab) from Eli Lilly for early symptomatic Alzheimer's disease, including mild cognitive impairment and mild dementia with confirmed amyloid. These infused treatments require scans and monitoring, which raises cost per patient. Eisai and Biogen then launched the weekly Leqembi Iqlik autoinjector in the U.S. on Oct. 6, 2025. In turn, neurological disorders become the fastest-growing indication in the market through 2035.
Why does Medicare coverage support continued use?
Better drug coverage helps older patients stay on long-term therapy, which supports volume for chronic medicines. Medicare Part D added an annual out-of-pocket cap of USD 2,000 in 2025, rising to USD 2,100 in 2026. Patients on costly cancer, diabetes and blood thinner regimens now face a clear limit on their own spending. As a result, fewer older patients skip doses or stop treatment because of cost, which supports refill rates through the forecast period.
Simpler dosing, weekly injections and home delivery rise
Why are weekly injections rising in older adults?
Weekly and monthly injections are rising because they reduce the daily pill burden for older patients and caregivers. On Aug. 29, 2025, the FDA approved Leqembi Iqlik, a weekly subcutaneous lecanemab autoinjector for maintenance treatment of early Alzheimer's disease, with a 15-second injection that can be given at home. Weekly GLP-1 injections for diabetes follow the same pattern for older patients with heart risk. This shift lifts the parenteral route faster than oral products.
How is deprescribing changing prescribing habits?
Doctors are shifting toward reviewing and reducing medicines for frail older patients, because many drug combinations raise the risk of falls, bleeding and confusion. Pharmacists now run medication reviews in nursing homes and primary care. This trend lowers use of sedatives, some antipsychotics and long-term acid reducers. However, it also steers patients toward safer newer agents, such as direct oral anticoagulants in place of warfarin, which supports value.
Where is the opening in home delivery?
Home delivery offers a clear opening, because many older adults have limited mobility and take several medicines on fixed schedules. Online pharmacies and mail-order services ship 90-day supplies in blister packs sorted by dose time. Online pharmacy demand rises as these 90-day supplies cut refill trips for patients aged 65 and older. Health systems and insurers promote these services to improve adherence among patients with heart failure and diabetes. Suppliers that offer senior-friendly packaging and adherence support can win share as online pharmacy grows faster than other channels.
Can Asia Pacific aging create the largest new market?
Asia Pacific offers the largest new opening, because China, Japan, South Korea and Thailand are aging faster than most other regions. India also adds millions of older adults each year as life expectancy rises. Sun Pharmaceutical, Cipla and Dr. Reddy's supply low-cost heart, diabetes and pain medicines across the region. As incomes and insurance coverage grow, more older adults move from no treatment to regular prescriptions for chronic disease.
Polypharmacy, Medicare price limits and frail patients
How does polypharmacy create safety risk?
Polypharmacy is a major challenge, because older adults who take five or more medicines face higher risk of drug interactions, falls, bleeding and hospital admission. Kidney and liver function decline with age, which changes how medicines are cleared from the body. Doctors must adjust doses carefully, including pain relievers used in osteoarthritis treatment, and avoid medicines listed as potentially inappropriate for older adults. These limits narrow the range of products that can be prescribed safely to frail patients.
What do Medicare price limits mean for revenue?
Medicare price negotiation reduces net prices for several of the most widely used medicines in older adults. CMS announced the first 10 negotiated prices in August 2024, with an aggregate 22% cut in net spending. CMS lists 10 drugs with negotiated prices from Jan. 1, 2026, including Eliquis, Xarelto, Jardiance, Januvia, Farxiga and Entresto. A further 15 drugs, including Ozempic, Trelegy Ellipta, Breo Ellipta and Austedo, follow in 2027. As a result, originator revenue per prescription falls in the largest single market for these medicines.
Why are older adults hard to study in trials?
Older adults, especially those over 80 with several conditions, are often underrepresented in clinical trials, which leaves gaps in dosing and safety evidence. Regulators and prescribers therefore rely on limited data when treating frail patients. Because results from younger trial groups may not apply, doctors prescribe new medicines cautiously in this age group. In turn, uptake of new products is slower among the oldest patients than in younger adults.
How do dementia therapy costs limit access?
New Alzheimer's disease antibodies require brain scans to confirm amyloid, regular infusions or injections and MRI monitoring for brain swelling and bleeding. Many health systems lack enough specialists, scanners and infusion chairs to treat every eligible patient. Public payers in Europe and Asia have been slower to reimburse these medicines than U.S. Medicare. These hurdles limit the number of patients treated, even as interest from patients and families stays high.
North America leads while Asia Pacific ages fastest
| Region | Value, 2025 (USD billion) | Share, 2025 | CAGR, 2026–2035 |
|---|---|---|---|
| North America | 67.11 | 40.0% | 7.58% |
| Europe | 43.62 | 26.0% | 7.28% |
| Asia Pacific | 40.26 | 24.0% | 9.48% |
| Latin America | 10.07 | 6.0% | 8.68% |
| Middle East & Africa | 6.71 | 4.0% | 8.78% |
North America leads on Medicare coverage
North America held 40.0% of 2025 value and grows at 7.58% a year through 2035. The U.S. leads spending, because Medicare Part D covers long-term medicines for most adults aged 65 and older. New antibody therapy for early Alzheimer's disease and weekly GLP-1 injections reached U.S. patients first. However, Medicare price negotiation from 2026 and wide generic use keep value growth below the global average.
Europe balances older populations and tight budgets
Europe held 26.0% of 2025 value and grows at 7.28% a year, the slowest pace among the five regions. Germany, Italy, France, Spain and the U.K. have some of the oldest populations in the world, with Sanofi, Novartis, GSK and Boehringer Ingelheim based in the region. Health technology assessment and reference pricing hold down prices for new medicines. As a result, generics carry most of the volume in heart, acid and pain treatment.
Asia Pacific ages fastest
Asia Pacific held 24.0% of 2025 value and is the fastest-growing region at 9.48% a year. Japan has one of the oldest populations worldwide, while China adds the largest number of older adults each year. India expands chronic disease treatment through low-cost medicines from Sun Pharmaceutical, Cipla and Dr. Reddy's. As insurance coverage grows, more older adults receive regular prescriptions for blood pressure, diabetes and arthritis.
Latin America grows with public programs
Latin America held 6.0% of 2025 value and grows at 8.68% a year through 2035. Brazil and Mexico account for most demand, with public programs supplying blood pressure and diabetes medicines to older adults at low cost. Currency swings and budget limits slow access to newer branded therapy.
Gulf states lead older adult care in the Middle East and Africa
The Middle East & Africa held 4.0% of 2025 value and grows at 8.78% a year. Gulf states lead regional spending, with growing private insurance and specialist care. In much of Africa, younger populations and limited coverage keep older adult medicine use low.
Dementia approvals and Medicare price moves since 2024
| Development | Status and market relevance |
|---|---|
| In July 2024, the FDA approved Eli Lilly's Kisunla (donanemab) for early symptomatic Alzheimer's disease with confirmed amyloid. | Approved. Adds a second antibody option for early Alzheimer's disease. |
| In August 2024, CMS announced negotiated Medicare prices for 10 drugs, including Eliquis, Xarelto, Jardiance and Entresto, effective January 2026. | In force from January 2026. Lowers net prices for common heart and diabetes medicines. |
| In January 2025, Medicare Part D introduced an annual out-of-pocket cap of USD 2,000, which rose to USD 2,100 in 2026. | In force. Reduces cost-related nonadherence among older patients. |
| In August 2025, the FDA approved Leqembi Iqlik, a weekly subcutaneous autoinjector for maintenance treatment of early Alzheimer's disease. | Approved. U.S. launch followed in October 2025, enabling home dosing. |
Antibodies, autoinjectors and once-daily combinations
- Amyloid antibodies such as donanemab and lecanemab remove brain plaques in early Alzheimer's disease and require scan-based monitoring.
- Subcutaneous autoinjectors let patients or caregivers give weekly maintenance doses at home in about 15 seconds.
- Fixed-dose combination tablets merge blood pressure, cholesterol or diabetes medicines into a single daily pill to reduce pill burden.
- Weekly GLP-1 injections treat type 2 diabetes with one dose a week and lower the number of daily tablets.
- Senior-friendly packaging such as dose-sorted blister packs and easy-open caps help patients with poor eyesight or arthritis take medicines correctly.
Need a Custom Version of This Report?
Tailor the scope, geography, or segments to your exact requirements.
- Custom geography or segment scope
- Direct access to our analyst team
Originators and generic makers share the older patient
Competition in medicines for older adults splits into large originators and generic suppliers. Pfizer, Johnson & Johnson, Boehringer Ingelheim, Novartis, Sanofi and GSK hold branded positions in heart disease, blood thinners, diabetes, respiratory disease and cancer. Several of their leading products, including Pfizer's Eliquis with Bristol Myers Squibb, Johnson & Johnson's Xarelto, Boehringer Ingelheim's Jardiance and Novartis's Entresto, carry Medicare negotiated prices from 2026, which reduces net prices in the U.S. Demand for these 10 negotiated medicines stays high, with about 8.8 million Part D enrollees using them in 2023. Teva supplies a broad generic portfolio of chronic medicines used by older adults in the U.S. and Europe. Sun Pharmaceutical, Cipla and Dr. Reddy's supply low-cost heart, diabetes and pain medicines in India, the U.S. and emerging markets. Because price pressure grows on older blockbusters, originators invest in dementia, obesity and heart failure therapy.
Companies profiled and their roles in this market
| Company | Type | Role in the market |
|---|---|---|
| Teva Pharmaceutical | Generics and specialty | Broad generic portfolio of chronic medicines |
| Pfizer Inc. | Originator | Eliquis blood thinner with Bristol Myers Squibb |
| Johnson & Johnson | Originator | Xarelto blood thinner and neuroscience portfolio |
| GSK plc | Originator | Respiratory inhalers and vaccines portfolio |
| Sanofi SA | Originator | Diabetes, cardiovascular and immunology portfolio |
| Novartis AG | Originator | Entresto for heart failure and cardiovascular portfolio |
| Boehringer Ingelheim GmbH | Originator | Jardiance for diabetes and heart failure |
| Sun Pharmaceutical Industries Ltd. | Generics and specialty | Chronic therapy generics in India and the U.S. |
| Cipla Limited | Generics | Respiratory and chronic therapy generics |
| Dr. Reddy's Laboratories Ltd. | Generics | Cardiovascular, diabetes and pain generics |
Value follows dementia and diabetes as volume stays in pills
Credence Research's view is that tablets for blood pressure, cholesterol, acid and pain will keep most of the volume in medicines for older adults, while dementia antibodies, GLP-1 therapy and newer blood thinners will carry most of the value growth through 2035. Medicare negotiation lowers net prices for several older blockbusters, but the 2025 out-of-pocket cap supports adherence and volume. Asia Pacific offers the fastest growth as China and India age. Companies that combine safe dosing, simple formats and broad access are best placed in this market.
How the 2025 baseline and forecast were built
The report uses 2025 as the base year and forecasts market value to 2035, with growth rates stated for 2026–2035. Market values come from the Credence Research market model, which combines the older population by region, treated prevalence of chronic conditions, typical therapy use and average selling prices by channel. Splits by therapeutics, route of administration, indication, distribution channel and region are Credence Research estimates. Sources used include WHO population data, CMS program releases, FDA approval news and company press releases. No primary interviews or surveys were used to build the estimates.
Neurology and metabolic therapy gain share by 2035
By 2035, the market reaches USD 365.65 billion, as the population aged 60 and older moves toward 2.1 billion by mid-century. Cardiovascular diseases remain the largest indication, although generic competition and Medicare negotiation hold down value growth. Neurological disorders gain share as antibody therapy for early Alzheimer's disease reaches more patients through home injections. Online pharmacies take a larger part of repeat prescriptions for chronic heart and diabetes care. Asia Pacific grows fastest, while North America remains the largest region by value.
Frequently Asked Questions
How big is the geriatric drugs market?
Which therapeutic class leads the market?
Which indication grows fastest?
Which region holds the largest share?
How fast is the older population growing?
How does Medicare price negotiation affect the market?
Who are the leading companies?
What are the main challenges?
Table of Content
Chapter 1 Market Segmentation
- 1.1 Segmentation Framework
- 1.1.1 Product and Service Classification
- 1.1.2 Application and End-Use Classification
- 1.1.3 Technology and Solution Classification
- 1.1.4 Customer and Distribution Channel Classification
- 1.1.5 Geographic Segmentation
- 1.1.6 Market Segment Definitions and Boundaries
- 1.2 By Therapeutics
- 1.2.1 Analgesics
- 1.2.2 Antihypertensive
- 1.2.3 Statins
- 1.2.4 Antidiabetic
- 1.2.5 Proton Pump Inhibitors
- 1.2.6 Anticoagulant
- 1.2.7 Antipsychotic
- 1.2.8 Others
- 1.3 By Route of Administration
- 1.3.1 Oral
- 1.3.2 Parenteral
- 1.3.3 Topical
- 1.3.4 Inhalation
- 1.3.5 Others
- 1.4 By Indication
- 1.4.1 Cardiovascular Diseases
- 1.4.2 Arthritis & Bone Health
- 1.4.3 Neurological Disorders
- 1.4.4 Cancer
- 1.4.5 Diabetes and Metabolic Disorders
- 1.4.6 Respiratory Diseases
- 1.4.7 Others
Chapter 2 Introduction
- 2.1 Report Objectives and Scope
- 2.2 Product Definition and Industry Terminology
- 2.3 Market Inclusions and Exclusions
- 2.4 Research Process
- 2.4.1 Primary Research and Expert Interviews
- 2.4.2 Secondary Research and Source Review
- 2.4.3 Top-Down and Bottom-Up Estimation
- 2.4.4 Data Triangulation and Verification
- 2.5 Market Size Measurement Basis
- 2.5.1 2025: USD 167.77 billion → 2035: USD 365.65 billion
- 2.6 Historical and Forecast Reference Periods
- 2.6.1 Historical Period: 2018-2025
- 2.6.2 Base Year: 2025
- 2.6.3 Forecast Period: 2025-2035
- 2.7 Research Assumptions and Limitations
Chapter 3 Executive Summary
- 3.1 Market Snapshot and Key Findings
- 3.2 Base-Year Market Size, 2025
- 3.3 Forecast Market Size, 2035
- 3.4 Revenue and Volume Growth Outlook
- 3.5 Key Demand and Supply Indicators
- 3.6 Leading Market Segments
- 3.7 Fastest-Growing Market Opportunities
- 3.8 Regional Performance Highlights
- 3.9 Technology and Industry Transformation
- 3.10 Competitive Landscape Summary
- 3.11 Analyst View and Strategic Implications
Chapter 4 Global Geriatric Drugs Market Trends and Developments
- 4.1 Historical Industry Development, 2018-2025
- 4.2 Recent Market Trends and Developments
- 4.3 Demand and Customer Behavior Trends
- 4.4 Technology and Product Innovation
- 4.5 Artificial Intelligence, Automation and Digitalization
- 4.6 Local Manufacturing and Supply Chain Realignment
- 4.7 Industry Partnerships, Mergers and Acquisitions
- 4.8 Sustainability and Circular Economy Developments
- 4.9 Government and Private Sector Investment Trends
- 4.10 Emerging Business Models and Commercialization
- 4.11 Industry Developments and Announcements
Chapter 5 Global Geriatric Drugs Market Production, Supply and Demand Analysis
- 5.1 Demand Trend and Consumption Analysis, 2018-2025
- 5.2 Demand Forecast, 2025-2035
- 5.3 Production and Output Trend, 2018-2025
- 5.4 Production and Output Forecast, 2025-2035
- 5.5 Installed Capacity and Capacity Utilization
- 5.6 Company-Wise Production Plants and Statistics
- 5.6.1 Installed Production Capacity
- 5.6.2 Actual Production
- 5.6.3 Planned Capacity and Expansion Targets
- 5.7 Supply Chain Structure and Procurement Trends
- 5.8 Supply-Demand Gap and Bottlenecks
- 5.9 Import Dependence and Sourcing Structure
- 5.10 Contract Manufacturing and Outsourcing
- 5.11 Regional Supply and Demand Concentration
Chapter 6 Global Geriatric Drugs Market Pricing Analysis
- 6.1 Pricing Structure and Measurement
- 6.2 Historical Pricing Trends, 2018-2025
- 6.3 Pricing Outlook, 2025-2035
- 6.4 Average Selling Price and Unit Economics
- 6.5 Pricing by Product and Market Segment
- 6.6 Geographic Pricing Differences
- 6.7 Key Input, Energy, Labor and Logistics Costs
- 6.8 Contract Pricing and Purchasing Models
- 6.9 Pricing Sensitivity and Competitive Positioning
- 6.10 Price, Margin and Profitability Implications
Chapter 7 Global Geriatric Drugs Market Dynamics
- 7.1 Market Growth Drivers
- 7.1.1 Demand-Side Drivers
- 7.1.2 Technology and Innovation Drivers
- 7.1.3 Infrastructure and Investment Drivers
- 7.1.4 Regulatory and Policy Drivers
- 7.2 Market Restraints
- 7.2.1 Cost and Affordability Constraints
- 7.2.2 Technology and Adoption Barriers
- 7.2.3 Supply Chain and Operational Constraints
- 7.3 Market Challenges
- 7.3.1 Competitive Pressure and Margin Erosion
- 7.3.2 Skills, Infrastructure and Implementation Gaps
- 7.4 Emerging Market Opportunities
- 7.5 Market Dynamics Impact and Time-Horizon Assessment
Chapter 8 Global Geriatric Drugs Value Chain Analysis
- 8.1 Industry Value Chain Overview
- 8.2 Upstream Suppliers and Critical Inputs
- 8.3 Technology and Component Providers
- 8.4 Manufacturing or Service Delivery
- 8.5 Distribution, Channel Partners and Integrators
- 8.6 Downstream Applications and End Users
- 8.7 Value Addition and Profit Pools
- 8.8 Vertical Integration and Outsourcing
- 8.9 Supplier Concentration and Risk
- 8.10 Supply Chain Localization and Resilience
Chapter 9 Global Geriatric Drugs Market Regulations and Policies
- 9.1 Relevant Laws, Standards and Compliance Frameworks
- 9.2 Product, Service, Safety and Quality Requirements
- 9.3 Government Policies, Incentives and Subsidies
- 9.4 Imports, Exports and Trade Barriers
- 9.5 Public Procurement and Local Content Requirements
- 9.6 Environmental and Sustainability Compliance
- 9.7 Upcoming Policy Changes and Market Implications
Chapter 10 Global Geriatric Drugs Market Hotspots and Opportunities
- 10.1 Market Opportunity Mapping and Growth Hotspots
- 10.2 High-Growth Applications and Customer Groups
- 10.3 Underserved Markets and White-Space Opportunities
- 10.4 Emerging Technology and Product Opportunities
- 10.5 New Capacity and Investment Hotspots
- 10.6 Market Entry and Expansion Opportunities
- 10.7 Distribution and Partnership Opportunities
- 10.8 Near-Term and Long-Term Commercial Potential
- 10.9 Opportunity Attractiveness and Execution Risks
Chapter 11 Global Geriatric Drugs Market Outlook, 2025-2035
- 11.1 Market Size and Analysis
- 11.1.1 Revenue (Market Measurement: 2025: USD 167.77 billion → 2035: USD 365.65 billion)
- 11.1.2 Market Volume and Quantity Sold
- 11.1.3 Historical Market Size, 2018-2025
- 11.1.4 Base-Year Market Size, 2025
- 11.2 Market Forecast, 2025-2035
- 11.2.1 Revenue Forecast to 2035
- 11.2.2 Volume Forecast to 2035
- 11.2.3 CAGR and Year-on-Year Growth
- 11.2.4 Incremental Revenue Opportunity
- 11.3 Forecast Assumptions and Scenario Analysis
- 11.3.1 Base-Case Forecast
- 11.3.2 Optimistic and Conservative Scenarios
- 11.3.3 Technology, Pricing and Policy Sensitivities
- 11.4 Market Attractiveness and Growth Outlook
Chapter 12 Global Geriatric Drugs Market Segmentation and Outlook
- 12.1 Segmentation Summary and Market Shares, 2025
- 12.2 Largest and Fastest-Growing Segments
- 12.3 By Therapeutics - Market Size and Forecast, 2025-2035
- 12.3.1 Segment Definition and Scope
- 12.3.2 Historical Market Size, 2018-2025
- 12.3.3 Revenue Forecast, 2025-2035
- 12.3.4 Volume Forecast, 2025-2035
- 12.3.5 Base-Year Market Share, 2025
- 12.3.6 Segment CAGR and Growth Drivers
- 12.3.7 Subsegment Market Size and Forecast
- 12.3.7.1 Analgesics
- 12.3.7.2 Antihypertensive
- 12.3.7.3 Statins
- 12.3.7.4 Antidiabetic
- 12.3.7.5 Proton Pump Inhibitors
- 12.3.7.6 Anticoagulant
- 12.3.7.7 Antipsychotic
- 12.3.7.8 Others
- 12.3.8 Subsegment Pricing and Adoption Trends
- 12.3.9 Leading Suppliers and Competition
- 12.3.10 Regional Demand and Opportunities
- 12.4 By Route of Administration - Market Size and Forecast, 2025-2035
- 12.4.1 Segment Definition and Scope
- 12.4.2 Historical Market Size, 2018-2025
- 12.4.3 Revenue Forecast, 2025-2035
- 12.4.4 Volume Forecast, 2025-2035
- 12.4.5 Base-Year Market Share, 2025
- 12.4.6 Segment CAGR and Growth Drivers
- 12.4.7 Subsegment Market Size and Forecast
- 12.4.7.1 Oral
- 12.4.7.2 Parenteral
- 12.4.7.3 Topical
- 12.4.7.4 Inhalation
- 12.4.7.5 Others
- 12.4.8 Subsegment Pricing and Adoption Trends
- 12.4.9 Leading Suppliers and Competition
- 12.4.10 Regional Demand and Opportunities
- 12.5 By Indication - Market Size and Forecast, 2025-2035
- 12.5.1 Segment Definition and Scope
- 12.5.2 Historical Market Size, 2018-2025
- 12.5.3 Revenue Forecast, 2025-2035
- 12.5.4 Volume Forecast, 2025-2035
- 12.5.5 Base-Year Market Share, 2025
- 12.5.6 Segment CAGR and Growth Drivers
- 12.5.7 Subsegment Market Size and Forecast
- 12.5.7.1 Cardiovascular Diseases
- 12.5.7.2 Arthritis & Bone Health
- 12.5.7.3 Neurological Disorders
- 12.5.7.4 Cancer
- 12.5.7.5 Diabetes and Metabolic Disorders
- 12.5.7.6 Respiratory Diseases
- 12.5.7.7 Others
- 12.5.8 Subsegment Pricing and Adoption Trends
- 12.5.9 Leading Suppliers and Competition
- 12.5.10 Regional Demand and Opportunities
- 12.6 Segment Growth Comparison
- 12.7 Segment Attractiveness and Priority Matrix
Chapter 13 Global Geriatric Drugs Geographic Market Outlook, 2025-2035
- 13.1 Regional Market Size and Share, 2025
- 13.2 Regional Market Forecast, 2025-2035
- 13.3 Regional Pricing, Production and Demand Differences
- 13.4 North America
- 13.4.1 United States
- 13.4.2 Canada
- 13.4.3 Mexico
- 13.5 Europe
- 13.5.1 Germany
- 13.5.2 France
- 13.5.3 Italy
- 13.5.4 United Kingdom
- 13.5.5 Spain
- 13.5.6 Poland
- 13.5.7 Russia
- 13.5.8 Netherlands
- 13.5.9 Belgium
- 13.5.10 Sweden
- 13.5.11 Denmark
- 13.5.12 Norway
- 13.5.13 Rest of Europe
- 13.6 Asia Pacific
- 13.6.1 China
- 13.6.2 India
- 13.6.3 Japan
- 13.6.4 South Korea
- 13.6.5 Thailand
- 13.6.6 Indonesia
- 13.6.7 Vietnam
- 13.6.8 Malaysia
- 13.6.9 Australia
- 13.6.10 Rest of Asia Pacific
- 13.7 Latin America
- 13.7.1 Brazil
- 13.7.2 Argentina
- 13.7.3 Colombia
- 13.7.4 Chile
- 13.7.5 Rest of Latin America
- 13.8 Middle East
- 13.8.1 Saudi Arabia
- 13.8.2 United Arab Emirates
- 13.8.3 Turkey
- 13.8.4 Israel
- 13.8.5 Iran
- 13.8.6 Rest of the Middle East
- 13.9 Africa
- 13.9.1 South Africa
- 13.9.2 Egypt
- 13.9.3 Nigeria
- 13.9.4 Morocco
- 13.9.5 Rest of Africa
- 13.10 Regional Investment, Policy and Supply Chain Differences
- 13.11 Regional Competitive Landscape
- 13.12 Geographic Growth Hotspots
Chapter 14 Global Geriatric Drugs Technology, Innovation and Sustainability Outlook
- 14.1 Technology Landscape and Maturity
- 14.2 Product, Process and Service Innovation
- 14.3 AI, Automation and Digital Tools in the Industry
- 14.4 Technology Adoption and Performance Benchmarking
- 14.5 Innovation Pipeline and R&D Investment
- 14.6 Patent and Intellectual Property Trends
- 14.7 Energy Efficiency and Resource Management
- 14.8 Sustainability, Recycling and Circularity
- 14.9 Technology Roadmap, 2025-2035
- 14.10 Risks of Obsolescence and Technology Substitution
Chapter 15 Global Geriatric Drugs Market Key Strategic Imperatives
- 15.1 Growth and Market Entry Priorities
- 15.2 High-Return Products and Segments
- 15.3 Pricing, Profitability and Cost Optimization
- 15.4 Technology Investment and Product Differentiation
- 15.5 Supply Chain Localization and Resilience
- 15.6 Distribution and Customer Acquisition
- 15.7 Partnership, Acquisition and Capacity Strategy
- 15.8 Regional Expansion Priorities
- 15.9 Short-, Medium- and Long-Term Actions
Chapter 16 Competition Outlook
- 16.1 Industry Competition Characteristics
- 16.2 Market Structure and Concentration
- 16.3 Market Share and Competitive Positioning, 2025
- 16.4 Company-Wise Revenue and Product Benchmarking
- 16.5 Production and Service Capacity Benchmarking
- 16.6 Technology, Pricing and Differentiation
- 16.7 Regional Footprint and Distribution Strength
- 16.8 Mergers, Acquisitions and Strategic Alliances
- 16.9 New Entrants and Competitive Threats
- 16.10 Porter's Five Forces and Industry Attractiveness
- 16.11 Competitive Outlook, 2025-2035
Chapter 17 Company Profiles
- 17.1 Company Coverage and Selection Criteria
- 17.2 Teva Pharmaceutical
- 17.2.1 Business Description
- 17.2.2 Company Ownership and Geographic Presence
- 17.2.3 Product and Service Portfolio
- 17.2.4 Manufacturing and Operating Footprint
- 17.2.5 Production Capacity and Expansion Plans
- 17.2.6 Financial Performance and Investment
- 17.2.7 Market Share and Competitive Position
- 17.2.8 Technology and Innovation Capabilities
- 17.2.9 Strategic Alliances or Partnerships
- 17.2.10 Recent Developments
- 17.2.11 Growth Strategy and Outlook
- 17.3 Pfizer Inc.
- 17.4 Johnson & Johnson
- 17.5 GSK plc
- 17.6 Sanofi SA
- 17.7 Novartis AG
- 17.8 Boehringer Ingelheim GmbH
- 17.9 Sun Pharmaceutical Industries Ltd.
- 17.10 Cipla Limited
- 17.11 Dr. Reddy's Laboratories Ltd.
- 17.12 Other Relevant Market Participants
Note: Every listed company is profiled on the structure shown under the first company. The company list is preliminary and may change based on research findings, market developments, data availability and client requirements.
Chapter 18 Disclaimer
- 18.1 Research and Forecast Disclaimer
- 18.2 Data Source and Estimation Limitations
Note: The depth of individual sections depends on data availability for this market. Volume, capacity, trade and other unit-based metrics are included where applicable.