
Market Overview
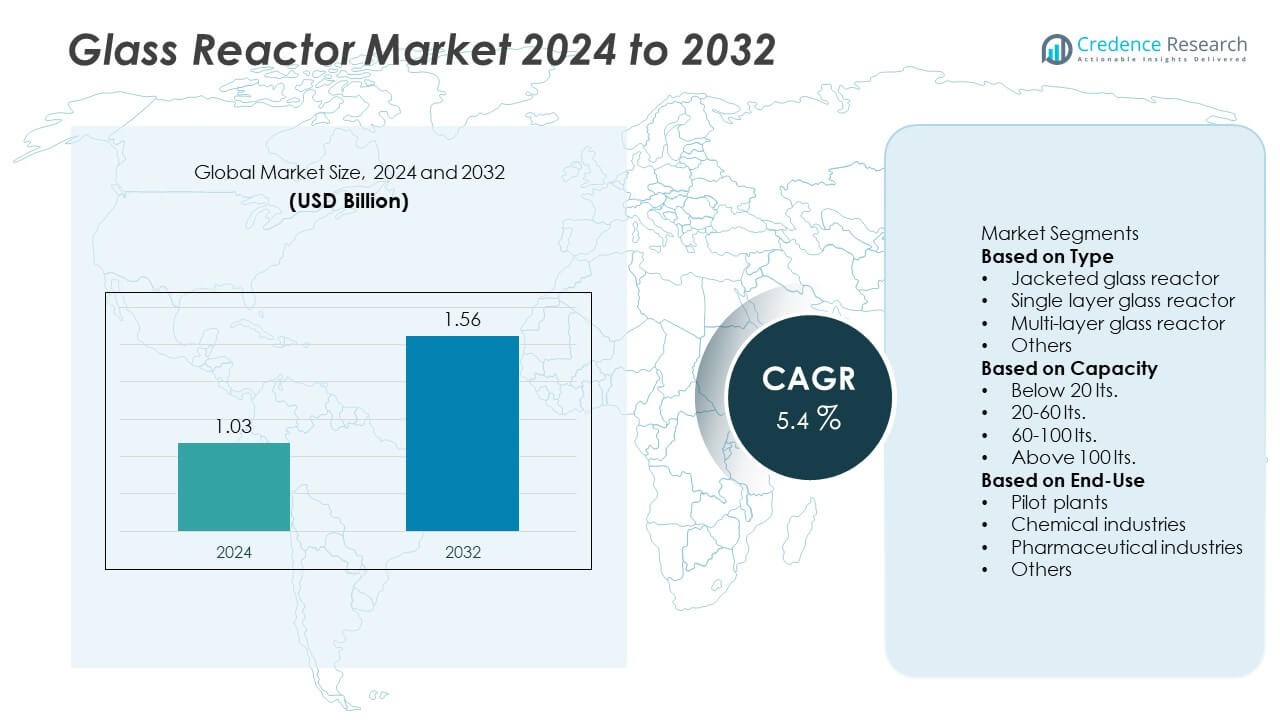
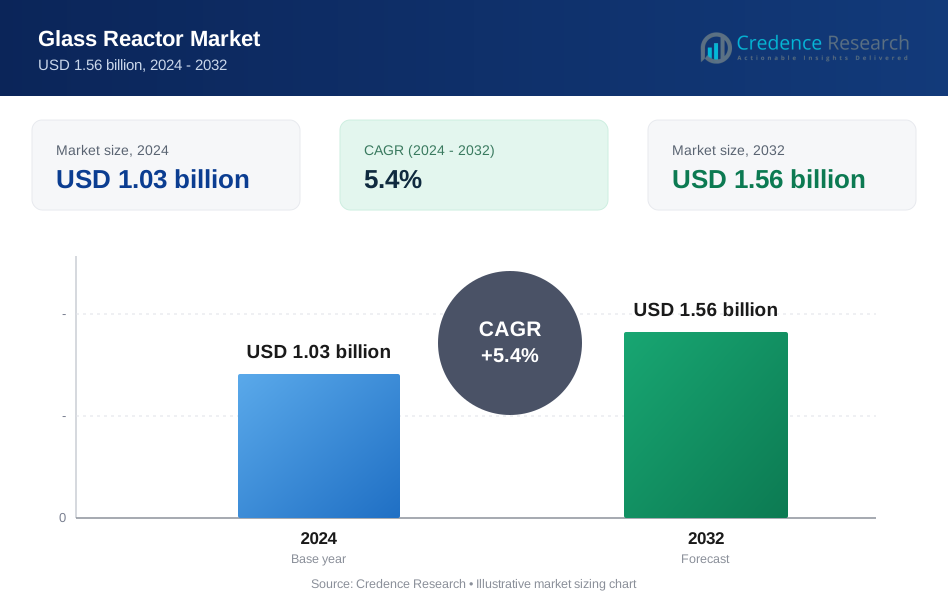
The global glass reactor market was valued at USD 1.03 billion in 2024 and is projected to reach USD 1.56 billion by 2032, growing at a CAGR of 5.4% during the forecast period.
| REPORT ATTRIBUTE | DETAILS |
|---|---|
| Historical Period | 2020-2023 |
| Base Year | 2024 |
| Forecast Period | 2025-2032 |
| Glass Reactor Market Size 2024 | USD 1.03 Billion |
| Glass Reactor Market, CAGR | 5.4% |
| Glass Reactor Market Size 2032 | USD 1.56 Billion |
The glass reactor market is led by prominent players such as SCHOTT AG, Sigma Scientific Glass Company, JULABO USA Inc., Pfaudler Group, EYELA, ACE Glass Incorporated, LabTech, Inc., Heidolph Instruments GmbH & Co. KG, Glas-Col, LLC, and De Dietrich Process Systems. These companies dominate through advanced reactor design, product customization, and automation integration. They focus on enhancing temperature control, chemical resistance, and process safety across laboratory and industrial applications. North America leads the market with a 34% share, driven by strong pharmaceutical and chemical R&D activities, followed by Asia-Pacific with 30% and Europe with 28%, supported by rising laboratory modernization and regulatory compliance initiatives.
Market Insights
- The global glass reactor market was valued at USD 1.03 billion in 2024 and is projected to reach USD 1.56 billion by 2032, growing at a CAGR of 5.4% during the forecast period.
- Rising demand from pharmaceutical, chemical, and biotechnology sectors drives market growth, with the jacketed glass reactor segment holding 52% share due to its superior temperature control and versatility.
- Key market trends include automation integration, modular reactor systems, and increasing adoption of energy-efficient and corrosion-resistant materials.
- Leading players such as SCHOTT AG, Pfaudler Group, and De Dietrich Process Systems compete through precision design, product innovation, and strategic global expansion.
- North America leads with 34% share, followed by Asia-Pacific at 30% and Europe at 28%, while Latin America (5%) and Middle East & Africa (3%) show emerging potential supported by growing R&D infrastructure and chemical processing investments.
Market Segmentation Analysis:
By Type
The jacketed glass reactor segment dominated the glass reactor market in 2024, holding 52% share. Its leadership is driven by widespread use in chemical synthesis, distillation, and temperature-sensitive reactions. The double-layer design allows efficient thermal control through circulating fluids, ensuring process stability and product quality. Jacketed reactors are highly preferred in pharmaceutical and chemical research due to their corrosion resistance and visibility advantages. Manufacturers are focusing on enhanced automation and digital temperature regulation systems to improve reaction precision and energy efficiency, further strengthening the adoption of jacketed glass reactors globally.
- For instance, Büchiglas Uster introduced its chemReactor CR series, which includes high-performance glass and glass-lined steel reactors used widely in pharmaceutical synthesis, scale-up, and pilot plant applications.
By Capacity
The 20–60 liters segment held the largest share of 39% in the glass reactor market in 2024. This range is widely used for laboratory-scale testing, pilot production, and small-batch manufacturing across the chemical and pharmaceutical industries. It provides an optimal balance between flexibility, cost-efficiency, and capacity. The rising demand for process optimization and R&D activities in drug development and specialty chemical synthesis supports this segment’s growth. Additionally, modular and portable designs with advanced pressure and vacuum control systems enhance operational efficiency, driving steady adoption across industrial laboratories and research institutes.
- For instance, Chemglass Life Sciences offers customizable 50-liter CG-1968 series reactors featuring borosilicate 3.3 glass construction, automated stirring speeds with digital torque feedback, and a single zero dead space PTFE drain valve.
By End-Use
The pharmaceutical industry segment accounted for the largest share of 44% in the glass reactor market in 2024. The dominance is attributed to increasing demand for controlled chemical reactions in drug formulation, synthesis, and purification processes. Glass reactors provide superior visibility, chemical inertness, and thermal stability, which are essential in producing high-purity pharmaceutical compounds. The growing focus on biopharmaceuticals and personalized medicine further boosts usage in research and pilot production. Pharmaceutical companies are investing in automation-integrated glass reactors to enhance scalability, safety, and compliance with Good Manufacturing Practices (GMP) standards, driving strong market demand.
Key Growth Drivers
Rising Demand from Pharmaceutical and Chemical Industries
The increasing use of glass reactors in pharmaceutical and chemical research is a key growth driver. These reactors provide superior visibility, corrosion resistance, and temperature control, making them essential for synthesis and formulation processes. Pharmaceutical companies rely on them for safe drug development, while chemical producers use them for pilot testing and reaction optimization. The global rise in R&D expenditure and the demand for high-purity production systems further boost their adoption. Expanding chemical manufacturing and biotechnology research facilities continue to support strong market growth worldwide.
- For instance, Sartorius AG provides a broad portfolio of bioprocess solutions and equipment, such as the automated Ambr® microbioreactor systems and the scalable Biostat® family of bioreactors. These technologies, which include single-use and traditional glass systems, enable biopharma manufacturing and research.
Advancements in Process Automation and Reactor Design
Technological innovations in reactor design and process automation are transforming the glass reactor market. Modern systems now integrate digital controls, pressure sensors, and automated stirring mechanisms for precise reaction monitoring. These advancements enhance productivity, energy efficiency, and safety during operations. Automated jacketed reactors are increasingly used for continuous flow and scale-up processes in laboratories. Manufacturers are also focusing on modular and multi-layer configurations that allow flexible use across different reactions. This shift toward intelligent and automated reactors is significantly improving process reliability and operational outcomes.
- For instance, Radleys launched its AVA Control Software integrated with Reactor-Ready systems, enabling automated temperature, torque, and pH control with real-time data logging at one-second intervals. The system manages over 250 automated parameters simultaneously, reducing manual intervention by 60% and enhancing reproducibility across multi-step chemical syntheses.
Expansion of Laboratory and Pilot Plant Applications
Rising adoption of glass reactors in laboratory and pilot-scale setups is another major growth factor. Research organizations and educational institutions are increasing investments in advanced equipment to support chemical synthesis, distillation, and material testing. Glass reactors’ adaptability for both batch and continuous processes enhances their utility in small-scale trials. The growing trend of outsourcing R&D activities to contract research organizations (CROs) further boosts market demand. The expansion of pilot plant facilities in pharmaceuticals, fine chemicals, and biotechnology sectors continues to drive steady growth across global markets.
Key Trends and Opportunities
Growing Demand for Customizable and Energy-Efficient Designs
The market is witnessing strong demand for customizable glass reactors that cater to specific process needs. Manufacturers are introducing energy-efficient designs with improved temperature control and vacuum performance. The integration of smart sensors and IoT-enabled systems is enabling real-time monitoring and predictive maintenance. Demand for sustainable materials and long-lasting reactor components also reflects the shift toward eco-friendly laboratory practices. These technological and design advancements present significant growth opportunities for manufacturers and end users alike.
- For instance, De Dietrich Process Systems developed its QVF SUPRA-Line reactors with instrumentation to optimize heat transfer and mixing, leading to increased energy efficiency. The company also provides preventative maintenance programs to extend the equipment's lifespan and reduce the risk of severe damage.
Increased Adoption in Biochemical and Green Chemistry Applications
The rise of green chemistry and sustainable production processes is creating new opportunities for glass reactor adoption. Their chemical inertness and clean operation make them ideal for eco-friendly synthesis and enzymatic reactions. Biopharmaceutical and nutraceutical industries are increasingly using glass reactors for safe biological testing and formulation development. As industries move toward cleaner production with reduced waste and solvent use, glass reactors are becoming critical in enabling efficient, compliant, and environmentally responsible operations.
- For instance, Applikon Biotechnology (a Getinge company) supplies autoclavable glass bioreactors for research, with systems available in a range of working volumes from small scale up to 20 liters. These systems enable precise control of parameters like pH and mixing speed for applications including enzyme-driven synthesis.
Key Challenges
High Initial Cost and Maintenance Requirements
One of the main challenges in the glass reactor market is the high initial investment cost. Glass reactors require precision engineering and specialized components, making them expensive compared to metal or polymer alternatives. Maintenance and replacement of fragile glass components add to operational expenses, particularly in large-scale facilities. Small and medium enterprises often find it difficult to adopt high-end systems due to budget limitations. Manufacturers are focusing on cost optimization and offering modular systems to make these reactors more accessible across different industrial sectors.
Fragility and Operational Limitations
Despite their chemical resistance and visibility benefits, glass reactors remain prone to breakage and thermal stress. Sudden temperature changes, overpressure, or improper handling can lead to cracks and failures. These limitations restrict their use in high-pressure or heavy-duty industrial operations. Operators require specialized training to ensure safe handling and longevity of glass systems. Efforts to develop reinforced borosilicate or hybrid glass-metal reactors are underway to enhance durability, but mechanical fragility continues to challenge large-scale adoption in high-intensity industrial environments.
Regional Analysis
North America North America held the largest share of 34% in the glass reactor market in 2024. The region’s dominance stems from its strong pharmaceutical, biotechnology, and chemical manufacturing base. The U.S. leads with significant R&D investments in drug development and material synthesis. Advanced laboratory infrastructure and stringent quality standards drive the adoption of jacketed and multi-layer reactors. Growing demand for high-purity production systems in healthcare and academic research institutions also supports market expansion. Continuous innovation in automated reactor designs and sustainability initiatives further reinforce North America’s leadership in the global glass reactor market.
Europe
Europe accounted for 28% of the global glass reactor market in 2024. The region benefits from well-established pharmaceutical production, chemical engineering, and academic research sectors. Countries such as Germany, Switzerland, and the U.K. lead in laboratory equipment innovation and GMP-certified facilities. Strong regulatory frameworks promoting clean and safe chemical processing encourage widespread adoption of advanced glass reactors. European manufacturers emphasize eco-friendly materials and energy-efficient designs to comply with environmental standards. Investments in green chemistry and bioprocessing technologies continue to drive steady demand across industrial and research applications in Europe.
Asia-Pacific
Asia-Pacific held 30% share of the glass reactor market in 2024 and emerged as the fastest-growing region. Rapid industrialization, expanding pharmaceutical manufacturing, and rising chemical exports from China, Japan, and India fuel strong growth. The region benefits from cost-effective production, increasing R&D investments, and a growing presence of global reactor suppliers. Demand for high-quality laboratory and pilot-scale reactors is rising in universities and research centers. Government support for biotechnology, healthcare, and renewable chemistry also enhances market prospects. Asia-Pacific is becoming a critical manufacturing and innovation hub for advanced glass reactor systems worldwide.
Latin America
Latin America captured 5% share of the global glass reactor market in 2024. The region’s growth is driven by increasing investments in chemical, pharmaceutical, and food processing industries. Brazil and Mexico are leading markets due to their expanding laboratory infrastructure and industrial modernization programs. Demand for corrosion-resistant and thermally stable reactors is growing in research and pilot plant setups. However, limited local manufacturing and high import dependence constrain faster expansion. International partnerships and capacity-building initiatives are helping improve product accessibility, supporting gradual market development across the region.
Middle East & Africa
The Middle East & Africa accounted for 3% share of the global glass reactor market in 2024. Market growth is supported by rising applications in petrochemical, pharmaceutical, and water treatment sectors. The UAE and Saudi Arabia are investing heavily in laboratory infrastructure and process research as part of industrial diversification plans. The expansion of higher education and chemical R&D centers strengthens regional adoption. Africa’s demand is rising in healthcare and agricultural chemical development. Strategic collaborations with global suppliers and growing awareness of high-quality laboratory equipment are gradually boosting market penetration across the region.
Market Segmentations:
By Type
- Jacketed glass reactor
- Single layer glass reactor
- Multi-layer glass reactor
- Others
By Capacity
- Below 20 lts.
- 20-60 lts.
- 60-100 lts.
- Above 100 lts.
By End-Use
- Pilot plants
- Chemical industries
- Pharmaceutical industries
- Others
By Geography
- North America
- U.S.
- Canada
- Mexico
- Europe
- Germany
- France
- U.K.
- Italy
- Spain
- Rest of Europe
- Asia Pacific
- China
- Japan
- India
- South Korea
- South-east Asia
- Rest of Asia Pacific
- Latin America
- Brazil
- Argentina
- Rest of Latin America
- Middle East & Africa
- GCC Countries
- South Africa
- Rest of the Middle East and Africa
Competitive Landscape
The competitive landscape of the glass reactor market is characterized by the presence of major players such as SCHOTT AG, Sigma Scientific Glass Company, JULABO USA Inc., Pfaudler Group, EYELA, ACE Glass Incorporated, LabTech, Inc., Heidolph Instruments GmbH & Co. KG, Glas-Col, LLC, and De Dietrich Process Systems. These companies compete through product innovation, precision engineering, and customization to meet diverse industrial and laboratory requirements. Leading manufacturers focus on integrating automation, digital controls, and advanced temperature regulation systems to enhance operational efficiency. Strategic partnerships, acquisitions, and expansion of distribution networks help strengthen their global market presence. Additionally, manufacturers are investing in durable borosilicate glass technology and modular reactor systems to improve reliability and scalability. Growing emphasis on sustainable materials, corrosion resistance, and process safety continues to define competition in this market, positioning technology-driven and quality-focused players at the forefront of industry growth.
Key Player Analysis
- SCHOTT AG
- Sigma Scientific Glass Company
- JULABO USA Inc.
- Pfaudler Group
- EYELA
- ACE Glass Incorporated
- LabTech, Inc.
- Heidolph Instruments GmbH & Co. KG
- Glas-Col, LLC
- De Dietrich Process Systems
Recent Developments
- In September 2025, SCHOTT showcased its high-performance specialty glass portfolio for advanced semiconductor packaging at SEMICON Taiwan 2025.
- In July 2025, ACE Glass Incorporated hosted a live webinar titled Ace Your Science: Guide to Flange Styles, providing clear, lab-focused insights on flange styles in glass reactors.
- In June 2025, Sigma Scientific Glass Company initiated a new era with the activation of an electric furnace, enhancing production capabilities.
- In January 2024, EYELA introduced the Column Flow Reactor LCR-1300, ideal for continuous flow synthesis using immobilized catalysts.
Report Coverage
The research report offers an in-depth analysis based on Type, Capacity, End-Use and Geography. It details leading market players, providing an overview of their business, product offerings, investments, revenue streams, and key applications. Additionally, the report includes insights into the competitive environment, SWOT analysis, current market trends, as well as the primary drivers and constraints. Furthermore, it discusses various factors that have driven market expansion in recent years. The report also explores market dynamics, regulatory scenarios, and technological advancements that are shaping the industry. It assesses the impact of external factors and global economic changes on market growth. Lastly, it provides strategic recommendations for new entrants and established companies to navigate the complexities of the market.
Future Outlook
- The glass reactor market will continue to expand driven by pharmaceutical and chemical R&D growth.
- Rising investments in biotechnology and specialty chemical production will boost reactor demand.
- Automation and digital monitoring systems will enhance process control and efficiency.
- Modular and scalable reactor designs will gain popularity across pilot and industrial applications.
- Energy-efficient and eco-friendly materials will dominate future product innovations.
- Asia-Pacific will record the fastest growth due to expanding manufacturing and research facilities.
- North America will maintain leadership supported by advanced pharmaceutical production.
- European manufacturers will focus on sustainable and precision-engineered reactor solutions.
- Collaborations between equipment manufacturers and research institutions will drive innovation.
- Continuous R&D in corrosion-resistant and durable glass materials will shape future market competitiveness.
Request a Free Sample
Fill in your details and we'll send you a free sample report.
- Sample data tables & charts
- Research methodology
Need a Custom Version of This Report?
Tailor the scope, geography, or segments to your exact requirements.
- Custom geography or segment scope
- Direct access to our analyst team
Frequently Asked Questions
What is the current market size for the Glass Reactor market, and what is its projected size in 2032?
At what Compound Annual Growth Rate is the Glass Reactor market projected to grow between 2025 and 2032?
Which Glass Reactor market segment held the largest share in 2024?
What are the primary factors fueling the growth of the Glass Reactor market?
Who are the leading companies in the Glass Reactor market?
Which region commanded the largest share of the Glass Reactor market in 2024?
Table of Content
Chapter 1. Report Introduction
- 1.1 Report Description & Purpose
- 1.1.1 Report Title & Market Definition
- 1.1.2 Unique Selling Propositions (USP) & Key Differentiators
- 1.1.3 Value Proposition for Stakeholders
- 1.2 Research Objectives
- 1.2.1 Market Sizing Objectives (Volume & Revenue) (Volume Where Applicable)
- 1.2.2 Segmentation Objectives
- 1.2.3 Competitive Intelligence Objectives
- 1.2.4 Forecast & Scenario Objectives
- 1.3 Report Scope
- 1.3.1 Glass Reactor Scope – Segments & Subsegments Covered
- 1.3.2 Geographic Scope – Regions & Countries Covered
- 1.3.3 Historical Period, Base Year & Forecast Period (2024; forecast to 2032)
- 1.3.4 Inclusions & Exclusions
- 1.4 Industry Classification & Applicable Codes
- 1.5 Currency, Measurement Units & Valuation Basis
- 1.6 Target Stakeholders
- 1.7 Limitations & Assumptions
Chapter 2. Executive Summary
- 2.1 Global Glass Reactor Market Snapshot
- 2.1.1 Market Size – Historical (2024) & Forecast (2024-2032) (2024: USD 1.03 billion → 2032: USD 1.56 billion)
- 2.1.2 Volume & Revenue – Global Totals (Volume Where Applicable)
- 2.1.3 Key Market Highlights – Top Five Facts
- 2.2 Glass Reactor Market Segmentation Snapshot
- 2.2.1 Market Split by Region – 2024 vs. 2032
- 2.3 Competitive Snapshot
- 2.3.1 Top 10 Players by Revenue Share – 2024
- 2.3.2 Top 10 Players by Volume Share – 2024 (Volume Where Applicable)
- 2.3.3 Recent Strategic Developments (18-Month Summary)
- 2.4 Key Investment Highlights & Strategic Conclusions
Chapter 3. Glass Reactor Market Dynamics & Industry Analysis
- 3.1 Market Overview & Context
- 3.1.1 Glass Reactor Market Position in the Broader Industry Value Chain
- 3.1.2 Demand Structure & Purchasing Dynamics
- 3.1.3 Market Maturity & Development Stage by Region
- 3.2 Glass Reactor Market Drivers
- 3.3 Glass Reactor Market Restraints & Challenges
- 3.4 Glass Reactor Market Opportunities
- 3.5 Porter's Five Forces Analysis
- 3.5.1 Threat of New Entrants
- 3.5.2 Bargaining Power of Suppliers
- 3.5.3 Bargaining Power of Buyers
- 3.5.4 Threat of Substitutes
- 3.5.5 Competitive Rivalry – Intensity Assessment
- 3.6 Glass Reactor Value Chain Analysis
- 3.6.1 Upstream – Key Inputs, Resources & Suppliers
- 3.6.1.1 Key Input/Resource 1
- 3.6.1.2 Key Input/Resource 2
- 3.6.1.3 Key Input/Resource 3
- 3.6.2 Midstream – Core Operations & Value Creation
- 3.6.2.1 Operating Model & Process Overview
- 3.6.2.2 Key Operating Locations & Capabilities by Company
- 3.6.3 Downstream – Market Channels & End Users
- 3.6.3.1 Direct Sales & Customer Engagement Channels
- 3.6.3.2 Indirect Sales, Intermediaries & Partner Channels
- 3.6.4 Value Chain Profitability Analysis
- 3.6.1 Upstream – Key Inputs, Resources & Suppliers
- 3.7 PESTEL Analysis
- 3.7.1 Political Factors
- 3.7.2 Economic Factors
- 3.7.3 Social Factors
- 3.7.4 Technological Factors
- 3.7.5 Environmental Factors
- 3.7.6 Legal Factors
- 3.8 Glass Reactor Supply Chain Analysis
- 3.8.1 Critical Input & Resource Availability Risk Assessment
- 3.8.2 Supplier & Operational Concentration Risk (Geographic Exposure)
- 3.8.3 Supply & Service Disruption Impact Analysis
- 3.9 Regulatory & Policy Landscape
Note: The regulatory and policy landscape section covers regulations based on their applicability to the market, Glass Reactor category, geography, and scope of the study. Only regulatory frameworks with a material impact on operations, compliance, trade, sustainability, or market access are analyzed in detail.
Chapter 4. Key Investment Pockets & Opportunity Analysis
- 4.1 Glass Reactor Market Attractiveness Analysis
- 4.1.1 By Region – Investment Attractiveness Matrix (Market Size × CAGR)
- 4.2 Absolute Revenue Growth Opportunity
- 4.2.1 By Region – Absolute Revenue Growth Through 2032
- 4.3 Incremental Demand Opportunity
- 4.3.1 By Region – Incremental Demand Through 2032
- 4.3.2 Segment – Incremental Demand
- 4.4 Emerging Submarket Opportunity Deep Dive (Subject to Applicability)
- 4.5 Priority Market Opportunity Scorecards
- 4.5.1 United States
- 4.5.2 Europe
- 4.5.3 Asia
- 4.5.4 Middle East & Africa
Note: Priority market opportunity scorecards reflect the geographic scope and strategic relevance of the study. Listed markets are indicative and may be adapted to the industry.
Chapter 5. Glass Reactor Cross-Border Trade & Market Access Analysis
- 5.1 International Trade & Cross-Border Activity Overview
- 5.1.1 Global Export Value by Country (2024)
- 5.1.2 Global Export Volume by Country (2024) (Volume Where Applicable)
- 5.1.3 Global Import Value by Country (2024)
- 5.1.4 Global Import Volume by Country (2024) (Volume Where Applicable)
- 5.1.5 Net Trade Balance by Country (2024)
- 5.2 Export Analysis – Segment
- 5.2.1 Category 1 (Applicable Classification Code)
- 5.2.2 Category 2 (Applicable Classification Code)
- 5.2.3 Category 3 (Applicable Classification Code)
- 5.2.4 Category 4 (Applicable Classification Code)
- 5.2.5 Category 5 (Applicable Classification Code)
- 5.3 Import Analysis – Segment
- 5.3.1 Category 1 (Applicable Classification Code)
- 5.3.2 Category 2 (Applicable Classification Code)
- 5.3.3 Category 3 (Applicable Classification Code)
- 5.3.4 Category 4 (Applicable Classification Code)
- 5.3.5 Category 5 (Applicable Classification Code)
- 5.4 Cross-Border Pricing & Transaction Benchmarks
- 5.4.1 Export Pricing – Segment & Country
- 5.4.2 Import Pricing – Segment & Source Country
- 5.4.3 Price Trends (2024)
- 5.5 Key Cross-Border Trade & Delivery Routes
- 5.5.1 Cross-Border Trade/Delivery Route 1
- 5.5.2 Cross-Border Trade/Delivery Route 2
- 5.5.3 Cross-Border Trade/Delivery Route 3
- 5.5.4 Cross-Border Trade/Delivery Route 4
- 5.5.5 Cross-Border Trade/Delivery Route 5
- 5.6 Trade Policy & Market Access Impact Assessment
- 5.6.1 Tariff & Non-Tariff Barriers
- 5.6.2 Regional Trade & Economic Integration Frameworks
- 5.6.3 Bilateral & Multilateral Trade Agreements
- 5.6.4 Cross-Border Operating, Licensing & Localization Requirements
Note: This chapter applies where cross-border trade or delivery is relevant to Glass Reactor. Goods, services, and digital offerings are assessed using applicable classifications and transaction measures. Import-export volumes, trade balances, and route analyses are included only where meaningful to the market.
Chapter 6. Competitive Landscape & Company Benchmarking
- 6.1 Glass Reactor Market Concentration & Structure
- 6.1.1 Herfindahl-Hirschman Index (HHI) – vs. 2024
- 6.1.2 Leading, Mid-Sized & Emerging Player Structure
- 6.1.3 Global, Regional & Local Player Dynamics
- 6.2 Glass Reactor Market Share Analysis – 2024
- 6.2.1 Global Revenue Share by Company
- 6.2.2 Global Volume Share by Company (Volume Where Applicable)
- 6.2.3 Regional Revenue Share
- 6.2.4 Market Share Evolution ( vs. 2024)
- 6.2.5 Company Market Share by Key Segment
- 6.2.6 Company Market Share by Customer Group
- 6.3 Operating Scale, Capacity & Infrastructure Analysis
- 6.3.1 Global Operating Scale & Supply Capacity
- 6.3.2 Resource Utilization & Operating Efficiency
- 6.3.3 Output, Service Delivery & Activity Metrics
- 6.3.4 Operating Footprint & Infrastructure Map
- 6.3.5 Planned Operational & Capacity Expansion
- 6.4 Glass Reactor Competitive Benchmarking Matrix
- 6.4.1 Revenue, Growth, Profitability & Operating Metric Comparison
- 6.4.2 Channel Revenue Mix
- 6.4.3 Geographic Revenue Exposure
- 6.4.4 R&D Intensity
- 6.4.5 Sustainability Maturity
- 6.5 Strategic Developments in Glass Reactor (Last 24 Months)
- 6.5.1 Mergers, Acquisitions & Divestments
- 6.5.2 New Products, Services & Solutions in Glass Reactor
- 6.5.3 Operational & Infrastructure Expansions
- 6.5.4 Strategic Alliances, Joint Ventures & Partnerships
- 6.5.5 Distribution Expansion & Market Entry
- 6.5.6 Sustainability & ESG Initiatives
- 6.6 Competitive Strategy Mapping
- 6.6.1 Leader, Challenger, Follower & Niche Classification
- 6.6.2 Pricing Strategy Comparison
- 6.6.3 Channel Strategy Matrix
Note: Strategic developments are included based on their materiality and the availability of reliable information.
Chapter 7. Global Glass Reactor Market – By Sales & Delivery Channel
- 7.1 Segment Overview
- 7.1.1 Volume & Revenue Split by Channel (2024 & 2032) (Volume Where Applicable)
- 7.1.2 Channel Mix Evolution (2024-2032)
Chapter 8. Regional Market Analysis – Global Overview
- 8.1 Global Regional Overview
- 8.1.1 Regional Volume Share (Volume Where Applicable)
- 8.1.2 Regional Revenue Share
- 8.1.3 Regional Volume by Region (Volume Where Applicable)
- 8.1.4 Regional Revenue by Region
- 8.1.5 Regional Forecast Through 2032
- 8.2 Cross-Regional Segment Analysis
- 8.2.1 By Sales & Delivery Channel
- 8.2.2 By Competitive Positioning & Price Tier
Chapter 9. North America Glass Reactor Market
- 9.1 United States
- 9.2 Canada
- 9.3 Mexico
Chapter 10. Europe Glass Reactor Market
- 10.1 Germany
- 10.2 France
- 10.3 Italy
- 10.4 United Kingdom
- 10.5 Spain
- 10.6 Poland
- 10.7 Russia
- 10.8 Netherlands
- 10.9 Belgium
- 10.10 Sweden
- 10.11 Denmark
- 10.12 Norway
- 10.13 Rest of Europe
Chapter 11. Asia Pacific Glass Reactor Market
- 11.1 China
- 11.2 India
- 11.3 Japan
- 11.4 South Korea
- 11.5 Thailand
- 11.6 Indonesia
- 11.7 Vietnam
- 11.8 Malaysia
- 11.9 Australia
- 11.10 Rest of Asia Pacific
Chapter 12. Latin America Glass Reactor Market
- 12.1 Brazil
- 12.2 Argentina
- 12.3 Colombia
- 12.4 Chile
- 12.5 Rest of Latin America
Chapter 13. Middle East Glass Reactor Market
- 13.1 Saudi Arabia
- 13.2 United Arab Emirates
- 13.3 Turkey
- 13.4 Israel
- 13.5 Iran
- 13.6 Rest of the Middle East
Chapter 14. Africa Glass Reactor Market
- 14.1 South Africa
- 14.2 Egypt
- 14.3 Nigeria
- 14.4 Morocco
- 14.5 Rest of Africa
Chapter 15. Glass Reactor Company Profiles
- 15.1 [Company 01]
- 15.1.1 Company Overview
- 15.1.2 Key Management Personnel
- 15.1.3 Products & Services Portfolio
- 15.1.4 Financial Performance
- 15.1.5 Key Market Focus & Geographic Presence
- 15.1.6 Recent Developments & Strategic Initiatives
Note: The company profile list is preliminary and may change based on research findings, market developments, data availability, and client requirements.
Chapter 16. Appendices
- Appendix A – List of Abbreviations & Acronyms
- Appendix B – Industry Classification Code Reference – Full Series
- Appendix C – Supply, Output & Operating Capacity Data Tables
- Appendix D – End-Use & Demand Base Tables
- Appendix E – Demand, Adoption & Usage Assumptions
- Appendix F – Pricing & Revenue Metric Reference Tables
- Appendix G – Company Operations & Infrastructure Database
- Appendix H – Cross-Border Trade & Activity Data Tables (Where Applicable)
- Appendix I – Regulatory Summary Tables
- Appendix J – Primary Research Participant List (Anonymized)
- Appendix K – Primary Research Questionnaire Framework
- Appendix L – Data Sources & Bibliography
- Appendix M – Market Size Divergence & Source Comparison
Chapter 17. Research Methodology
- 17.1 Research Framework & Philosophy
- 17.2 Secondary Research – Sources, Hierarchy & Data Extraction
- 17.3 Data Modeling – Bottom-Up & Top-Down Market Sizing
- 17.4 Primary Research – Stakeholder Framework, LOI & Sample Sizes
- 17.5 Forecast Methodology – Regression, Scenario & Sensitivity Analysis
- 17.6 Quality Control – Four-Layer Validation Framework
- 17.7 Limitations & Standard Assumptions
- 17.8 Disclaimer
