
Market Overview
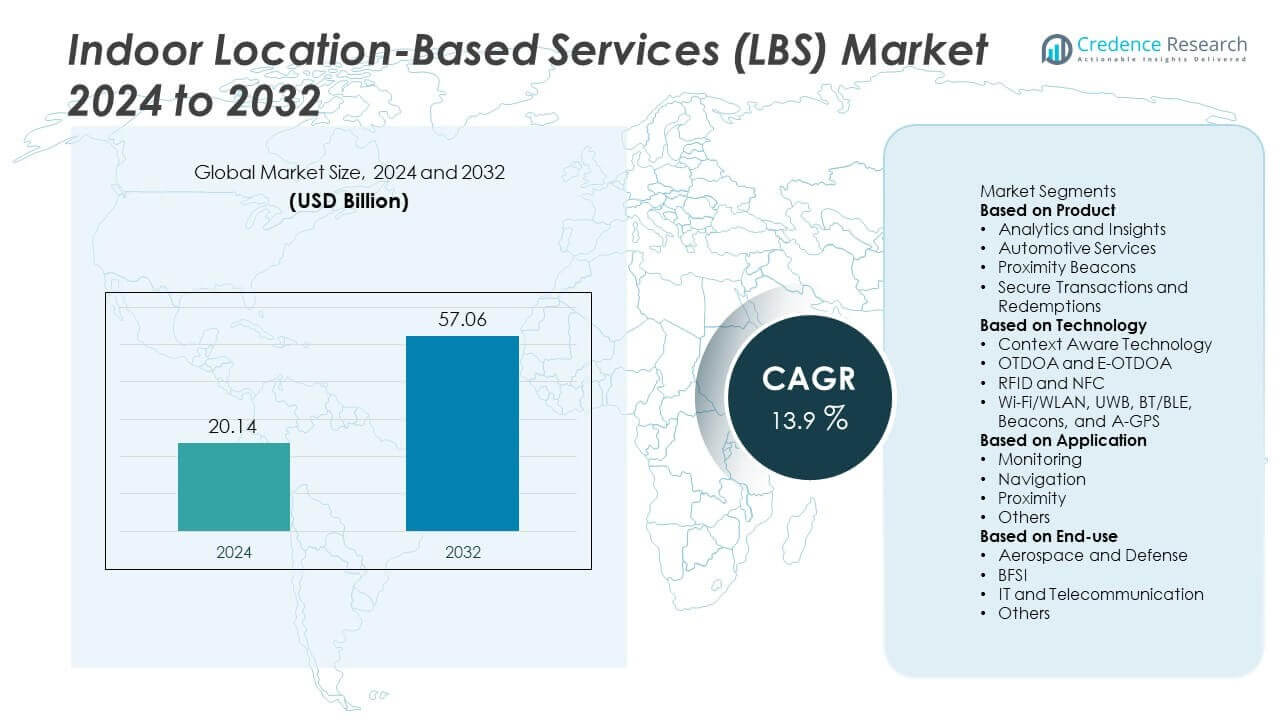
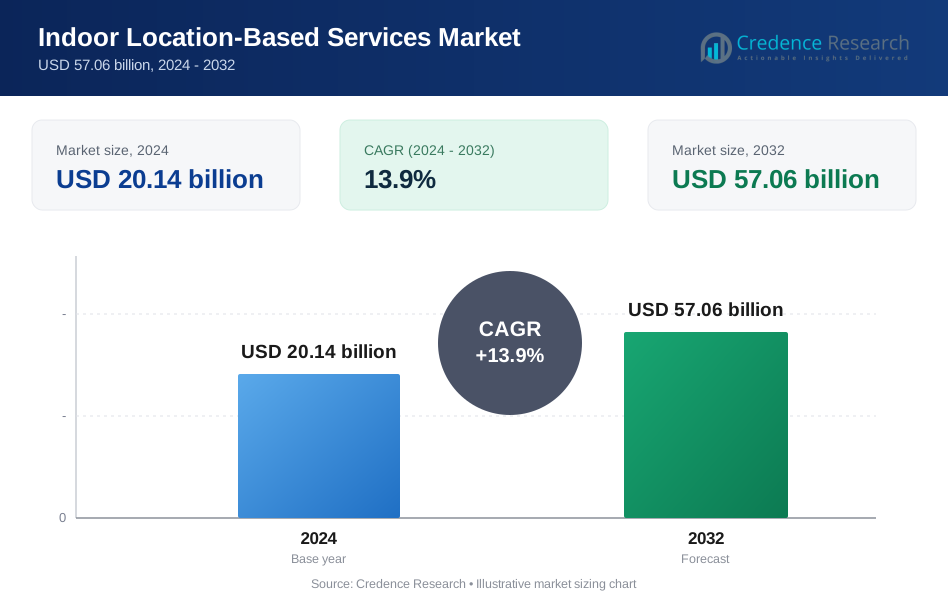
The Indoor Location-Based Services (LBS) Market was valued at USD 20.14 billion in 2024 and is projected to reach USD 57.06 billion by 2032, expanding at a CAGR of 13.9% during the forecast period.
| REPORT ATTRIBUTE | DETAILS |
|---|---|
| Historical Period | 2020-2023 |
| Base Year | 2024 |
| Forecast Period | 2025-2032 |
| Indoor Location-Based Services (LBS) Market Size 2024 | USD 20.14 Billion |
| Indoor Location-Based Services (LBS) Market, CAGR | 13.9% |
| Indoor Location-Based Services (LBS) Market Size 2032 | USD 57.06 Billion |
The Indoor Location-Based Services (LBS) Market grows with rising demand for real-time navigation, personalized promotions, and operational efficiency across retail, healthcare, and transportation sectors. Governments support adoption through smart city initiatives and investments in digital infrastructure.
The Indoor Location-Based Services (LBS) Market shows diverse regional growth driven by technology adoption, infrastructure maturity, and digital strategies. North America leads with strong presence of advanced players and widespread deployment of LBS in retail, healthcare, and airports. Europe emphasizes smart infrastructure projects, with governments and enterprises adopting indoor navigation and proximity marketing solutions to enhance customer experiences and operational efficiency. Asia-Pacific grows rapidly with large-scale digitalization in China, India, Japan, and South Korea, supported by smart city programs and high smartphone penetration. Latin America expands gradually through investments in retail modernization and transport infrastructure, while the Middle East and Africa focus on smart city development and urban mobility solutions. Key players such as Apple Inc., Google LLC, Cisco Systems, Inc., and Qualcomm Technologies, Inc. drive innovation with AI-enabled analytics, IoT integration, and Bluetooth beacon technologies, ensuring enhanced precision and broader adoption across industries worldwide.
Market Insights
- The Indoor Location-Based Services (LBS) Market was valued at USD 20.14 billion in 2024 and is projected to reach USD 57.06 billion by 2032, growing at a CAGR of 13.9%.
- Rising demand for real-time indoor navigation, asset tracking, and personalized promotions drives strong adoption across retail, healthcare, transportation, and hospitality sectors.
- Expanding use of IoT, AI-driven analytics, and Bluetooth beacons highlights a clear trend toward higher accuracy, scalability, and user engagement.
- Competitive landscape is defined by leading players such as Apple Inc., Google LLC, Cisco Systems, Inc., and Qualcomm Technologies, Inc., focusing on smart navigation platforms, AI-based personalization, and integration with IoT ecosystems.
- High implementation costs, privacy concerns, and technical challenges such as signal interference act as restraints, limiting adoption in budget-sensitive markets and regions with weaker infrastructure.
- North America leads with advanced deployment across airports, retail chains, and hospitals, while Europe emphasizes smart infrastructure and cross-border digital integration, and Asia-Pacific emerges as the fastest-growing region with large-scale adoption in China, India, Japan, and South Korea.
- Latin America and the Middle East & Africa show steady progress, with investments in smart cities, retail modernization, and transport infrastructure creating new opportunities for scalable LBS solutions across emerging economies.
Market Drivers
Growing Demand for Real-Time Navigation and Indoor Mapping Solutions
The Indoor Location-Based Services (LBS) Market is driven by increasing demand for real-time navigation in large indoor facilities. Airports, shopping malls, hospitals, and corporate campuses deploy location-based services to guide visitors and improve efficiency. It provides accurate indoor mapping that enhances customer experiences and operational control. Retailers use these solutions to analyze customer movement and optimize store layouts. The rising importance of seamless navigation in public spaces continues to accelerate adoption. Indoor LBS supports improved accessibility and service personalization across multiple industries.
- For instance, Cisco Spaces has processed 29.9 trillion location data points from 4.4 million connected access points, enabling enterprises to deliver precise navigation and occupancy analytics. This data is used to provide insights on space utilization, visitor behavior, and to enable applications such as indoor wayfinding and density monitoring.
Rising Adoption in Retail, Healthcare, and Hospitality Sectors
The Indoor Location-Based Services (LBS) Market benefits from strong demand across retail, healthcare, and hospitality. Retailers use LBS for personalized promotions, footfall analysis, and customer engagement. Hospitals deploy location tracking for patient monitoring, equipment management, and staff coordination. Hotels and resorts enhance guest experiences by offering indoor navigation and customized services. It strengthens operational efficiency while improving service delivery. Expanding application scope across diverse sectors ensures long-term demand for indoor LBS solutions.
- For instance, IndoorAtlas released SDK 3.7.1, enhancing magnetic-only positioning accuracy and geofence performance, allowing retail chains to manage thousands of geofences simultaneously for targeted customer engagement.
Integration of Advanced Technologies Including IoT, AI, and Bluetooth Beacons
The Indoor Location-Based Services (LBS) Market experiences growth from integration of IoT, AI, and Bluetooth beacon technologies. These tools enable precise location tracking and real-time analytics. It allows enterprises to offer targeted services based on user behavior and preferences. AI-driven insights improve decision-making and resource allocation in indoor environments. Bluetooth Low Energy (BLE) beacons make deployment more cost-effective and scalable. The combination of emerging technologies enhances accuracy and personalization in indoor applications.
Government Initiatives and Expanding Smart Infrastructure Projects
The Indoor Location-Based Services (LBS) Market is supported by government programs promoting smart infrastructure development. Smart city initiatives drive large-scale adoption of indoor navigation systems in public facilities and transport hubs. It ensures better management of crowd flow, emergency response, and urban mobility. Public safety agencies use LBS for surveillance, incident tracking, and evacuation planning. Increasing investment in digital infrastructure creates a favorable environment for LBS growth. Strong government support accelerates deployment across transportation, healthcare, and commercial facilities worldwide.
Market Trends
Increasing Use of Proximity Marketing and Context-Aware Services
The Indoor Location-Based Services (LBS) Market is influenced by the growing use of proximity marketing. Retailers and service providers use LBS to deliver personalized promotions and real-time offers based on customer location. It improves customer engagement and helps businesses increase sales. Context-aware services also allow organizations to analyze consumer behavior and optimize product placement. Rising demand for customized experiences strengthens adoption across shopping malls, airports, and entertainment venues. This trend highlights the strategic role of LBS in customer retention and revenue generation.
- For instance, IndoorAtlas introduced its Real-Time Beacon Visualization feature, enabling retailers to monitor Bluetooth beacon observations to help verify if they are functioning as expected.
Expansion of Indoor Navigation and Wayfinding Applications
The Indoor Location-Based Services (LBS) Market benefits from expanding indoor navigation applications in complex facilities. Airports, hospitals, and stadiums use LBS to guide visitors efficiently through large spaces. It reduces congestion, improves accessibility, and enhances user convenience. Educational institutions also implement wayfinding solutions to streamline movement across campuses. Growing focus on seamless mobility experiences supports wider adoption. The trend reflects the role of indoor navigation as a critical function across multiple sectors.
- For instance, Apple Maps includes detailed indoor maps for select major airports and shopping centers, supporting features like searching for specific shops or services, viewing different floor levels, and providing step-by-step wayfinding.
Adoption of AI and Data Analytics for Enhanced Insights
The Indoor Location-Based Services (LBS) Market shows strong momentum in AI-driven analytics adoption. Organizations use advanced algorithms to analyze location data and predict user behavior. It enables enterprises to optimize resource allocation and improve service delivery. AI-powered platforms also support predictive maintenance and security management in indoor facilities. Data analytics strengthens decision-making by uncovering usage patterns and trends. This development positions LBS as a strategic tool for operational excellence.
Rising Integration with Smart Building and IoT Ecosystems
The Indoor Location-Based Services (LBS) Market is shaped by integration with smart building technologies. IoT devices and sensors enable real-time monitoring of energy use, occupancy, and safety. It supports facility managers in achieving efficiency and sustainability goals. Smart building ecosystems also leverage LBS for automation and emergency response. Growing adoption of connected devices accelerates this trend in commercial and public infrastructure. The shift toward IoT-enabled environments ensures continuous opportunities for indoor LBS solutions.
Market Challenges Analysis
High Implementation Costs and Technical Integration Barriers
The Indoor Location-Based Services (LBS) Market faces challenges from high deployment costs and complex integration requirements. Establishing accurate indoor positioning systems requires investment in hardware such as sensors, beacons, and Wi-Fi access points. It creates financial barriers for small and medium-sized enterprises that lack sufficient budgets. Compatibility with existing IT infrastructure often complicates large-scale adoption. Limited technical expertise within organizations also slows effective implementation. These challenges reduce the pace of deployment in price-sensitive markets.
Privacy Concerns, Data Security Risks, and Reliability Issues
The Indoor Location-Based Services (LBS) Market is also hindered by privacy concerns, cybersecurity risks, and performance limitations. Tracking user movements indoors raises concerns over data misuse and personal security. It requires robust compliance with data protection laws to maintain user trust. Cybersecurity threats, including unauthorized access to sensitive data, pose significant risks. Accuracy and reliability challenges persist in environments with signal interference or limited coverage. These issues restrict adoption in sectors where trust and reliability are critical for service delivery.
Market Opportunities
Expansion Through Smart City Initiatives and Public Infrastructure Projects
The Indoor Location-Based Services (LBS) Market presents significant opportunities through government-backed smart city programs and digital infrastructure investments. Public transport hubs, airports, and healthcare facilities increasingly integrate LBS to improve crowd management and service efficiency. It supports better emergency response and enhances visitor navigation in complex environments. Growing adoption in educational institutions and cultural venues further broadens demand. Investments in urban development create favorable conditions for large-scale LBS deployment. These initiatives strengthen the role of indoor LBS as a core element of smart infrastructure.
Rising Potential Across Retail, Hospitality, and Industrial Applications
The Indoor Location-Based Services (LBS) Market also benefits from rising opportunities in retail, hospitality, and industrial sectors. Retailers adopt LBS for personalized promotions, customer analytics, and store optimization. It enables hotels and resorts to deliver customized guest services through location-based interactions. Industrial facilities implement LBS for asset tracking, workforce management, and safety monitoring. Growing reliance on IoT and connected devices amplifies the potential for indoor applications. Expanding use cases across commercial and industrial domains position LBS as a versatile solution with long-term growth prospects.
Market Segmentation Analysis:
By Product
The Indoor Location-Based Services (LBS) Market, by product, is segmented into hardware, software, and services. Hardware includes sensors, Wi-Fi access points, RFID tags, and Bluetooth beacons, which provide the foundation for location accuracy. Software platforms manage analytics, mapping, and user engagement, delivering actionable insights for enterprises. It supports personalized services and advanced navigation capabilities across various facilities. Services, including consulting, system integration, and maintenance, ensure smooth implementation and long-term reliability. Growing reliance on professional support highlights the importance of services in complex deployments. Each product category plays a vital role in driving adoption across industries.
- For instance, HERE collaborated with AWS to enhance its location and indoor mapping services, enabling enterprises to host and update maps in various facilities globally. HERE and AWS have worked together to provide indoor positioning services to developers, and HERE offers customers tools to manage and update their indoor map data.
By Technology
The Indoor Location-Based Services (LBS) Market, by technology, includes Wi-Fi, Bluetooth Low Energy (BLE), RFID, Ultra-Wideband (UWB), and others. Wi-Fi-based systems dominate due to widespread availability and cost-effectiveness in large facilities. BLE beacons see rapid adoption because of their high precision and energy efficiency. It makes BLE attractive for retail, healthcare, and hospitality applications. UWB offers superior accuracy and is increasingly deployed in industrial environments requiring precise asset tracking. RFID maintains relevance in logistics and warehouse management, while hybrid solutions combine multiple technologies to improve reliability. Expanding innovation in location accuracy and cost reduction continues to strengthen technology adoption.
- For instance, Qualcomm enhanced its Aware™ platform with indoor positioning support leveraging Wi-Fi, cellular, and Bluetooth Low Energy (BLE) beacons, which provides estimated location accuracy of approximately 10 meters, with potential for enhanced precision after a site survey, while using power-optimized algorithms for extended device life in industrial IoT deployments.
By Application
The Indoor Location-Based Services (LBS) Market, by application, covers retail, healthcare, transportation, hospitality, industrial, and others. Retailers use LBS to deliver targeted promotions and analyze customer movement patterns. Healthcare facilities deploy it for patient monitoring, equipment tracking, and staff coordination. Transportation hubs, including airports and train stations, implement LBS for navigation and crowd management. Hospitality providers adopt LBS to improve guest experiences with personalized services and seamless navigation. Industrial facilities integrate location services for workforce safety and asset monitoring. Expanding applications across multiple verticals underline the versatility of indoor LBS in supporting efficiency and customer engagement.
Segments:
Based on Product
- Analytics and Insights
- Automotive Services
- Proximity Beacons
- Secure Transactions and Redemptions
Based on Technology
- Context Aware Technology
- OTDOA and E-OTDOA
- RFID and NFC
- Wi-Fi/WLAN, UWB, BT/BLE, Beacons, and A-GPS
Based on Application
- Monitoring
- Navigation
- Proximity
- Others
Based on End-use
- Aerospace and Defense
- BFSI
- IT and Telecommunication
- Others
Based on the Geography:
- North America
- U.S.
- Canada
- Mexico
- Europe
- UK
- France
- Germany
- Italy
- Spain
- Russia
- Belgium
- Netherlands
- Austria
- Sweden
- Poland
- Denmark
- Switzerland
- Rest of Europe
- Asia Pacific
- China
- Japan
- South Korea
- India
- Australia
- Thailand
- Indonesia
- Vietnam
- Malaysia
- Philippines
- Taiwan
- Rest of Asia Pacific
- Latin America
- Brazil
- Argentina
- Peru
- Chile
- Colombia
- Rest of Latin America
- Middle East
- UAE
- KSA
- Israel
- Turkey
- Iran
- Rest of Middle East
- Africa
- Egypt
- Nigeria
- Algeria
- Morocco
- Rest of Africa
Regional Analysis
North America
North America accounts for the largest share of the Indoor Location-Based Services (LBS) Market, holding nearly 36% in 2024. The region benefits from early adoption of advanced technologies and strong investments in digital infrastructure. The United States leads growth with extensive deployment of LBS solutions in retail, healthcare, and transportation sectors. Airports, shopping malls, and hospitals increasingly adopt location-based platforms to enhance customer experiences and operational efficiency. Canada supports expansion through government-backed smart city projects and high demand for indoor navigation in public facilities. Mexico contributes steadily with rising investments in retail modernization and healthcare infrastructure. It reflects a mature ecosystem where innovation and digital transformation drive strong adoption.
Europe
Europe represents around 27% of the Indoor Location-Based Services (LBS) Market in 2024, supported by growing demand for proximity marketing, healthcare tracking, and navigation systems. Countries such as Germany, the United Kingdom, and France lead with investments in smart infrastructure and digital services. Retailers adopt LBS to enhance customer engagement and analyze movement patterns across stores. Airports and transport hubs integrate indoor navigation to improve passenger flow and service delivery. Southern and Eastern European nations gradually increase adoption with expanding e-commerce logistics and healthcare modernization. It benefits from European Union policies supporting smart mobility and connected infrastructure projects. This creates a strong growth environment for LBS platforms across the region.
Asia-Pacific
Asia-Pacific accounts for nearly 25% of the Indoor Location-Based Services (LBS) Market in 2024, making it the fastest-growing region. China drives adoption with large-scale retail development, smart city initiatives, and high smartphone penetration. Japan and South Korea emphasize advanced technologies such as BLE and UWB for high-precision indoor navigation in airports, hospitals, and industrial facilities. India shows rapid growth with expanding digitalization and rising investments in e-commerce and healthcare. Southeast Asian countries, including Indonesia, Vietnam, and Thailand, adopt LBS solutions to support retail, transport, and hospitality industries. It demonstrates strong potential driven by government-backed smart infrastructure programs and rising consumer demand for digital services.
Latin America
Latin America holds nearly 7% of the Indoor Location-Based Services (LBS) Market in 2024, reflecting steady but growing adoption. Brazil leads with investments in retail modernization, airport upgrades, and healthcare technology. Mexico expands adoption through e-commerce growth and integration of LBS in public infrastructure projects. Chile, Argentina, and Colombia contribute with gradual adoption in retail and transport facilities. It faces challenges from limited digital infrastructure in some areas, but rising internet penetration and mobile adoption create favorable conditions for growth. Increasing focus on customer engagement and smart retail supports regional expansion of indoor LBS platforms.
Middle East and Africa
The Middle East and Africa together represent about 5% of the Indoor Location-Based Services (LBS) Market in 2024, showing gradual progress. The Middle East, led by the United Arab Emirates, Saudi Arabia, and Qatar, invests heavily in smart city projects, airports, and hospitality facilities that rely on LBS solutions. Africa demonstrates emerging adoption, with South Africa, Nigeria, and Egypt deploying indoor navigation systems in retail and healthcare. It is supported by international funding for digital infrastructure development and rising smartphone usage across urban populations. Growing demand for efficient transport, smart malls, and healthcare services creates opportunities for indoor LBS growth. While the region’s share remains small, accelerating digital transformation strengthens its long-term potential.
Key Player Analysis
- HERE
- Qualcomm Technologies, Inc.
- Navizone Limited
- Google LLC
- Glopos Technologies
- Microsoft
- IndoorAtlas
- Apple Inc.
- Cisco Systems, Inc.
- Inside Secure
Competitive Analysis
The competitive landscape of the Indoor Location-Based Services (LBS) Market is shaped by leading players including Apple Inc., Google LLC, Cisco Systems, Inc., Qualcomm Technologies, Inc., HERE, Microsoft, IndoorAtlas, Glopos Technologies, Navizone Limited, and Inside Secure. These companies focus on developing advanced indoor positioning platforms that combine IoT, AI, and Bluetooth beacon technologies to improve accuracy, scalability, and personalization. They emphasize innovation in real-time navigation, asset tracking, and proximity marketing, catering to industries such as retail, healthcare, transportation, and hospitality. Strategic partnerships with enterprises and governments strengthen their role in smart city projects, airport modernization, and large-scale commercial deployments. Investments in AI-driven analytics enhance location intelligence, helping businesses optimize customer engagement and operational efficiency. Global expansion remains a core strategy, with strong initiatives in North America, Europe, and Asia-Pacific, while targeting growth opportunities in emerging economies. Continuous product upgrades, ecosystem integration, and competitive pricing drive intense rivalry and steady market evolution.
Recent Developments
- In June 2025, IndoorAtlas Released SDK version 3.7.1 for iOS and Android. It improved AR wayfinding, cart-mode performance, magnetic-only positioning, and reduced geofence memory use when handling thousands of geofences.
- In March 2025, Qualcomm Technologies, Inc. Released a new modem lineup that supports “precise positioning” along industrial IoT, enabling lower latency indoor location services.
- In January 2025, HERE At CES, HERE and AWS announced an expanded partnership aiming to improve indoor mapping and positioning services using cloud infrastructure.
- In January 2025, Qualcomm Technologies, Inc. Announced at CES 2025 a new evolution of the Qualcomm Aware™ Platform, adding fine indoor positioning capabilities for enterprise devices.
Report Coverage
The research report offers an in-depth analysis based on Product, Technology, Application, End-use and Geography. It details leading market players, providing an overview of their business, product offerings, investments, revenue streams, and key applications. Additionally, the report includes insights into the competitive environment, SWOT analysis, current market trends, as well as the primary drivers and constraints. Furthermore, it discusses various factors that have driven market expansion in recent years. The report also explores market dynamics, regulatory scenarios, and technological advancements that are shaping the industry. It assesses the impact of external factors and global economic changes on market growth. Lastly, it provides strategic recommendations for new entrants and established companies to navigate the complexities of the market.
Future Outlook
- Demand for real-time indoor navigation will expand across airports, hospitals, and shopping malls.
- AI-driven analytics will strengthen personalization and decision-making in indoor environments.
- Bluetooth Low Energy and Ultra-Wideband will gain prominence for higher accuracy and efficiency.
- Retailers will increasingly use indoor LBS for proximity marketing and customer engagement.
- Smart city projects will accelerate adoption of indoor tracking and navigation systems.
- Healthcare providers will expand LBS use for patient monitoring and equipment management.
- Integration with IoT ecosystems will drive automation and operational optimization.
- Privacy-focused solutions will emerge to address user concerns over data security.
- Emerging economies will adopt indoor LBS to support digital infrastructure and mobility services.
- Partnerships between technology providers and enterprises will accelerate global deployment of indoor LBS platforms.
Request a Free Sample
Fill in your details and we'll send you a free sample report.
- Sample data tables & charts
- Research methodology
Need a Custom Version of This Report?
Tailor the scope, geography, or segments to your exact requirements.
- Custom geography or segment scope
- Direct access to our analyst team
Frequently Asked Questions
What is the current market size for Indoor Location-Based Services (LBS), and what is its projected size in 2032?
At what Compound Annual Growth Rate is the Indoor Location-Based Services (LBS) market projected to grow between 2025 and 2032?
Which Indoor Location-Based Services (LBS) market segment held the largest share in 2024?
What are the primary factors fueling the growth of the Indoor Location-Based Services (LBS) market?
Who are the leading companies in the Indoor Location-Based Services (LBS) market?
Which region commanded the largest share of the Indoor Location-Based Services (LBS) market in 2024?
Table of Content
Chapter 1. Report Introduction
- 1.1 Report Description & Purpose
- 1.1.1 Report Title & Market Definition
- 1.1.2 Unique Selling Propositions (USP) & Key Differentiators
- 1.1.3 Value Proposition for Stakeholders
- 1.2 Research Objectives
- 1.2.1 Market Sizing Objectives (Volume & Revenue)
- 1.2.2 Segmentation Objectives
- 1.2.3 Competitive Intelligence Objectives
- 1.2.4 Forecast & Scenario Objectives
- 1.3 Report Scope
- 1.3.1 Indoor Location-Based Services Scope – Types & Subtypes Covered
- 1.3.2 Geographic Scope – Regions & Countries Covered
- 1.3.3 Historical Period, Base Year & Forecast Period (2024; forecast to 2032)
- 1.3.4 Inclusions & Exclusions
- 1.4 HS Code & Classification Framework
- 1.5 Currency, Units & Pricing Basis
- 1.6 Target Stakeholders
- 1.7 Limitations & Assumptions
Chapter 2. Executive Summary
- 2.1 Global Indoor Location-Based Services Market Snapshot
- 2.1.1 Market Size – Historical (2024) & Forecast (2024-2032) (2024: USD 20.14 billion → 2032: USD 57.06 billion)
- 2.1.2 Volume & Revenue – Global Totals
- 2.1.3 Key Market Highlights – Top Five Facts
- 2.2 Indoor Location-Based Services Market Segmentation Snapshot
- 2.2.1 Market Split by Region – 2024 vs. 2032
- 2.3 Competitive Snapshot
- 2.3.1 Top 10 Players by Revenue Share – 2024
- 2.3.2 Top 10 Players by Volume Share – 2024
- 2.3.3 Recent Strategic Developments (18-Month Summary)
- 2.4 Key Investment Highlights & Strategic Conclusions
Chapter 3. Indoor Location-Based Services Market Dynamics & Industry Analysis
- 3.1 Market Overview & Context
- 3.1.1 Indoor Location-Based Services Market Position in the Broader Automotive Value Chain
- 3.1.2 OEM vs. Replacement Market Dynamics
- 3.1.3 Market Maturity & Development Stage by Region
- 3.2 Indoor Location-Based Services Market Drivers
- 3.3 Indoor Location-Based Services Market Restraints & Challenges
- 3.4 Indoor Location-Based Services Market Opportunities
- 3.5 Porter's Five Forces Analysis
- 3.5.1 Threat of New Entrants
- 3.5.2 Bargaining Power of Suppliers
- 3.5.3 Bargaining Power of Buyers
- 3.5.4 Threat of Substitutes
- 3.5.5 Competitive Rivalry – Intensity Assessment
- 3.6 Indoor Location-Based Services Value Chain Analysis
- 3.6.1 Upstream – Raw Material/Input Suppliers
- 3.6.1.1 Raw Material/Input 1
- 3.6.1.2 Raw Material/Input 2
- 3.6.1.3 Raw Material/Input 3
- 3.6.2 Midstream – Production/Manufacturing/Service Delivery
- 3.6.2.1 Production/Process Overview
- 3.6.2.2 Key Facility Locations & Capacity by Manufacturer
- 3.6.3 Downstream – Distribution & End Consumer
- 3.6.3.1 Primary Channel – B2B/OEM
- 3.6.3.2 Secondary Channels – Dealer, Retail, Online, Direct
- 3.6.4 Value Chain Profitability Analysis
- 3.6.1 Upstream – Raw Material/Input Suppliers
- 3.7 PESTEL Analysis
- 3.7.1 Political Factors
- 3.7.2 Economic Factors
- 3.7.3 Social Factors
- 3.7.4 Technological Factors
- 3.7.5 Environmental Factors
- 3.7.6 Legal Factors
- 3.8 Indoor Location-Based Services Supply Chain Analysis
- 3.8.1 Raw Material/Input Supply Risk Assessment
- 3.8.2 Manufacturing Concentration Risk (Geographic Exposure)
- 3.8.3 Trade Disruption Impact Analysis
- 3.9 Regulatory & Policy Landscape
Note: The regulatory and policy landscape section covers regulations based on their applicability to the market, Indoor Location-Based Services category, geography, and scope of the study. Only regulatory frameworks with a material impact on operations, compliance, trade, sustainability, or market access are analyzed in detail.
Chapter 4. Key Investment Pockets & Opportunity Analysis
- 4.1 Indoor Location-Based Services Market Attractiveness Analysis
- 4.1.1 By Region – Investment Attractiveness Matrix (Volume × CAGR)
- 4.2 Absolute Revenue Growth Opportunity
- 4.2.1 By Region – Absolute USD Growth Through 2032
- 4.3 Incremental Volume Opportunity
- 4.3.1 By Region – Incremental Volume Through 2032
- 4.3.2 Segment – Incremental Volume
- 4.4 Emerging Submarket Opportunity Deep Dive (Subject to Applicability)
- 4.5 Emerging Market Opportunity Scorecards
- 4.5.1 United States
- 4.5.2 Europe
- 4.5.3 Asia
- 4.5.4 Middle East & Africa
Note: Emerging Market Opportunity Scorecards will be included based on relevance and strategic importance. Regions listed are indicative and may vary depending on data availability and market dynamics.
Chapter 5. Indoor Location-Based Services Import-Export Analysis & Trade Flows
- 5.1 Global Trade Overview
- 5.1.1 Global Export Value by Country (2024)
- 5.1.2 Global Export Volume by Country (2024)
- 5.1.3 Global Import Value by Country (2024)
- 5.1.4 Global Import Volume by Country (2024)
- 5.1.5 Net Trade Balance by Country (2024)
- 5.2 Export Analysis – Segment
- 5.2.1 Type 1 (HS Code)
- 5.2.2 Type 2 (HS Code)
- 5.2.3 Type 3 (HS Code)
- 5.2.4 Type 4 (HS Code)
- 5.2.5 Type 5 (HS Code)
- 5.3 Import Analysis – Segment
- 5.3.1 Type 1 (HS Code)
- 5.3.2 Type 2 (HS Code)
- 5.3.3 Type 3 (HS Code)
- 5.3.4 Type 4 (HS Code)
- 5.3.5 Type 5 (HS Code)
- 5.4 Average Unit Trade Prices
- 5.4.1 Average Export Price – Segment & Country
- 5.4.2 Average Import Price – Segment & Source Country
- 5.4.3 Price Trends (2024)
- 5.5 Key Trade Route Analysis
- 5.5.1 Trade Route 1
- 5.5.2 Trade Route 2
- 5.5.3 Trade Route 3
- 5.5.4 Trade Route 4
- 5.5.5 Trade Route 5
- 5.6 Trade Policy Impact Assessment
- 5.6.1 US Anti-Dumping & Section 301 Tariffs
- 5.6.2 EU Customs Union Impact
- 5.6.3 Major Free Trade Agreements
- 5.6.4 USMCA Rules of Origin
Note: Trade policy analysis will be included only where relevant to the Indoor Location-Based Services market.
Chapter 6. Competitive Landscape & Company Benchmarking
- 6.1 Indoor Location-Based Services Market Concentration & Structure
- 6.1.1 Herfindahl-Hirschman Index (HHI) – vs. 2024
- 6.1.2 Tier 1, Tier 2 & Tier 3 Market Structure
- 6.1.3 Global, Regional & Local Player Dynamics
- 6.2 Indoor Location-Based Services Market Share Analysis – 2024
- 6.2.1 Global Revenue Share by Company
- 6.2.2 Global Volume Share by Company
- 6.2.3 Regional Revenue Share
- 6.2.4 Market Share Evolution ( vs. 2024)
- 6.2.5 OEM Segment Share by Company
- 6.2.6 Replacement Segment Share by Company
- 6.3 Production/Delivery Capacity & Facility Analysis
- 6.3.1 Global Installed Capacity
- 6.3.2 Capacity Utilization Rates
- 6.3.3 Production/Output Volume
- 6.3.4 Facility Locations & Capacity Map
- 6.3.5 Planned Capacity Additions
- 6.4 Indoor Location-Based Services Competitive Benchmarking Matrix
- 6.4.1 Revenue, Volume, CAGR & Profitability Comparison
- 6.4.2 Channel Revenue Mix
- 6.4.3 Geographic Revenue Exposure
- 6.4.4 R&D Intensity
- 6.4.5 Sustainability Maturity
- 6.5 Strategic Developments in Indoor Location-Based Services (Last 24 Months)
- 6.5.1 Mergers, Acquisitions & Divestments
- 6.5.2 New Indoor Location-Based Services Launches
- 6.5.3 Facility Expansions
- 6.5.4 Strategic Alliances, Joint Ventures & Partnerships
- 6.5.5 Distribution Expansion & Market Entry
- 6.5.6 Sustainability & ESG Initiatives
- 6.6 Competitive Strategy Mapping
- 6.6.1 Leader, Challenger, Follower & Niche Classification
- 6.6.2 Pricing Strategy Comparison
- 6.6.3 Channel Strategy Matrix
Note: Strategic developments are included based on their materiality and the availability of reliable information.
Chapter 7. Global Indoor Location-Based Services Market – By Distribution Channel
- 7.1 Segment Overview
- 7.1.1 Volume & Revenue Split by Channel (2024 & 2032)
- 7.1.2 Channel Mix Evolution (2024-2032)
Chapter 8. Regional Market Analysis – Global Overview
- 8.1 Global Regional Overview
- 8.1.1 Regional Volume Share
- 8.1.2 Regional Revenue Share
- 8.1.3 Regional Volume by Region
- 8.1.4 Regional Revenue by Region
- 8.1.5 Regional Forecast Through 2032
- 8.2 Cross-Regional Segment Analysis
- 8.2.1 By Distribution Channel
- 8.2.2 By Brand/Price Tier
Chapter 9. North America Indoor Location-Based Services Market
- 9.1 United States
- 9.2 Canada
- 9.3 Mexico
Chapter 10. Europe Indoor Location-Based Services Market
- 10.1 Germany
- 10.2 France
- 10.3 Italy
- 10.4 United Kingdom
- 10.5 Spain
- 10.6 Poland
- 10.7 Russia
- 10.8 Netherlands
- 10.9 Belgium
- 10.10 Sweden
- 10.11 Denmark
- 10.12 Norway
- 10.13 Rest of Europe
Chapter 11. Asia Pacific Indoor Location-Based Services Market
- 11.1 China
- 11.2 India
- 11.3 Japan
- 11.4 South Korea
- 11.5 Thailand
- 11.6 Indonesia
- 11.7 Vietnam
- 11.8 Malaysia
- 11.9 Australia
- 11.10 Rest of Asia Pacific
Chapter 12. Latin America Indoor Location-Based Services Market
- 12.1 Brazil
- 12.2 Argentina
- 12.3 Colombia
- 12.4 Chile
- 12.5 Rest of Latin America
Chapter 13. Middle East Indoor Location-Based Services Market
- 13.1 Saudi Arabia
- 13.2 United Arab Emirates
- 13.3 Turkey
- 13.4 Israel
- 13.5 Iran
- 13.6 Rest of the Middle East
Chapter 14. Africa Indoor Location-Based Services Market
- 14.1 South Africa
- 14.2 Egypt
- 14.3 Nigeria
- 14.4 Morocco
- 14.5 Rest of Africa
Chapter 15. Indoor Location-Based Services Company Profiles
- 15.1 [Company 01]
- 15.1.1 Company Overview
- 15.1.2 Key Management Personnel
- 15.1.3 Products & Services Portfolio
- 15.1.4 Financial Performance
- 15.1.5 Key Market Focus & Geographic Presence
- 15.1.6 Recent Developments & Strategic Initiatives
Note: The company profile list is preliminary and may change based on research findings, market developments, data availability, and client requirements.
Chapter 16. Appendices
- Appendix A – List of Abbreviations & Acronyms
- Appendix B – Industry Classification Code Reference – Full Series
- Appendix C – Production & Capacity Data Tables
- Appendix D – End-Use & Demand Base Tables
- Appendix E – Consumption & Replacement Rate Assumptions
- Appendix F – ASP Reference Tables
- Appendix G – Manufacturing & Facility Database
- Appendix H – Import-Export Data Tables
- Appendix I – Regulatory Summary Tables
- Appendix J – Primary Research Participant List (Anonymized)
- Appendix K – Primary Research Questionnaire Framework
- Appendix L – Data Sources & Bibliography
- Appendix M – Market Size Divergence & Source Comparison
Chapter 17. Research Methodology
- 17.1 Research Framework & Philosophy
- 17.2 Secondary Research – Sources, Hierarchy & Data Extraction
- 17.3 Data Modeling – Bottom-Up & Top-Down Market Sizing
- 17.4 Primary Research – Stakeholder Framework, LOI & Sample Sizes
- 17.5 Forecast Methodology – Regression, Scenario & Sensitivity Analysis
- 17.6 Quality Control – Four-Layer Validation Framework
- 17.7 Limitations & Standard Assumptions
- 17.8 Disclaimer
