Market Overview
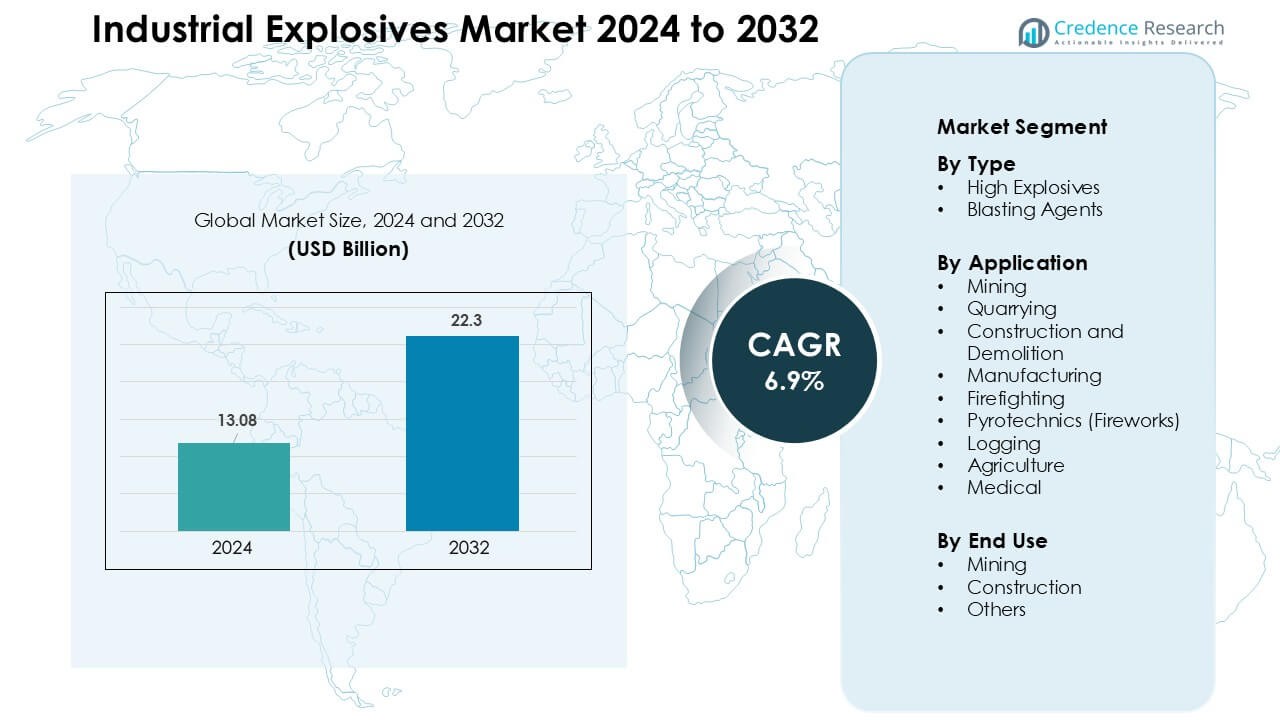
Industrial Explosives Market was valued at USD 13.08 billion in 2024 and is anticipated to reach USD 22.3 billion by 2032, growing at a CAGR of 6.9% during the forecast period
| REPORT ATTRIBUTE |
DETAILS |
| Historical Period |
2020-2023 |
| Base Year |
2024 |
| Forecast Period |
2025-2032 |
| Industrial Explosives Market Size 2024 |
USD 13.08 Billion |
| Industrial Explosives Market, CAGR |
6.9% |
| Industrial Explosives Market Size 2032 |
USD 22.3 Billion |
The industrial explosives market is shaped by major players such as Orica Ltd., Maxam Corp., AECI Ltd., Austin Powder Company, EPC Groupe Inc., NOF Corporation, Keltech Energies Ltd., Tec Pivot Limited, and Irish Industrial Explosives Ltd., each expanding bulk explosive production, electronic detonator systems, and on-site delivery capabilities to support mining and construction activities. These companies strengthen competitiveness through long-term supply contracts, digital blasting tools, and region-specific distribution networks. Asia-Pacific emerged as the leading region in 2024 with 47% share, driven by high mineral extraction, rapid infrastructure development, and widespread adoption of advanced blasting technologies.
Access crucial information at unmatched prices!
Request your sample report today & start making informed decisions powered by Credence Research Inc.!
Download Sample
Market Insights
- The industrial explosives market reached USD 13.08 billion in 2024 and is projected to grow at a CAGR of 6.9% through 2032.
- Strong mining expansion drives demand, with the mining segment holding about 52% share due to higher use of bulk emulsions and high-energy explosives.
- Digital blasting, remote initiation, and electronic detonators shape key trends as operators adopt advanced tools to improve accuracy, reduce vibration, and meet environmental rules.
- Leading players such as Orica Ltd., Maxam Corp., and AECI Ltd. compete through bulk delivery systems, mobile manufacturing units, and long-term contracts with major mining firms.
- Asia-Pacific led the market with 47% share, supported by large mineral extraction and infrastructure projects, while North America and Europe showed stable growth through quarrying and tunneling activities.
Market Segmentation Analysis:
By Type
High explosives dominated the type segment in 2024 with about 58% share, driven by strong use in hard-rock mining, tunneling, and large construction blasts. Their high detonation velocity supported deeper fragmentation and better rock breakage, which helped lower drilling costs. Demand increased as iron ore and metal mining companies expanded extraction in Asia and Africa. Blasting agents grew at a steady pace due to lower cost and bulk use in surface mines, yet high explosives kept the lead because many deep-ore operations require stronger energy output and controlled shock waves.
- For instance, cartridges from Dyno Nobel have recorded detonation velocities between 3500 and 6000 m/s in hard‑rock blastholes, which enabled finer fragmentation making oversize boulders small enough to meet primary crusher feed requirements (≤ 1.20 m).
By Application
Mining led the application segment in 2024 with nearly 52% share, supported by rising production of coal, iron ore, copper, and limestone. Large open-pit operations consumed high volumes of bulk explosives that improved bench fragmentation and reduced hauling time. Quarrying also expanded with infrastructure growth but remained smaller due to lower blast intensity. Construction and demolition gained traction with metro rail and highway tunneling projects, yet mining stayed dominant because global mineral output rose and extraction sites required continuous blasting cycles to maintain productivity.
- For instance, Rio Tinto and BHP do utilize ANFO and emulsion explosives for open-pit iron ore mining in Australia, employing conventional drill-and-blast methods to enable high-throughput haul trucks.
By End Use
Mining dominated the end-use segment in 2024 with about 61% share, driven by large-scale adoption of high-energy explosives across surface and underground sites. Higher blast efficiency supported better fragmentation, reduced fuel use, and enhanced mill performance, which helped operators cut operating costs. Construction followed with steady demand from road expansion, bridge works, and tunnel boring. Other end uses, including logging and specialized industrial applications, contributed smaller shares, but mining held the lead because mineral extraction relies heavily on scheduled blasting for consistent ore recovery.
Key Growth Drivers
Rising Mining and Metal Extraction Activities
The industrial explosives market grows strongly as global mining output expands across coal, iron ore, copper, limestone, and rare-earth elements. Countries such as China, India, Australia, and South Africa increase production to meet rising demand from construction, automotive, and clean-energy sectors. Mining companies prefer high-energy explosives because controlled fragmentation reduces hauling time, lowers fuel use, and increases mill efficiency. The shift toward deeper and harder ore bodies increases reliance on high-performance explosives and advanced blasting systems. Growth in underground mining also pushes demand for safer and more precise blasting solutions. These factors make mining expansion one of the strongest drivers for industrial explosive consumption.
- For instance, in 2024 the Asia-Pacific region led by China and India consumed a significant portion of the over 18 million tons of explosive-grade ammonium nitrate used globally for mining and blasting applications, reflecting the massive scale of extraction operations requiring sustained explosive
Infrastructure Development and Mega Construction Projects
Large-scale infrastructure programs create steady demand for industrial explosives across tunneling, road expansion, dams, metros, hydropower, and quarrying. Blasting supports rock cutting, foundation preparation, and tunnel shaping, helping contractors reduce time and equipment costs. Countries in Asia-Pacific and the Middle East invest heavily in transportation networks, industrial corridors, and urban development, boosting explosive consumption. Construction firms adopt digital blasting tools and vibration-control techniques to improve safety and precision, further increasing usage. Quarry operators also rely on explosives to meet rising aggregate demand for concrete and asphalt production. Expanding global construction activity remains a core growth driver.
- For instance, the rail network project Etihad Rail in the United Arab Emirates completed a 1.8 km long tunnel (part of its Mountain‑Hajar package) where blasting and rock excavation together resulted in removal of roughly 500,000 tonnes of rock.
Technological Advancements in Blast Optimization
New blasting technologies enhance performance, accuracy, and safety, driving strong adoption of industrial explosives. Electronic detonators, blast modeling software, and drone-based survey systems allow mining and construction firms to design precise blast patterns. These tools reduce overbreak, vibration, and dust generation, helping companies meet strict environmental norms. The shift to bulk emulsions and pump trucks boosts efficiency by enabling on-site mixing and tailored explosive energy. Automation and digital monitoring improve consistency and reduce workforce risk in hazardous areas. As mines move deeper and rock hardness increases, advanced blasting systems become essential, pushing market growth.
Key Trends & Opportunities
Shift Toward Bulk Explosives and On-Site Delivery Systems
Bulk explosives gain traction as mining firms prioritize efficiency, safety, and lower operational costs. On-site delivery trucks mix and pump emulsions directly into blast holes, reducing manual handling and improving energy customization. This supports better fragmentation and shorter blasting cycles. The trend creates opportunities for suppliers offering mobile manufacturing units and automated loading systems. The rise of large open-pit mines in Latin America, Africa, and Australia further accelerates bulk explosive consumption. Companies investing in modular plants, pump trucks, and integrated blast management solutions stand to benefit from this shift.
- For instance, Orica’s “Bulk Systems” integrate manufacturing, logistics, and delivery enabling delivery of hundreds of tonnes of bulk explosive per shift directly to blastholes via pump trucks.
Growing Integration of Digital and Remote Blasting Technologies
Digital blasting tools create new opportunities as operators adopt electronic detonators, remote initiation, and cloud-based blast design platforms. Drone imaging and 3D mapping provide accurate geology insights, allowing precise charge placement. Remote firing improves worker safety by distancing teams from blast zones. Smart detonators reduce misfires and improve sequence timing, enhancing blast outcomes. As sustainability standards rise, digital systems help track vibration, noise, and gas emissions, supporting regulatory compliance. Companies developing advanced data analytics, AI-based blast modeling, and integrated IoT systems gain a competitive edge.
Increasing Demand for Environmentally Safer Explosive Solutions
Environmental concerns create opportunities for low-toxicity, water-resistant, and low-emission explosives. Mines adopt greener emulsions with reduced harmful gases and biodegradable additives to meet stricter air and water quality standards. Controlled blasting techniques lower fly-rock, vibration, and overbreak, helping contractors adhere to safety rules near cities and sensitive zones. Governments push for reduced ANFO usage due to nitrate leaching risks, leading to rising adoption of safer alternatives. Suppliers offering eco-efficient products, recycling systems, and cleaner detonation methods gain long-term growth opportunities.
Key Challenges
Stringent Environmental and Safety Regulations
The industrial explosives market faces strict rules governing storage, transportation, and usage. Governments impose tight controls due to risks related to accidental blasts, toxic fumes, and contamination. Compliance increases costs as firms invest in secure storage, licensed transport fleets, and trained personnel. Meeting vibration limits near urban or sensitive sites limits blasting intensity, slowing project timelines. Environmental concerns over nitrate pollution push restrictions on common explosives, requiring costly shifts to new formulas. These regulations create operational challenges for suppliers and end users.
Supply Chain Disruptions and Raw Material Constraints
Industrial explosives depend on key raw materials such as ammonium nitrate, fuel oil, and specialty chemicals. Price fluctuations and shortages disrupt production, especially during geopolitical tensions or trade restrictions. Limited global supply of ammonium nitrate impacts ANFO and emulsion manufacturing. Transportation constraints, port delays, and hazardous-material regulations add further pressure to supply chains. Mines and construction firms face delays when explosive deliveries are constrained, affecting productivity. Maintaining stable supply becomes a challenge, pushing companies to diversify sourcing, build local plants, and strengthen inventory systems.
Regional Analysis
North America
North America held about 23% share in 2024, driven by steady demand from metal mining, quarrying, and large construction projects. The United States expanded consumption due to rising production of aggregates, copper, and industrial minerals used in infrastructure and manufacturing. Canada contributed through strong gold and potash mining, which relied on high-energy explosives for deeper rock extraction. Strict safety rules encouraged adoption of electronic detonators and controlled blasting systems. Growing investment in underground mines and expansion of renewable energy infrastructure, including hydropower tunneling, supported consistent use of bulk emulsions and advanced blast optimization tools.
Europe
Europe accounted for nearly 19% share in 2024, supported by controlled but stable demand from quarrying, tunneling, and mining activities. Countries such as Germany, Poland, and Sweden used explosives extensively in aggregates production, coal extraction, and metal mining. Large transportation projects, including high-speed rail, road tunnels, and metro expansions, boosted consumption of precision blasting tools. The region emphasized environmental compliance, pushing operators toward low-emission emulsions and digital detonation technologies. Strict handling and storage regulations increased reliance on certified suppliers, while investment in sustainable construction and renewable energy supported moderate but steady market growth across Europe.
Asia-Pacific
Asia-Pacific dominated the global market with about 47% share in 2024, driven by large-scale mining in China, India, Indonesia, and Australia. Rising coal, iron ore, limestone, and bauxite extraction supported high consumption of bulk explosives and blasting agents. Infrastructure megaprojects, including highways, metros, and industrial corridors, increased demand for construction blasting. Australia strengthened market growth through iron ore expansion and widespread use of electronic detonators. Rapid urbanization and quarrying activities across Southeast Asia also boosted explosive usage. The region’s strong production base, lower operating costs, and increasing adoption of bulk delivery systems kept Asia-Pacific in the leading position.
Latin America
Latin America captured around 7% share in 2024, supported by significant mining output across Chile, Peru, Brazil, and Mexico. Copper, gold, and lithium extraction drove steady consumption of high-energy explosives, especially in open-pit and underground sites. Regional operators increasingly adopted bulk emulsions and on-site delivery trucks to optimize fragmentation and reduce blast cycle time. Infrastructure upgrades and quarrying activities contributed further demand. However, regulatory delays and permitting issues in some countries slowed project timelines. Despite this, strong mineral reserves and expanding exploration projects kept Latin America an important and growing market for industrial explosives suppliers.
Middle East & Africa
Middle East & Africa held nearly 14% share in 2024, driven by strong mining activity in South Africa, Botswana, Namibia, and Saudi Arabia. Gold, platinum, diamond, and phosphate mining accounted for a major share of explosive consumption. Construction of new highways, metro lines, and industrial zones in the Gulf countries supported additional demand. Africa saw rising adoption of bulk explosives and mobile manufacturing units to support deep mines and remote operations. Regulatory variations and logistical challenges limited faster growth. Still, expanding mineral exploration and government-led infrastructure programs ensured stable and rising demand across the region.
Market Segmentations:
By Type
- High Explosives
- Blasting Agents
By Application
- Mining
- Quarrying
- Construction and Demolition
- Manufacturing
- Firefighting
- Pyrotechnics (Fireworks)
- Logging
- Agriculture
- Medical
By End Use
- Mining
- Construction
- Others
By Geography
- North America
- Europe
- Germany
- France
- U.K.
- Italy
- Spain
- Rest of Europe
- Asia Pacific
- China
- Japan
- India
- South Korea
- South-east Asia
- Rest of Asia Pacific
- Latin America
- Brazil
- Argentina
- Rest of Latin America
- Middle East & Africa
- GCC Countries
- South Africa
- Rest of the Middle East and Africa
Competitive Landscape
The competitive landscape of the industrial explosives market features leading players such as Orica Ltd., Maxam Corp., AECI Ltd., Austin Powder Company, EPC Groupe Inc., NOF Corporation, Keltech Energies Ltd., Tec Pivot Limited, and Irish Industrial Explosives Ltd., all expanding capabilities to serve mining, quarrying, and construction sectors. Companies invest in advanced electronic detonators, bulk emulsion plants, and mobile manufacturing units to enhance precision and safety in blasting operations. Strategic partnerships with mining firms strengthen long-term supply contracts, while acquisitions help expand regional presence and product portfolios. Digital blasting tools, remote initiation systems, and automated loading technologies improve operational efficiency and differentiate offerings. Sustainability initiatives grow as firms adopt low-emission formulations, reduce nitrate pollution, and integrate environmentally safer blasting solutions. Continuous innovation, strong distribution networks, and compliance with strict regulatory standards remain core factors shaping competitive performance across global markets.
Shape Your Report to Specific Countries or Regions & Enjoy 30% Off!
Key Player Analysis
- Maxam Corp.
- Irish Industrial Explosives Ltd.
- AECI Ltd.
- Orica Ltd.
- Tec Pivot Limited
- Keltech Energies Ltd.
- NOF Corporation
- Austin Powder Company
- EPC Groupe Inc.
Recent Developments
- In 2025, AECI Mining showcased a major technical development at EFEE (European Forum for Explosives Engineers) in November 2025 public coverage highlighted work on TNT-free explosive formulations and a move to reduce dependence on legacy energetic ingredients (aiming to lower operational risk and improve sustainability/resilience of supply chains).
- In September 2025, EPC Groupe reported that its subsidiary EPC Côte d’Ivoire signed a 5-year strategic contract with Montage Gold to supply explosives and mining services for the Koné gold project in Ivory Coast, strengthening the group’s position in the global industrial explosives market after its recent acquisitions in Spain, Australia, and Brazil.
- In July 2024, Austin Powder announced that American Industrial Partners made a strategic investment in the company to accelerate growth, support innovation in explosive products, and back expansion of its industrial explosives and engineered blasting solutions in key mining and construction markets.
Report Coverage
The research report offers an in-depth analysis based on Type, Application, End Use and Geography. It details leading market players, providing an overview of their business, product offerings, investments, revenue streams, and key applications. Additionally, the report includes insights into the competitive environment, SWOT analysis, current market trends, as well as the primary drivers and constraints. Furthermore, it discusses various factors that have driven market expansion in recent years. The report also explores market dynamics, regulatory scenarios, and technological advancements that are shaping the industry. It assesses the impact of external factors and global economic changes on market growth. Lastly, it provides strategic recommendations for new entrants and established companies to navigate the complexities of the market.
Future Outlook
- Demand will rise as mining companies expand deeper and harder rock extraction.
- Bulk emulsions and on-site delivery systems will gain stronger adoption.
- Electronic detonators will replace conventional systems across major operations.
- Digital blast modeling and AI-driven optimization will improve fragmentation quality.
- Environmental rules will push development of low-emission and safer explosive formulations.
- Automation and remote blasting will reduce workforce exposure in hazardous zones.
- Infrastructure megaprojects will increase explosive consumption in tunneling and quarrying.
- Suppliers will expand mobile manufacturing units to serve remote mining regions.
- Strategic partnerships between explosive manufacturers and mining firms will strengthen long-term supply.
- Emerging markets in Africa and Latin America will become key growth clusters.


