Market Overview
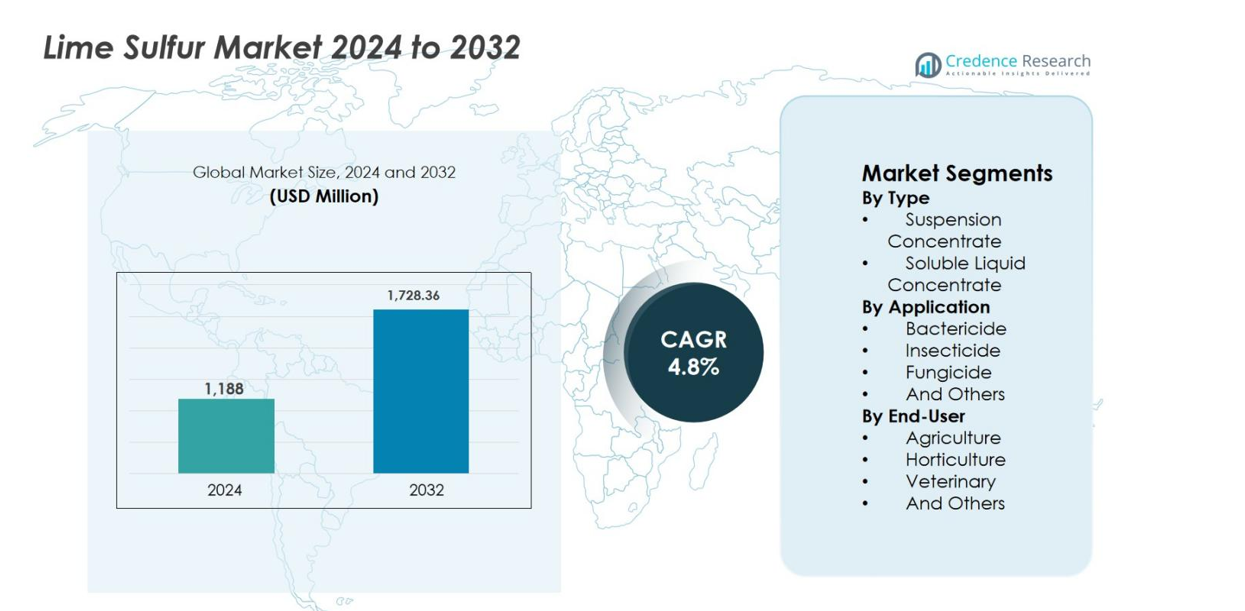
The Lime Sulfur market size was valued at USD 1,188 million in 2024 and is anticipated to reach USD 1,728.36 million by 2032, growing at a CAGR of 4.8% during the forecast period.
| REPORT ATTRIBUTE |
DETAILS |
| Historical Period |
2020-2023 |
| Base Year |
2024 |
| Forecast Period |
2025-2032 |
| Lime Sulfur Market Size 2024 |
USD 1,188 million |
| Lime Sulfur Market, CAGR |
4.8% |
| Lime Sulfur Market Size 2032 |
USD 1,728.36 million |
Lime Sulfur market is characterized by the presence of established agrochemical and specialty input providers focusing on crop protection and organic farming solutions. Key players operating in the market include Tessenderlo Kerley Inc., Novasource Tessenderlo Group, Biofa AG, Miller Chemical and Fertilizer LLC, Or-Cal Inc., and North Country Organics, each offering lime sulfur formulations for agricultural, horticultural, and specialty crop applications. These companies compete through formulation quality, regulatory compliance, and strong distributor networks. Regionally, North America leads the Lime Sulfur market with an exact market share of 32.4%, supported by high adoption in orchards, vineyards, and organic farming systems. Europe follows with 27.1%, driven by stringent environmental regulations and widespread use in sustainable agriculture, while Asia-Pacific holds 24.6%, supported by expanding agricultural activity and cost-effective crop protection demand.
Market Insights
- Lime Sulfur market was valued at USD 1,188 million in 2024 and is projected to grow at a CAGR of 4.8% through 2032, driven by steady demand across agricultural and horticultural applications.
- Market growth is primarily driven by rising adoption of organic and sustainable farming practices, increasing fungal disease incidence, and the cost-effective, broad-spectrum fungicidal and insecticidal properties of lime sulfur, making it suitable for integrated pest management programs.
- Key market trends include growing use in high-value crops such as fruits and vegetables, rising preference for suspension concentrate formulations holding about 58.6% segment share, and increasing demand for residue-free crop protection solutions in export-oriented agriculture.
- The competitive landscape features established players such as Tessenderlo Kerley Inc., Novasource Tessenderlo Group, Biofa AG, Miller Chemical and Fertilizer LLC, Or-Cal Inc., and North Country Organics, competing on formulation quality, regulatory compliance, and regional distribution strength.
- Regionally, North America leads with 32.4% market share, followed by Europe at 27.1% and Asia-Pacific at 24.6%, while Latin America and the Middle East & Africa together account for the remaining share, supported by expanding horticulture and sustainable farming adoption.
Access crucial information at unmatched prices!
Request your sample report today & start making informed decisions powered by Credence Research Inc.!
Download Sample
Market Segmentation Analysis:
By Type
By type, the Lime Sulfur market is led by the Suspension Concentrate segment, which accounted for 58.6% of the market share in 2024. Suspension concentrates are widely preferred due to their superior stability, uniform dispersion, and ease of application across diverse crop protection practices. These formulations ensure consistent sulfur availability, enhancing efficacy against pests and diseases while minimizing clogging issues during spraying. Growing adoption of modern spraying equipment, combined with increasing demand for user-friendly and storage-stable formulations, continues to support the dominance of suspension concentrates over soluble liquid concentrates in commercial and small-scale agricultural operations.
- For instance, Or-Cal Inc.’s Rex Lime Sulfur Solution contains 28 % calcium polysulfide and is marketed as a multifunctional fungicide, insecticide, and miticide that integrates well with standard spraying systems in orchards and vineyards.
By Application
By application, the Fungicide segment dominated the Lime Sulfur market with an estimated 46.9% share in 2024, driven by rising incidence of fungal diseases in fruits, vegetables, and specialty crops. Lime sulfur’s proven effectiveness against powdery mildew, scab, rust, and other fungal infections makes it a preferred choice in both conventional and organic farming systems. Increasing emphasis on residue-free crop protection and regulatory restrictions on synthetic fungicides further strengthen demand. The bactericide and insecticide segments also contribute steadily, supported by lime sulfur’s multi-functional pest and disease control properties.
- For instance, Biofa AG’s Kalkschwefellösung is approved for organic farming in Europe and is extensively used as a dormant fungicide spray in orchards to suppress apple scab and powdery mildew, as documented in EU organic crop protection guidelines.
By End-User
By end-user, the Agriculture segment held the largest share of about 63.4% in 2024, supported by extensive use of lime sulfur in field crops, orchards, and large-scale farming operations. Farmers increasingly adopt lime sulfur due to its cost-effectiveness, broad-spectrum activity, and compatibility with integrated pest management practices. Rising global food demand and growing adoption of sustainable crop protection solutions further drive agricultural usage. The horticulture segment follows, benefiting from high-value crop protection needs, while veterinary and other applications maintain niche but stable demand.
Key Growth Drivers
Rising Adoption of Organic and Sustainable Farming Practices
The increasing adoption of organic and sustainable farming practices is a major driver of the Lime Sulfur market. Growers are actively replacing synthetic pesticides with natural and environmentally acceptable alternatives to meet organic certification standards and tightening regulatory requirements. Lime sulfur, derived from sulfur and lime, supports residue-free crop production while delivering effective control of fungal diseases, insects, and mites. Rising consumer preference for organic fruits and vegetables further accelerates its use, particularly in orchard and vineyard crops. Its compatibility with integrated pest management programs and minimal long-term soil impact strengthen adoption across commercial agriculture.
- For instance, USDA National Organic Program guidance permits lime sulfur for disease and pest control in organic systems, and extension programs routinely recommend it for integrated pest management in apples, grapes, and stone fruits.
Increasing Incidence of Crop Diseases and Pest Pressure
Rising crop disease prevalence and pest pressure continue to fuel growth in the Lime Sulfur market. Climate change, increased humidity, and shifting weather patterns promote fungal infections and insect infestations across key farming regions. Lime sulfur provides broad-spectrum protection, making it highly effective during dormant spraying and early growth stages. Farmers increasingly rely on lime sulfur to manage resistant pathogens that show reduced response to conventional chemical treatments. As yield protection becomes critical for farm profitability, demand for reliable and proven crop protection solutions such as lime sulfur remains strong.
- For instance, European extension services and organic farming manuals reference lime sulfur for managing fungal disease pressure intensified by mild winters, particularly in vineyards where early-season disease suppression is critical to protecting yields.
Cost-Effectiveness and Broad-Spectrum Utility
Cost-effectiveness combined with multi-functional performance significantly drives demand in the Lime Sulfur market. Lime sulfur offers fungicidal, insecticidal, and bactericidal action at a lower cost compared to many modern synthetic products. This reduces the need for multiple specialized crop protection inputs, helping farmers control overall production costs. Small and medium-scale growers benefit particularly from its affordability and established efficacy. Its compatibility with standard application equipment and long shelf life further support widespread use, especially in cost-sensitive agricultural markets.
Key Trends & Opportunities
Expansion of Horticulture and High-Value Crop Cultivation
The expansion of horticulture and high-value crop production creates strong growth opportunities in the Lime Sulfur market. Fruits, vegetables, and ornamental plants are highly vulnerable to fungal diseases and pests, increasing reliance on preventive treatments. Lime sulfur is widely used in orchards, vineyards, and nurseries due to its proven effectiveness during dormant and early-season applications. Growing export-oriented horticulture production also favors lime sulfur, as residue compliance is critical for international trade. These trends encourage manufacturers to focus on crop-specific formulations and targeted usage guidelines.
- For instance, commercial nurseries and ornamental producers use lime sulfur during dormant periods to control fungal inoculum in roses and deciduous ornamentals, supporting plant health while meeting residue requirements for international plant trade.
Product Innovation and Improved Formulations
Product innovation and formulation advancements represent an important trend in the Lime Sulfur market. Manufacturers are investing in stabilized suspension concentrates and safer formulations that improve handling, reduce odor, and lower phytotoxicity risks. Improved formulations enhance application efficiency and compatibility with modern spraying technologies. Innovation also enables better integration with precision agriculture and integrated pest management programs. These developments help overcome traditional limitations of lime sulfur, expanding its acceptance among commercial growers and supporting long-term market growth.
- For instance, Lime-Sulfur Solution™ is OMRI-approved for organic crop protection and, in certain U.S. states like Washington, is labeled for apple thinning and disease control, demonstrating innovation in expanding use cases and regulatory positioning for modern production needs.
Key Challenges
Handling, Storage, and Safety Concerns
Handling and safety issues present a major challenge for the Lime Sulfur market. Lime sulfur is corrosive and emits a strong odor, requiring strict handling procedures and protective equipment. Improper application can result in crop damage or health risks to applicators, limiting adoption in regions with limited technical knowledge. Regulatory compliance requirements related to labeling, storage, and transportation add operational complexity. These factors can discourage new users, particularly small-scale farmers, highlighting the need for improved formulations and training initiatives.
Competition from Alternative Crop Protection Products
The Lime Sulfur market faces growing competition from synthetic pesticides, biologicals, and advanced crop protection solutions. Many alternatives offer targeted action, lower application rates, and improved user convenience. Biological and bio-based products, in particular, benefit from strong regulatory support and sustainability positioning. As these alternatives continue to evolve, some growers may shift away from lime sulfur for specific applications. To remain competitive, lime sulfur producers must emphasize cost advantages, broad-spectrum functionality, and ongoing product improvements within integrated pest management frameworks.
Regional Analysis
North America
North America accounted for 32.4% of the Lime Sulfur market share in 2024, driven by strong adoption in commercial agriculture, orchards, and organic farming systems. The region benefits from well-established fruit and vegetable production, particularly apples, grapes, and citrus, where lime sulfur is widely used for dormant spraying and disease control. Stringent regulations on synthetic pesticides and growing consumer demand for organic produce further support market growth. The presence of advanced farming practices, high awareness of integrated pest management, and consistent demand from the horticulture sector reinforce North America’s leading position.
Europe
Europe held 27.1% of the Lime Sulfur market share in 2024, supported by strict environmental regulations and a strong shift toward sustainable agriculture. The region actively promotes reduced chemical pesticide usage, creating favorable conditions for traditional and mineral-based crop protection products such as lime sulfur. High adoption across vineyards, orchards, and organic farms in countries such as France, Italy, and Spain drives steady demand. The growing organic food market and emphasis on residue-free exports further strengthen usage. Regulatory alignment with eco-friendly inputs continues to sustain long-term growth across Western and Southern Europe.
Asia-Pacific
Asia-Pacific captured 24.6% of the Lime Sulfur market share in 2024, driven by expanding agricultural activity and rising food demand. Large-scale fruit and vegetable production in China, India, and Southeast Asia supports consistent consumption of lime sulfur for disease and pest control. Increasing awareness of sustainable farming, coupled with government initiatives promoting reduced chemical inputs, accelerates adoption. Cost-effectiveness and broad-spectrum utility make lime sulfur attractive to small and medium-scale farmers across the region. Rapid growth in horticulture and export-oriented agriculture positions Asia-Pacific as the fastest-growing regional market.
Latin America
Latin America represented about 9.3% of the Lime Sulfur market share in 2024, supported by growing fruit, coffee, and vegetable cultivation. Countries such as Brazil, Chile, and Argentina increasingly use lime sulfur in orchards and vineyards to manage fungal diseases and pests. Expansion of export-focused agriculture drives demand for compliant and residue-controlled crop protection solutions. Favorable climatic conditions that encourage disease pressure further support usage. While adoption remains moderate compared to developed regions, increasing investment in sustainable farming practices and technical training continues to improve market penetration.
Middle East & Africa
The Middle East & Africa accounted for 6.6% of the Lime Sulfur market share in 2024, reflecting gradual but steady adoption. The market is driven by growing horticulture activities, particularly in greenhouse farming and orchard cultivation. Lime sulfur is increasingly used to manage fungal diseases under arid and semi-arid conditions where pest pressure can be high. Limited awareness and handling concerns restrict rapid adoption; however, government initiatives supporting food security and modern agricultural practices are improving demand. Expansion of commercial farming and rising focus on sustainable inputs support future growth across the region.
Market Segmentations:
By Type
- Suspension Concentrate
- Soluble Liquid Concentrate
By Application
- Bactericide
- Insecticide
- Fungicide
- And Others
By End-User
- Agriculture
- Horticulture
- Veterinary
- And Others
By Geography
- North America
- Europe
- Germany
- France
- U.K.
- Italy
- Spain
- Rest of Europe
- Asia Pacific
- China
- Japan
- India
- South Korea
- South-east Asia
- Rest of Asia Pacific
- Latin America
- Brazil
- Argentina
- Rest of Latin America
- Middle East & Africa
- GCC Countries
- South Africa
- Rest of the Middle East and Africa
Competitive Landscape
The competitive landscape of the Lime Sulfur market is moderately consolidated, with a mix of global agrochemical companies and regional suppliers competing on product quality, formulation stability, and distribution reach. Key players such as Tessenderlo Kerley Inc., Novasource Tessenderlo Group, Biofa AG, Miller Chemical and Fertilizer LLC, Or-Cal Inc., and North Country Organics focus on expanding their presence in agricultural and horticultural applications. Companies increasingly invest in improved suspension concentrate formulations to enhance safety, ease of handling, and application efficiency. Strategic partnerships with distributors and agricultural cooperatives help strengthen regional penetration, particularly in organic and specialty crop markets. Players also emphasize compliance with organic farming standards and regulatory requirements to maintain market credibility. Continuous product optimization, customer education, and technical support remain critical competitive factors as manufacturers aim to differentiate offerings and secure long-term relationships with growers.
Shape Your Report to Specific Countries or Regions & Enjoy 30% Off!
Key Player Analysis
- Biofa AG
- Novasource Tessenderlo Group
- Miller Chemical and Fertilizer LLC.
- Or-Cal Inc.
- Tessenderlo Kerley Inc.
- North Country Organics
- Gowan Company
- Helena Agri-Enterprises
- Nufarm Limited
- Certis Biologicals
Recent Developments
- In October 2025, Tessenderlo Kerley Inc. acquired Eastman’s U.S. & Canadian crop protection metam sodium and metam potassium product labels, expanding its crop protection offerings
- In 2025, Brandt® updated its Lime Sulfur product label and application guidance, indicating continued commercialization and availability of its lime sulfur formulations for horticulture and specialty crop disease management
- In November 2024, Tessenderlo Kerley, Inc. acquired Tiger-Sul Products, LLC, a North American provider of sulfur-based fertilizer products, broadening its crop nutrition and sulfur product portfolio
Report Coverage
The research report offers an in-depth analysis based on Type, Application, End-User and Geography. It details leading market players, providing an overview of their business, product offerings, investments, revenue streams, and key applications. Additionally, the report includes insights into the competitive environment, SWOT analysis, current market trends, as well as the primary drivers and constraints. Furthermore, it discusses various factors that have driven market expansion in recent years. The report also explores market dynamics, regulatory scenarios, and technological advancements that are shaping the industry. It assesses the impact of external factors and global economic changes on market growth. Lastly, it provides strategic recommendations for new entrants and established companies to navigate the complexities of the market.
Future Outlook
- Lime sulfur demand will continue to benefit from the global shift toward sustainable and organic agricultural practices.
- Adoption across horticulture and high-value fruit crops will expand due to rising disease pressure and residue compliance needs.
- Suspension concentrate formulations will gain wider acceptance as users prioritize stability, safety, and ease of application.
- Integration of lime sulfur into integrated pest management programs will strengthen its long-term relevance.
- Regulatory restrictions on synthetic pesticides will support sustained usage in conventional and organic farming systems.
- Product innovation will focus on reducing odor, improving handling safety, and minimizing phytotoxicity risks.
- Emerging markets in Asia-Pacific and Latin America will experience faster adoption driven by expanding agricultural output.
- Demand from export-oriented agriculture will grow as growers seek compliant and multi-functional crop protection inputs.
- Competitive intensity will increase as suppliers emphasize formulation improvements and distributor partnerships.
- Training initiatives and technical support will play a critical role in improving adoption and correct usage among farmers.


