Market Overview
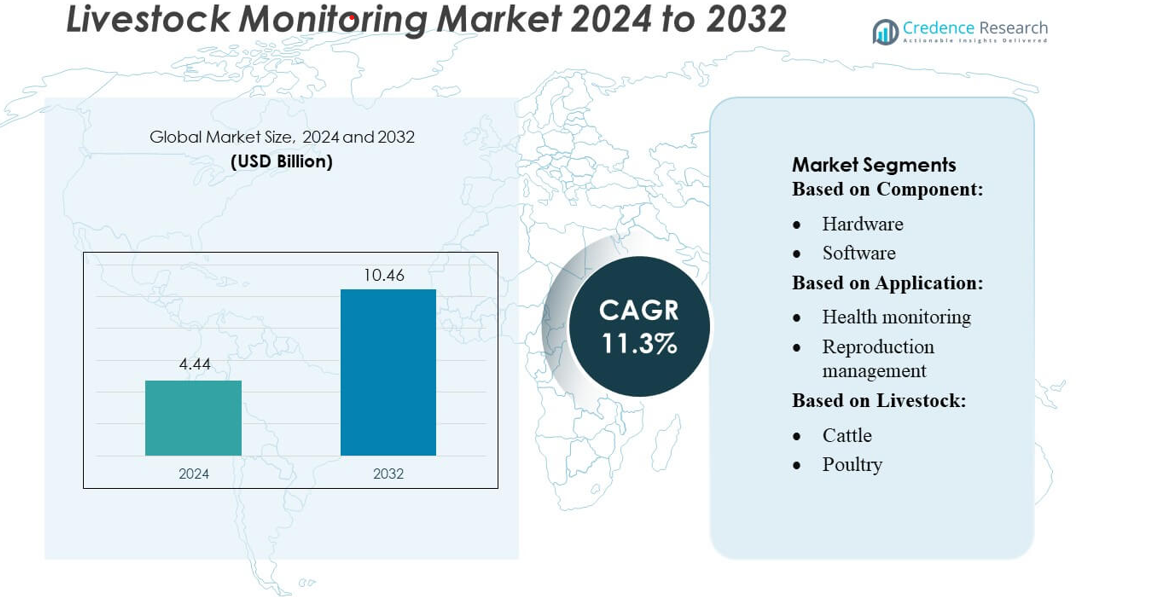
Livestock Monitoring Market size was valued USD 4.44 billion in 2024 and is anticipated to reach USD 10.46 billion by 2032, at a CAGR of 11.3% during the forecast period.
| REPORT ATTRIBUTE |
DETAILS |
| Historical Period |
2020-2023 |
| Base Year |
2024 |
| Forecast Period |
2025-2032 |
| Livestock Monitoring Market Size 2024 |
USD 4.44 billion |
| Livestock Monitoring Market, CAGR |
11.3% |
| Livestock Monitoring Market Size 2032 |
USD 10.46 billion |
The Livestock Monitoring Market is highly competitive, with key players including Splunk Inc., Google LLC, Dynatrace, Inc., Cisco Systems, Inc., Riverbed Technology LLC, Amazon Web Services, Inc., IBM Corporation, Microsoft, NETSCOUT Systems, Inc., and New Relic, Inc. These companies are driving market growth through innovations in IoT-enabled sensors, wearable devices, cloud-based analytics, and AI-powered monitoring platforms, enabling real-time insights into animal health, feeding, reproduction, and behavior. North America leads the market, accounting for approximately 35% of the global share, driven by advanced precision livestock farming practices, strong technological infrastructure, and high adoption of digital solutions. The region’s focus on improving operational efficiency, enhancing animal welfare, and complying with regulatory standards positions it as the dominant market, while ongoing investments in technology and strategic collaborations among top players further strengthen competitive dynamics globally.
Market Insights
- The Livestock Monitoring Market size was valued at USD 4.44 billion in 2024 and is expected to reach USD 10.46 billion by 2032, growing at a CAGR of 11.3% during the forecast period.
- Market growth is driven by increasing adoption of IoT-enabled sensors, wearable devices, and AI-powered monitoring platforms that enhance health, feeding, reproduction, and behavior management across livestock operations.
- Key trends include integration of cloud-based analytics, predictive monitoring, and remote farm management solutions, enabling real-time insights and operational efficiency.
- North America leads the market with approximately 35% share due to advanced precision livestock farming, while Europe and Asia-Pacific show steady growth; hardware solutions dominate the component segment, and health monitoring leads applications.
- The market faces challenges from high initial investment costs and data management complexities, while competitive dynamics are strengthened by strategic collaborations, technological innovations, and expansion initiatives by major global players.
Access crucial information at unmatched prices!
Request your sample report today & start making informed decisions powered by Credence Research Inc.!
Download Sample
Market Segmentation Analysis:
By Component
The hardware segment dominates the Livestock Monitoring Market, capturing the largest market share due to its essential role in enabling real-time data collection through sensors, collars, and wearable devices. Hardware adoption is driven by the growing need for precision livestock farming and automation, which enhances operational efficiency and reduces manual labor. Software and services are witnessing steady growth as complementary solutions for data analysis, alerts, and predictive insights, but hardware remains the primary revenue generator, accounting for over half of the market share, driven by continuous innovation in IoT-enabled monitoring devices.
- For instance, Dynatrace reports that over 1,000 customers are actively using its log‑analytics solution, and in the past year, more than half of all newly onboarded customers adopted that solution.
By Application
Health monitoring leads the application segment, reflecting its critical importance in preventing diseases, optimizing vaccination schedules, and improving overall livestock productivity. Feeding management and reproduction management are also significant, supporting precision nutrition and breeding efficiency. The dominance of health monitoring, representing the largest share, is driven by increasing awareness of animal welfare, regulatory compliance, and the economic benefits of reducing morbidity and mortality rates. Behavioral monitoring and milk harvesting management contribute to operational efficiency but remain secondary in adoption compared to health-focused applications.
- For instance, Cisco worked with partners to implement environmental sensors tracking temperature, humidity, CO₂, and motion for 2,650 cows; this installation enabled real‑time alerts based on a Farm‑wide Temperature–Humidity Index (THI), which helped reduce infection incidences among cows by 10%.
By Livestock
Cattle constitute the dominant livestock sub-segment, holding the largest market share due to the high economic value of dairy and beef production and the extensive use of monitoring solutions for health, feeding, and reproduction management. Poultry and swine segments are growing steadily with the adoption of automated feeding and disease surveillance systems, while equine and other livestock remain niche but show potential in specialized monitoring solutions. Cattle market growth is driven by rising demand for milk and meat, stricter quality control standards, and increasing investments in precision livestock farming technologies.
Key Growth Drivers
Rising Adoption of Precision Livestock Farming
The increasing adoption of precision livestock farming drives market growth by enabling farmers to monitor animal health, feeding patterns, and reproductive cycles in real time. IoT-enabled sensors, wearable devices, and automated systems reduce manual labor and operational costs while enhancing productivity. This trend is particularly strong in dairy and cattle farming, where real-time monitoring ensures higher milk yields and better disease management, making precision livestock farming a primary growth driver across both developed and emerging markets.
- For instance, Riverbed in 2025 rolled out its next‑generation AI‑powered observability platform that processed over 64 million automated investigations and remediations in the previous year, underscoring its scalability for high‑volume sensor networks.
Technological Advancements in Monitoring Solutions
Continuous innovation in hardware, software, and AI-based analytics fuels the expansion of the livestock monitoring market. Advanced sensors, wearable devices, and cloud-based platforms provide actionable insights on health, behavior, and productivity. Integration of machine learning and predictive analytics enables early disease detection, feed optimization, and reproductive management, improving overall farm efficiency. These technological advancements increase the reliability, accuracy, and scalability of monitoring solutions, encouraging adoption among large-scale farms and commercial livestock operations globally.
- For instance, Azure FarmBeats supports integrating data from “over 100 different sensors” on a farm (soil moisture, temperature, humidity, ambient light, etc.), along with drone and camera imagery, enabling detailed environmental and potentially animal‑health tracking at scale.
Growing Demand for Animal Welfare and Food Safety
Rising consumer awareness regarding animal welfare and safe, high-quality livestock products drives investment in monitoring solutions. Regulatory requirements for health tracking and welfare compliance compel farmers to adopt real-time monitoring systems. Enhanced traceability and transparent reporting improve market trust and reduce losses due to disease outbreaks. This growing emphasis on ethical and safe livestock production supports the expansion of health monitoring and behavioral tracking applications, making animal welfare and food safety a strong growth driver across the industry.
Key Trends & Opportunities
Integration of IoT and AI Technologies
The integration of IoT devices with AI analytics is transforming livestock monitoring by enabling predictive insights and automated decision-making. Farmers can optimize feeding, breeding, and health management with minimal manual intervention. Cloud connectivity and mobile applications offer remote monitoring, increasing efficiency and reducing operational costs. This trend opens opportunities for solution providers to offer scalable, data-driven platforms that cater to diverse livestock operations, from small farms to industrial-scale facilities, creating potential for long-term market growth.
- For instance, New Relic’s intelligent observability platform has recently added over 20 new features in one year, extending its capabilities in AI‑driven telemetry, real‑time alerting, and analytics across metrics, events, logs, and traces.
Expansion of Emerging Markets
Emerging markets in Asia-Pacific, Latin America, and Africa offer significant opportunities due to rising livestock production and modernization of farms. Governments are promoting precision farming initiatives and providing subsidies for technology adoption. Small and medium-scale farmers increasingly seek affordable monitoring solutions to improve productivity and reduce losses. This growth potential presents opportunities for market players to expand geographically, tailor products for cost-sensitive regions, and introduce training and support services to accelerate adoption across these high-growth areas.
- For instance, Cisco worked with partners to implement environmental sensors tracking temperature, humidity, CO₂, and motion for 2,650 cows; this installation enabled real‑time alerts based on a Farm‑wide Temperature–Humidity Index (THI), which helped reduce infection incidences among cows by 10%.
Increasing Focus on Sustainability
Sustainability-focused farming practices are creating opportunities for livestock monitoring solutions that reduce environmental impact. Optimized feed management, disease prevention, and improved reproductive efficiency lower greenhouse gas emissions and resource consumption. Monitoring solutions help farms meet regulatory sustainability requirements and meet the growing demand for eco-friendly livestock products. This trend encourages adoption of smart technologies, positioning livestock monitoring as a key enabler for sustainable, efficient, and profitable animal husbandry operations.
Key Challenges
High Initial Investment Costs
The high upfront costs of hardware, software, and integration services pose a significant barrier for small and medium-scale farmers. While large commercial farms can adopt advanced monitoring solutions easily, cost-sensitive operations struggle to justify investment. Additionally, maintenance, calibration, and periodic upgrades add to the financial burden. These economic challenges limit widespread adoption, particularly in developing regions, and may slow market growth unless more affordable and scalable solutions are introduced by technology providers.
Data Management and Integration Issues
Managing large volumes of data from multiple monitoring devices and ensuring seamless integration with farm management systems remain critical challenges. Inconsistent data standards, lack of interoperability, and cybersecurity concerns hinder efficient use of analytics. Farmers may face difficulties translating raw data into actionable insights, reducing the effectiveness of monitoring solutions. Addressing these technical and operational challenges is essential for broader adoption and sustained market growth, particularly in farms seeking to leverage AI-driven analytics for precision livestock management.
Regional Analysis
North America
North America leads the Livestock Monitoring Market, holding the largest share of approximately 35%, driven by advanced livestock management practices, high adoption of IoT-enabled devices, and strong technological infrastructure. The U.S. and Canada dominate due to increasing focus on precision farming, animal welfare compliance, and demand for dairy and meat products. Rising investment in smart farming solutions, along with supportive government policies, has accelerated adoption of hardware, software, and analytics platforms. Continuous innovation in wearable devices and predictive analytics further strengthens North America’s leadership position, maintaining its dominance in livestock monitoring applications.
Europe
Europe accounts for around 28% of the livestock monitoring market, fueled by stringent regulations on animal welfare, food safety, and traceability. Countries such as Germany, France, and the Netherlands are early adopters of advanced monitoring solutions across cattle, poultry, and swine operations. The region emphasizes sustainable livestock farming practices, leading to high demand for health monitoring and feeding management systems. Growing investments in AI-based analytics and smart sensors enhance productivity while reducing environmental impact. Europe’s focus on regulatory compliance and sustainable practices positions it as a key growth region with steady adoption of livestock monitoring technologies.
Asia-Pacific
Asia-Pacific holds an estimated 22% market share and represents the fastest-growing region due to increasing modernization of livestock farms, rising meat and dairy consumption, and government initiatives promoting precision farming. Countries like China, India, and Australia are adopting IoT-enabled monitoring devices to improve productivity, reduce disease outbreaks, and optimize feeding practices. Cost-effective solutions are driving adoption among small- and medium-scale farms. The growing focus on digital agriculture, combined with rising disposable income and technological awareness, provides significant growth opportunities for livestock monitoring solution providers across the Asia-Pacific region.
Latin America
Latin America captures roughly 10% of the livestock monitoring market, supported by expanding cattle and poultry industries in Brazil, Argentina, and Mexico. Adoption is driven by the need to enhance farm efficiency, improve animal health, and comply with international food safety standards. Emerging investments in automated feeding, health monitoring, and reproductive management solutions are increasing operational efficiency. However, limited awareness and infrastructure challenges restrict faster adoption. With rising demand for high-quality meat and dairy exports, the Latin American region presents growth opportunities for livestock monitoring technology providers targeting scalable and cost-effective solutions.
Middle East & Africa
The Middle East & Africa holds about 5% of the market, with adoption primarily concentrated in large commercial farms and dairy operations. Countries like South Africa, UAE, and Saudi Arabia are integrating health monitoring, feeding management, and behavioral tracking to enhance livestock productivity. The region faces challenges such as limited technological infrastructure, high initial investment costs, and low awareness among smallholder farmers. Nevertheless, increasing government initiatives to improve food security, coupled with investments in precision livestock farming, offer growth potential. Demand for modern monitoring solutions is gradually rising as farms adopt digital solutions to improve operational efficiency and animal welfare.
Market Segmentations:
By Component:
By Application:
- Health monitoring
- Reproduction management
By Livestock:
By Geography
- North America
- Europe
- Germany
- France
- U.K.
- Italy
- Spain
- Rest of Europe
- Asia Pacific
- China
- Japan
- India
- South Korea
- South-east Asia
- Rest of Asia Pacific
- Latin America
- Brazil
- Argentina
- Rest of Latin America
- Middle East & Africa
- GCC Countries
- South Africa
- Rest of the Middle East and Africa
Competitive Landscape
The Livestock Monitoring Market include Splunk Inc., Google LLC, Dynatrace, Inc., Cisco Systems, Inc., Riverbed Technology LLC, Amazon Web Services, Inc., IBM Corporation, Microsoft, NETSCOUT Systems, Inc., and New Relic, Inc. The Livestock Monitoring Market is highly competitive, driven by continuous innovation in hardware, software, and cloud-based solutions that enhance animal health, feeding, reproduction, and behavioral management. Companies are focusing on technological advancements such as IoT-enabled sensors, AI-driven analytics, and predictive monitoring systems to improve farm productivity and operational efficiency. Strategic initiatives including product development, partnerships, and expansion into emerging markets are intensifying competition. Providers are also offering scalable and customizable platforms to cater to diverse livestock operations, from smallholder farms to large commercial enterprises. The market is characterized by rapid technological evolution, increasing demand for precision livestock farming, and a strong emphasis on animal welfare and sustainable farming practices, which collectively shape competitive dynamics and growth strategies.
Shape Your Report to Specific Countries or Regions & Enjoy 30% Off!
Key Player Analysis
- Splunk Inc.
- Google LLC
- Dynatrace, Inc.
- Cisco Systems, Inc.
- Riverbed Technology LLC
- Amazon Web Services, Inc.
- IBM Corporation
- Microsoft
- NETSCOUT Systems, Inc.
- New Relic, Inc.
Recent Developments
- In June 2025, Globalstar extended its partnership with CERES TAG to use its satellite network for livestock monitoring, which is crucial for combating the New World Screwworm. This collaboration allows for continuous connectivity, real-time data on herds, and vital biosecurity intelligence to protect livestock in remote areas where cellular service is unavailable.
- In May 2025, CERES TAG launched the next-generation CERES RANCHER device in the U.S., delivering real-time livestock intelligence with enhanced durability, accuracy, and ease of use to empower cattle producers, veterinarians, and researchers.
- In June 2024, Teledyne FLIR LLC announced the launch of the SV89 and SV88 Vibration Monitoring Solution Kits, which use wireless sensors and a gateway to continuously analyze equipment vibrations, detect faults, and provide alerts for potential issues. These kits are designed to assist in predictive maintenance by helping users monitor critical equipment, make data-driven decisions, and avoid unplanned downtime.
- In May 2024, Datadog, Inc., a company that is focused on developing the monitoring and security platform for cloud applications, revealed the launch of the IT Event Management to its suite of AIOps (artificial intelligence for information technology operations) capabilities
Report Coverage
The research report offers an in-depth analysis based on Component, Application, Livestock and Geography. It details leading market players, providing an overview of their business, product offerings, investments, revenue streams, and key applications. Additionally, the report includes insights into the competitive environment, SWOT analysis, current market trends, as well as the primary drivers and constraints. Furthermore, it discusses various factors that have driven market expansion in recent years. The report also explores market dynamics, regulatory scenarios, and technological advancements that are shaping the industry. It assesses the impact of external factors and global economic changes on market growth. Lastly, it provides strategic recommendations for new entrants and established companies to navigate the complexities of the market.
Future Outlook
- The market is expected to grow steadily due to increasing adoption of precision livestock farming technologies.
- Advanced IoT-enabled sensors and wearable devices will drive efficiency in health, feeding, and reproductive management.
- Integration of AI and predictive analytics will enable early disease detection and improved productivity.
- Rising awareness of animal welfare and regulatory compliance will support broader adoption of monitoring solutions.
- Cloud-based and mobile platforms will facilitate real-time remote livestock monitoring.
- Emerging markets will present significant growth opportunities with modernization of small and medium-scale farms.
- Demand for sustainable and resource-efficient livestock practices will encourage innovative monitoring solutions.
- Expansion of dairy, poultry, and meat industries will fuel market growth globally.
- Continuous technological advancements in software and hardware will enhance operational efficiency.
- Strategic collaborations, partnerships, and product innovations will shape competitive dynamics in the market.


