
Low Carbon Footprint Coatings Market Overview:
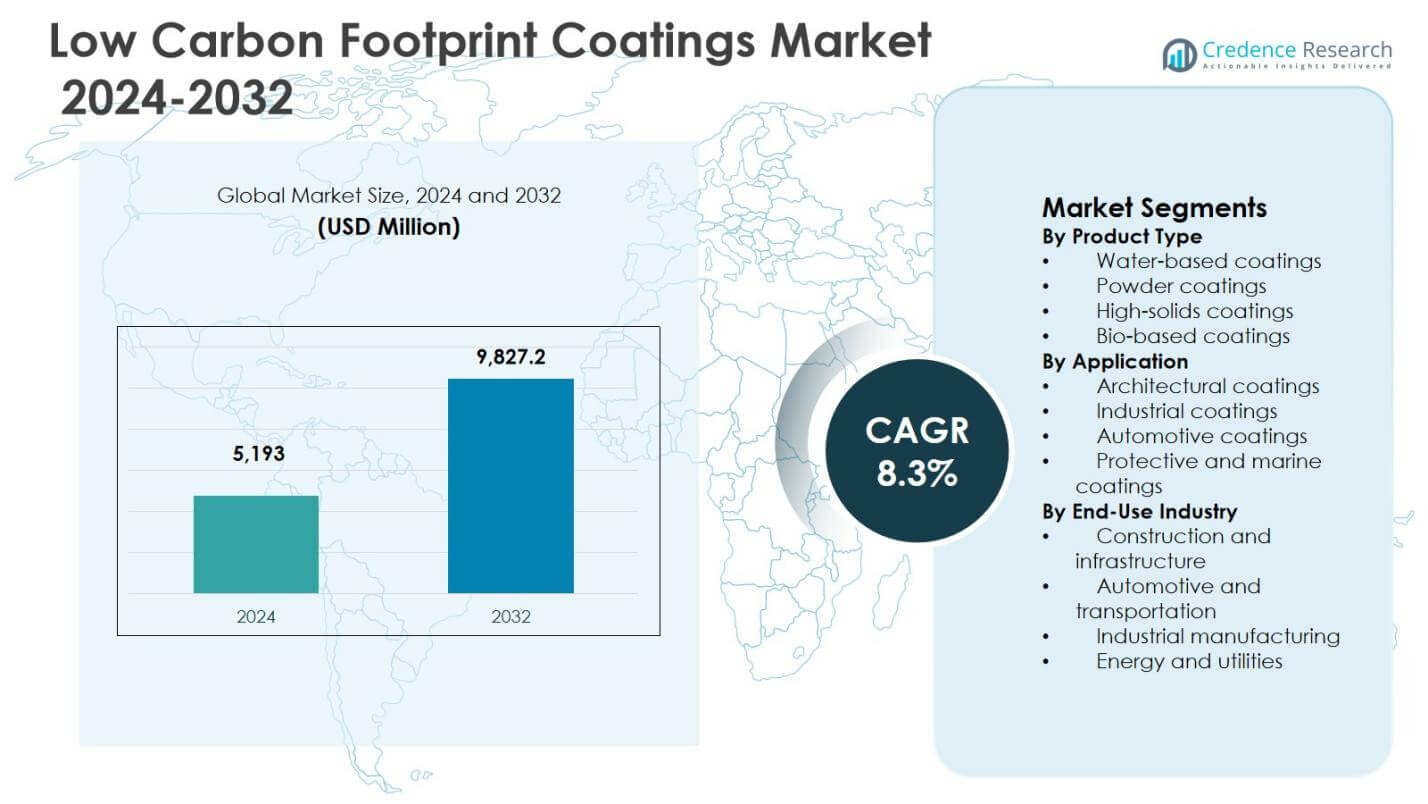
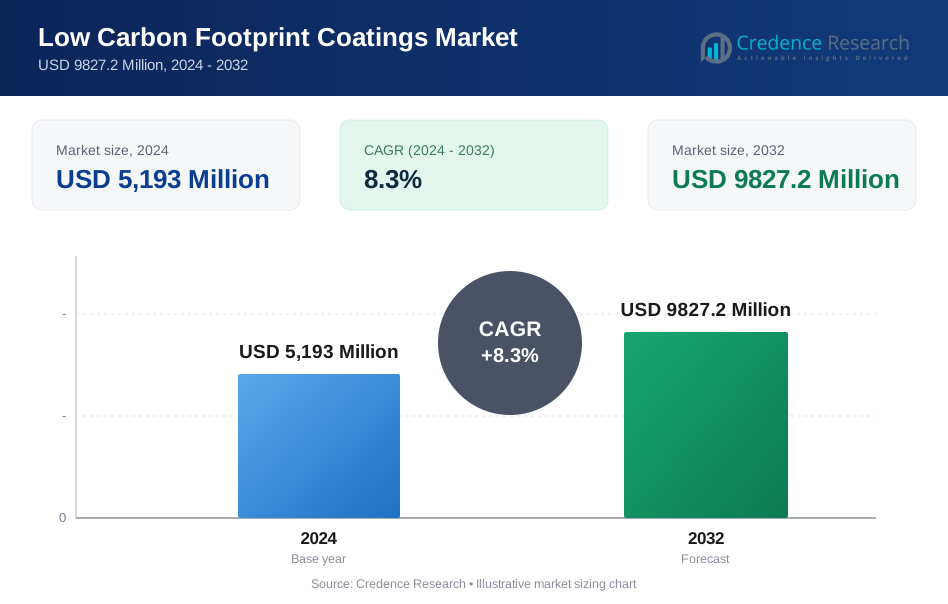
The Global Low Carbon Footprint Coatings Market size was valued at USD 5,193 Million in 2024, and is anticipated to reach USD 9827.2 Million by 2032, growing at a CAGR of 8.3% during the forecast period.
| REPORT ATTRIBUTE | DETAILS |
|---|---|
| Historical Period | 2020-2023 |
| Base Year | 2024 |
| Forecast Period | 2025-2032 |
| Low Carbon Footprint Coatings Market Size 2024 | USD 5,193 million |
| Low Carbon Footprint Coatings Market, CAGR | 8.3% |
| Low Carbon Footprint Coatings Market Size 2032 | USD 9827.2 million |
Low Carbon Footprint Coatings Market Insights
- Market growth is driven by strict VOC emission regulations, rising green building construction, sustainability mandates across automotive and industrial manufacturing, and increasing adoption of water-based coatings holding 6% segment share in 2024.
- Key trends include rising use of bio-based and renewable raw materials, expansion of powder coatings with 3% share, and technological advancements in high-solids formulations to reduce carbon intensity.
- Market restraints include higher production costs of sustainable formulations, price sensitivity in emerging economies, and performance perception challenges compared to conventional solvent-based coatings.
- Asia Pacific led the market with 4% regional share in 2024, followed by Europe at 28.7%, North America at 22.1%, Latin America at 7.1%, and Middle East & Africa at 5.7%, driven by infrastructure development and sustainability adoption.
Low Carbon Footprint Coatings Market Segmentation Analysis:
By Product Type:
By product type, water-based coatings dominated the Low Carbon Footprint Coatings Market with a 41.6% market share in 2024, driven by strict VOC emission regulations and strong adoption across architectural and industrial applications. These coatings offer low environmental impact, improved indoor air quality, and compatibility with sustainability certifications, supporting their widespread use. Powder coatings followed with a 27.3% share, benefiting from zero-solvent formulations and high material utilization efficiency. High-solids coatings accounted for 18.2%, supported by reduced solvent content and superior durability, while bio-based coatings held 12.9%, driven by renewable raw material adoption.
- For instance, Axalta's Alesta ZeroZinc primers provide zero-VOC, zinc-free anti-corrosion protection for steel and galvanized substrates, achieving corrosion resistance up to C5-I per ISO 12944-6 standards with no solvents or sanitary labeling.
By Application:
By application, architectural coatings held the dominant position with a 38.4% market share in 2024, supported by rising green building construction, urban infrastructure expansion, and regulatory mandates for low-emission materials. Increased residential renovation activities further strengthened demand for low-carbon architectural solutions. Industrial coatings captured a 26.7% share, driven by sustainability initiatives in manufacturing facilities and corrosion protection requirements. Automotive coatings accounted for 21.1%, supported by OEM sustainability targets and lightweight vehicle production, while protective and marine coatings held 13.8%, benefiting from eco-compliant corrosion-resistant formulations.
- For instance, AkzoNobel's cool chemistry products reflect solar energy to cut building cooling needs, lowering energy use and carbon footprints while aiding green certifications through low-emission formulas.
By End-Use Industry:
By end-use industry, construction and infrastructure dominated the market with a 42.9% share in 2024, driven by large-scale green infrastructure projects, energy-efficient buildings, and government-backed sustainability programs. The automotive and transportation sector followed with a 24.6% share, supported by electric vehicle production and low-emission manufacturing standards. Industrial manufacturing accounted for 20.3%, reflecting increased adoption of sustainable surface protection solutions, while the energy and utilities segment held 12.2%, driven by renewable energy installations and corrosion protection requirements for low-carbon power assets.
Key Growth Drivers
Stringent Environmental Regulations and Emission Standards
Stringent environmental regulations and emission standards are a primary growth driver for the Low Carbon Footprint Coatings Market. Governments across North America, Europe, and Asia Pacific continue to enforce strict limits on volatile organic compound emissions, carbon intensity, and hazardous air pollutants in coatings formulations. Regulatory frameworks promoting low-VOC, water-based, powder, and bio-based coatings are accelerating the shift away from solvent-based products. Compliance requirements across construction, automotive, and industrial manufacturing sectors are compelling manufacturers to invest in sustainable coating technologies, thereby expanding product adoption and supporting long-term market growth.
- For instance, BASF developed the CathoGuard 800 e-coat for automotive applications, which is low in solvents, free of heavy metals and HAPs, and reduces VOC emissions compared to solvent-borne paints.
Rapid Expansion of Green Building and Sustainable Infrastructure
The rapid expansion of green building and sustainable infrastructure development significantly drives demand in the Low Carbon Footprint Coatings Market. Rising investments in energy-efficient residential and commercial buildings, supported by green certifications and climate-neutral construction targets, are increasing the use of environmentally friendly coatings. Low carbon footprint coatings enhance indoor air quality, reduce lifecycle emissions, and support compliance with sustainability benchmarks. Growing urbanization, infrastructure modernization, and renovation activities further strengthen demand, particularly for architectural coatings designed to meet low-emission and durability requirements.
- For instance, Sherwin-Williams offers ProMar 200 Zero VOC coatings with virtually no odor and zero VOC content, ideal for occupied spaces in LEED-certified projects. These low or no VOC formulations, free of toxic ingredients, maintain good indoor air quality for building users.
Sustainability Initiatives Across Automotive and Industrial Manufacturing
Sustainability initiatives across automotive and industrial manufacturing sectors are accelerating market growth. Automakers and industrial producers are increasingly integrating low-carbon coatings to reduce Scope 1 and Scope 3 emissions across production processes. Lightweight vehicle manufacturing, electric vehicle adoption, and energy-efficient industrial equipment require advanced coatings that offer corrosion resistance, durability, and reduced environmental impact. Corporate decarbonization commitments and ESG reporting requirements are driving coating suppliers to deliver innovative low-emission solutions, reinforcing sustained demand across high-volume manufacturing applications.
Key Trends & Opportunities
Rising Adoption of Bio-Based and Renewable Raw Materials
The rising adoption of bio-based and renewable raw materials represents a key trend and growth opportunity in the Low Carbon Footprint Coatings Market. Manufacturers are increasingly incorporating plant-based resins, natural binders, and biomass-derived additives to reduce dependency on fossil-based inputs. These innovations support lower lifecycle emissions while maintaining performance characteristics such as adhesion, durability, and chemical resistance. Advancements in material science and supply chain scalability are improving the commercial viability of bio-based coatings, creating opportunities for product differentiation and premium sustainable offerings across architectural and industrial segments.
- For instance, AkzoNobel developed RUBBOL WF 3350, a waterborne wood coating with 20% bio-based content verified by C-14 testing, using renewable plant-derived materials for sprayable opaque applications that match high durability standards in harsh weather.
Technological Advancements in High-Performance Low-Emission Coatings
Technological advancements in high-performance low-emission coatings are unlocking new opportunities across multiple end-use industries. Innovations in water-based, powder, and high-solids formulations are enhancing coating efficiency, curing speed, and surface protection while minimizing carbon emissions. Digital manufacturing, smart coating technologies, and advanced application methods are further improving material utilization and reducing waste. These developments enable coatings manufacturers to address demanding performance requirements in automotive, marine, and industrial applications, while aligning with sustainability goals and regulatory compliance standards.
- For instance, AkzoNobel introduced its Interpon powder coating series using Resicoat® technologies, which deliver superior corrosion resistance for electric vehicle components while eliminating VOC emissions.
Key Challenges
Higher Production Costs and Price Sensitivity
Higher production costs associated with low carbon footprint coatings present a significant market challenge. Sustainable raw materials, bio-based inputs, and advanced formulation technologies often increase manufacturing expenses compared to conventional coatings. These cost pressures can limit adoption among price-sensitive customers, particularly in emerging economies. Additionally, investments in research and development, process optimization, and certification requirements further impact profitability. Balancing cost competitiveness with performance and sustainability remains a critical challenge for manufacturers seeking to scale low-carbon solutions.
Performance Trade-Offs and Limited Awareness in Developing Markets
Performance trade-offs and limited awareness in developing markets pose another key challenge. Some low-carbon coatings face perceptions of reduced durability, slower curing times, or limited application flexibility compared to traditional alternatives. Inadequate awareness of long-term environmental and operational benefits further restricts adoption among end users. Lack of skilled applicators and limited availability of sustainable coating systems in certain regions also hinder market penetration. Overcoming these challenges requires continuous product innovation, education initiatives, and collaboration across the value chain.
Regional Analysis
North America
North America accounted for a 22.1% market share in 2024 in the Low Carbon Footprint Coatings Market, driven by strict environmental regulations, strong sustainability commitments, and high adoption of low-VOC coatings across construction and automotive sectors. The United States led regional demand due to widespread green building certifications, renovation activities, and corporate decarbonization targets. Industrial manufacturing and automotive OEMs increasingly adopted water-based and high-solids coatings to meet emission compliance. Ongoing investments in infrastructure modernization and rising consumer preference for eco-friendly products continue to support stable market growth across the region.
Europe
Europe held a 28.7% market share in 2024, supported by stringent EU environmental directives, carbon reduction targets, and strong regulatory enforcement on solvent emissions. Countries such as Germany, France, and the United Kingdom drove demand through large-scale adoption of sustainable architectural and industrial coatings. The region benefits from advanced manufacturing capabilities, high penetration of powder and bio-based coatings, and strong innovation ecosystems. Automotive and marine industries increasingly prioritize low-carbon solutions to align with climate neutrality goals, reinforcing Europe’s position as a key contributor to global market revenue.
Asia Pacific
Asia Pacific dominated the Low Carbon Footprint Coatings Market with a 36.4% market share in 2024, driven by rapid urbanization, infrastructure expansion, and rising industrial production. China, India, and Southeast Asian countries fueled demand through large construction projects and expanding automotive manufacturing bases. Increasing government focus on emission reduction, green building standards, and sustainable industrial practices accelerated adoption of water-based and powder coatings. Cost-effective manufacturing, growing awareness of environmental impact, and rising foreign investments further strengthened Asia Pacific’s leadership position in the global market.
Latin America
Latin America captured a 7.1% market share in 2024, supported by gradual adoption of sustainable construction practices and expanding industrial activities. Brazil and Mexico emerged as key contributors due to infrastructure development and automotive production growth. Regulatory frameworks promoting reduced VOC emissions are gaining momentum, encouraging the shift toward low-carbon coating technologies. Increasing investments in renewable energy projects and industrial modernization also support demand for eco-friendly protective coatings. However, moderate regulatory enforcement and price sensitivity continue to influence adoption rates across several countries in the region.
Middle East & Africa
The Middle East & Africa accounted for a 5.7% market share in 2024, driven by infrastructure development, energy sector investments, and growing awareness of sustainable materials. Gulf countries led regional demand due to large construction projects, smart city initiatives, and green building regulations. Adoption of low carbon footprint coatings increased in industrial and energy applications, particularly for corrosion protection. In Africa, gradual urban development and industrial growth supported market expansion, although limited regulatory enforcement and cost constraints moderated overall adoption across several economies.
Low Carbon Footprint Coatings Market Segmentations:
By Product Type
- Water-based coatings
- Powder coatings
- High-solids coatings
- Bio-based coatings
By Application
- Architectural coatings
- Industrial coatings
- Automotive coatings
- Protective and marine coatings
By End-Use Industry
- Construction and infrastructure
- Automotive and transportation
- Industrial manufacturing
- Energy and utilities
By Geography
- North America
- U.S.
- Canada
- Mexico
- Europe
- Germany
- France
- U.K.
- Italy
- Spain
- Rest of Europe
- Asia Pacific
- China
- Japan
- India
- South Korea
- South-east Asia
- Rest of Asia Pacific
- Latin America
- Brazil
- Argentina
- Rest of Latin America
- Middle East & Africa
- GCC Countries
- South Africa
- Rest of the Middle East and Africa
Competitive Landscape
Competitive landscape analysis of the Low Carbon Footprint Coatings Market features AkzoNobel N.V., PPG Industries, Inc., The Sherwin-Williams Company, BASF SE, Nippon Paint Holdings Co., Ltd., Asian Paints Ltd., Axalta Coating Systems Ltd., Jotun, Berger Paints India Ltd., and Allnex GmbH. The market reflects a moderately consolidated structure, with leading players focusing on sustainable product innovation, low-VOC formulations, and carbon reduction across the value chain. Companies are investing heavily in water-based, powder, high-solids, and bio-based coatings to comply with tightening environmental regulations. Strategic initiatives such as capacity expansions, green manufacturing upgrades, and collaborations with raw material suppliers support portfolio diversification. Strong regional presence, established distribution networks, and compliance with global sustainability standards provide competitive advantages. Continuous R&D investments and alignment with ESG goals remain critical for maintaining market positioning and capturing long-term growth opportunities.
Key Player Analysis
- AkzoNobel N.V.
- PPG Industries, Inc.
- The Sherwin-Williams Company
- BASF SE
- Nippon Paint Holdings Co., Ltd.
- Asian Paints Ltd.
- Berger Paints India Ltd.
- Jotun
- Axalta Coating Systems Ltd.
- Allnex GmbH
Recent Developments
- In September 2025, AkzoNobel and BASF expanded their strategic partnership to develop lower-carbon footprint architectural powder coatings, reducing carbon emissions of high-volume paint products.
- In November 2025, Covestro and Nippon Paint forged a strategic alliance at the China International Import Expo to co-develop comprehensive low-carbon coating systems for automotive and industrial applications.
- In October 2025, BASF launched its NEOL® NPG low-carbon neopentylglycol solution at the new Zhanjiang plant, enhancing supply of reduced carbon footprint intermediates for powder coatings.
Report Coverage
The research report offers an in-depth analysis based on Product Type, Application, End Use Industry and Geography. It details leading market players, providing an overview of their business, product offerings, investments, revenue streams, and key applications. Additionally, the report includes insights into the competitive environment, SWOT analysis, current market trends, as well as the primary drivers and constraints. Furthermore, it discusses various factors that have driven market expansion in recent years. The report also explores market dynamics, regulatory scenarios, and technological advancements that are shaping the industry. It assesses the impact of external factors and global economic changes on market growth. Lastly, it provides strategic recommendations for new entrants and established companies to navigate the complexities of the market.
Future Outlook
- The Low Carbon Footprint Coatings Market will continue to expand driven by global decarbonization targets and stricter environmental regulations.
- Increasing adoption of water-based and powder coatings will support long-term emission reduction across major industries.
- Bio-based and renewable raw materials will gain higher acceptance as performance and cost efficiency improve.
- Green building construction and sustainable infrastructure projects will remain a key demand driver.
- Automotive and electric vehicle manufacturing will accelerate the shift toward low-emission coating technologies.
- Industrial manufacturers will increasingly integrate low carbon coatings to meet ESG and compliance requirements.
- Technological advancements will enhance durability, curing efficiency, and application performance of sustainable coatings.
- Asia Pacific will maintain strong growth momentum supported by urbanization and industrial expansion.
- Strategic partnerships and innovation-focused investments will intensify competition among key players.
- Awareness of lifecycle environmental benefits will strengthen adoption across emerging and developed markets.
Request a Free Sample
Fill in your details and we'll send you a free sample report.
- Sample data tables & charts
- Research methodology
Need a Custom Version of This Report?
Tailor the scope, geography, or segments to your exact requirements.
- Custom geography or segment scope
- Direct access to our analyst team
Frequently Asked Questions
What is the current market size for the Low Carbon Footprint Coatings Market, and what is its projected size in 2032?
At what Compound Annual Growth Rate is the Low Carbon Footprint Coatings Market projected to grow between 2024 and 2032?
Which Low Carbon Footprint Coatings Market segment held the largest share in 2024?
What are the primary factors fueling the growth of the Low Carbon Footprint Coatings Market?
Who are the leading companies in the Low Carbon Footprint Coatings Market?
Which region commanded the largest share of the Low Carbon Footprint Coatings Market in 2024?
Table of Content
Chapter 1. Report Introduction
- 1.1 Report Description & Purpose
- 1.1.1 Report Title & Market Definition
- 1.1.2 Unique Selling Propositions (USP) & Key Differentiators
- 1.1.3 Value Proposition for Stakeholders
- 1.2 Research Objectives
- 1.2.1 Market Sizing Objectives (Volume & Revenue)
- 1.2.2 Segmentation Objectives
- 1.2.3 Competitive Intelligence Objectives
- 1.2.4 Forecast & Scenario Objectives
- 1.3 Report Scope
- 1.3.1 Low Carbon Footprint Coatings Scope – Types & Subtypes Covered
- 1.3.2 Geographic Scope – Regions & Countries Covered
- 1.3.3 Historical Period, Base Year & Forecast Period (2024; forecast to 2032)
- 1.3.4 Inclusions & Exclusions
- 1.4 HS Code & Classification Framework
- 1.5 Currency, Units & Pricing Basis
- 1.6 Target Stakeholders
- 1.7 Limitations & Assumptions
Chapter 2. Executive Summary
- 2.1 Global Low Carbon Footprint Coatings Market Snapshot
- 2.1.1 Market Size – Historical (2024) & Forecast (2024-2032) (2024: USD 5,193 Million → 2032: USD 9827.2 Million)
- 2.1.2 Volume & Revenue – Global Totals
- 2.1.3 Key Market Highlights – Top Five Facts
- 2.2 Low Carbon Footprint Coatings Market Segmentation Snapshot
- 2.2.1 Market Split by Region – 2024 vs. 2032
- 2.3 Competitive Snapshot
- 2.3.1 Top 10 Players by Revenue Share – 2024
- 2.3.2 Top 10 Players by Volume Share – 2024
- 2.3.3 Recent Strategic Developments (18-Month Summary)
- 2.4 Key Investment Highlights & Strategic Conclusions
Chapter 3. Low Carbon Footprint Coatings Market Dynamics & Industry Analysis
- 3.1 Market Overview & Context
- 3.1.1 Low Carbon Footprint Coatings Market Position in the Broader Automotive Value Chain
- 3.1.2 OEM vs. Replacement Market Dynamics
- 3.1.3 Market Maturity & Development Stage by Region
- 3.2 Low Carbon Footprint Coatings Market Drivers
- 3.3 Low Carbon Footprint Coatings Market Restraints & Challenges
- 3.4 Low Carbon Footprint Coatings Market Opportunities
- 3.5 Porter's Five Forces Analysis
- 3.5.1 Threat of New Entrants
- 3.5.2 Bargaining Power of Suppliers
- 3.5.3 Bargaining Power of Buyers
- 3.5.4 Threat of Substitutes
- 3.5.5 Competitive Rivalry – Intensity Assessment
- 3.6 Low Carbon Footprint Coatings Value Chain Analysis
- 3.6.1 Upstream – Raw Material/Input Suppliers
- 3.6.1.1 Raw Material/Input 1
- 3.6.1.2 Raw Material/Input 2
- 3.6.1.3 Raw Material/Input 3
- 3.6.2 Midstream – Production/Manufacturing/Service Delivery
- 3.6.2.1 Production/Process Overview
- 3.6.2.2 Key Facility Locations & Capacity by Manufacturer
- 3.6.3 Downstream – Distribution & End Consumer
- 3.6.3.1 Primary Channel – B2B/OEM
- 3.6.3.2 Secondary Channels – Dealer, Retail, Online, Direct
- 3.6.4 Value Chain Profitability Analysis
- 3.6.1 Upstream – Raw Material/Input Suppliers
- 3.7 PESTEL Analysis
- 3.7.1 Political Factors
- 3.7.2 Economic Factors
- 3.7.3 Social Factors
- 3.7.4 Technological Factors
- 3.7.5 Environmental Factors
- 3.7.6 Legal Factors
- 3.8 Low Carbon Footprint Coatings Supply Chain Analysis
- 3.8.1 Raw Material/Input Supply Risk Assessment
- 3.8.2 Manufacturing Concentration Risk (Geographic Exposure)
- 3.8.3 Trade Disruption Impact Analysis
- 3.9 Regulatory & Policy Landscape
Note: The regulatory and policy landscape section covers regulations based on their applicability to the market, Low Carbon Footprint Coatings category, geography, and scope of the study. Only regulatory frameworks with a material impact on operations, compliance, trade, sustainability, or market access are analyzed in detail.
Chapter 4. Key Investment Pockets & Opportunity Analysis
- 4.1 Low Carbon Footprint Coatings Market Attractiveness Analysis
- 4.1.1 By Region – Investment Attractiveness Matrix (Volume × CAGR)
- 4.2 Absolute Revenue Growth Opportunity
- 4.2.1 By Region – Absolute USD Growth Through 2032
- 4.3 Incremental Volume Opportunity
- 4.3.1 By Region – Incremental Volume Through 2032
- 4.3.2 Segment – Incremental Volume
- 4.4 Emerging Submarket Opportunity Deep Dive (Subject to Applicability)
- 4.5 Emerging Market Opportunity Scorecards
- 4.5.1 United States
- 4.5.2 Europe
- 4.5.3 Asia
- 4.5.4 Middle East & Africa
Note: Emerging Market Opportunity Scorecards will be included based on relevance and strategic importance. Regions listed are indicative and may vary depending on data availability and market dynamics.
Chapter 5. Low Carbon Footprint Coatings Import-Export Analysis & Trade Flows
- 5.1 Global Trade Overview
- 5.1.1 Global Export Value by Country (2024)
- 5.1.2 Global Export Volume by Country (2024)
- 5.1.3 Global Import Value by Country (2024)
- 5.1.4 Global Import Volume by Country (2024)
- 5.1.5 Net Trade Balance by Country (2024)
- 5.2 Export Analysis – Segment
- 5.2.1 Type 1 (HS Code)
- 5.2.2 Type 2 (HS Code)
- 5.2.3 Type 3 (HS Code)
- 5.2.4 Type 4 (HS Code)
- 5.2.5 Type 5 (HS Code)
- 5.3 Import Analysis – Segment
- 5.3.1 Type 1 (HS Code)
- 5.3.2 Type 2 (HS Code)
- 5.3.3 Type 3 (HS Code)
- 5.3.4 Type 4 (HS Code)
- 5.3.5 Type 5 (HS Code)
- 5.4 Average Unit Trade Prices
- 5.4.1 Average Export Price – Segment & Country
- 5.4.2 Average Import Price – Segment & Source Country
- 5.4.3 Price Trends (2024)
- 5.5 Key Trade Route Analysis
- 5.5.1 Trade Route 1
- 5.5.2 Trade Route 2
- 5.5.3 Trade Route 3
- 5.5.4 Trade Route 4
- 5.5.5 Trade Route 5
- 5.6 Trade Policy Impact Assessment
- 5.6.1 US Anti-Dumping & Section 301 Tariffs
- 5.6.2 EU Customs Union Impact
- 5.6.3 Major Free Trade Agreements
- 5.6.4 USMCA Rules of Origin
Note: Trade policy analysis will be included only where relevant to the Low Carbon Footprint Coatings market.
Chapter 6. Competitive Landscape & Company Benchmarking
- 6.1 Low Carbon Footprint Coatings Market Concentration & Structure
- 6.1.1 Herfindahl-Hirschman Index (HHI) – vs. 2024
- 6.1.2 Tier 1, Tier 2 & Tier 3 Market Structure
- 6.1.3 Global, Regional & Local Player Dynamics
- 6.2 Low Carbon Footprint Coatings Market Share Analysis – 2024
- 6.2.1 Global Revenue Share by Company
- 6.2.2 Global Volume Share by Company
- 6.2.3 Regional Revenue Share
- 6.2.4 Market Share Evolution ( vs. 2024)
- 6.2.5 OEM Segment Share by Company
- 6.2.6 Replacement Segment Share by Company
- 6.3 Production/Delivery Capacity & Facility Analysis
- 6.3.1 Global Installed Capacity
- 6.3.2 Capacity Utilization Rates
- 6.3.3 Production/Output Volume
- 6.3.4 Facility Locations & Capacity Map
- 6.3.5 Planned Capacity Additions
- 6.4 Low Carbon Footprint Coatings Competitive Benchmarking Matrix
- 6.4.1 Revenue, Volume, CAGR & Profitability Comparison
- 6.4.2 Channel Revenue Mix
- 6.4.3 Geographic Revenue Exposure
- 6.4.4 R&D Intensity
- 6.4.5 Sustainability Maturity
- 6.5 Strategic Developments in Low Carbon Footprint Coatings (Last 24 Months)
- 6.5.1 Mergers, Acquisitions & Divestments
- 6.5.2 New Low Carbon Footprint Coatings Launches
- 6.5.3 Facility Expansions
- 6.5.4 Strategic Alliances, Joint Ventures & Partnerships
- 6.5.5 Distribution Expansion & Market Entry
- 6.5.6 Sustainability & ESG Initiatives
- 6.6 Competitive Strategy Mapping
- 6.6.1 Leader, Challenger, Follower & Niche Classification
- 6.6.2 Pricing Strategy Comparison
- 6.6.3 Channel Strategy Matrix
Note: Strategic developments are included based on their materiality and the availability of reliable information.
Chapter 7. Global Low Carbon Footprint Coatings Market – By Distribution Channel
- 7.1 Segment Overview
- 7.1.1 Volume & Revenue Split by Channel (2024 & 2032)
- 7.1.2 Channel Mix Evolution (2024-2032)
Chapter 8. Regional Market Analysis – Global Overview
- 8.1 Global Regional Overview
- 8.1.1 Regional Volume Share
- 8.1.2 Regional Revenue Share
- 8.1.3 Regional Volume by Region
- 8.1.4 Regional Revenue by Region
- 8.1.5 Regional Forecast Through 2032
- 8.2 Cross-Regional Segment Analysis
- 8.2.1 By Distribution Channel
- 8.2.2 By Brand/Price Tier
Chapter 9. North America Low Carbon Footprint Coatings Market
- 9.1 United States
- 9.2 Canada
- 9.3 Mexico
Chapter 10. Europe Low Carbon Footprint Coatings Market
- 10.1 Germany
- 10.2 France
- 10.3 Italy
- 10.4 United Kingdom
- 10.5 Spain
- 10.6 Poland
- 10.7 Russia
- 10.8 Netherlands
- 10.9 Belgium
- 10.10 Sweden
- 10.11 Denmark
- 10.12 Norway
- 10.13 Rest of Europe
Chapter 11. Asia Pacific Low Carbon Footprint Coatings Market
- 11.1 China
- 11.2 India
- 11.3 Japan
- 11.4 South Korea
- 11.5 Thailand
- 11.6 Indonesia
- 11.7 Vietnam
- 11.8 Malaysia
- 11.9 Australia
- 11.10 Rest of Asia Pacific
Chapter 12. Latin America Low Carbon Footprint Coatings Market
- 12.1 Brazil
- 12.2 Argentina
- 12.3 Colombia
- 12.4 Chile
- 12.5 Rest of Latin America
Chapter 13. Middle East Low Carbon Footprint Coatings Market
- 13.1 Saudi Arabia
- 13.2 United Arab Emirates
- 13.3 Turkey
- 13.4 Israel
- 13.5 Iran
- 13.6 Rest of the Middle East
Chapter 14. Africa Low Carbon Footprint Coatings Market
- 14.1 South Africa
- 14.2 Egypt
- 14.3 Nigeria
- 14.4 Morocco
- 14.5 Rest of Africa
Chapter 15. Low Carbon Footprint Coatings Company Profiles
- 15.1 [Company 01]
- 15.1.1 Company Overview
- 15.1.2 Key Management Personnel
- 15.1.3 Products & Services Portfolio
- 15.1.4 Financial Performance
- 15.1.5 Key Market Focus & Geographic Presence
- 15.1.6 Recent Developments & Strategic Initiatives
Note: The company profile list is preliminary and may change based on research findings, market developments, data availability, and client requirements.
Chapter 16. Appendices
- Appendix A – List of Abbreviations & Acronyms
- Appendix B – Industry Classification Code Reference – Full Series
- Appendix C – Production & Capacity Data Tables
- Appendix D – End-Use & Demand Base Tables
- Appendix E – Consumption & Replacement Rate Assumptions
- Appendix F – ASP Reference Tables
- Appendix G – Manufacturing & Facility Database
- Appendix H – Import-Export Data Tables
- Appendix I – Regulatory Summary Tables
- Appendix J – Primary Research Participant List (Anonymized)
- Appendix K – Primary Research Questionnaire Framework
- Appendix L – Data Sources & Bibliography
- Appendix M – Market Size Divergence & Source Comparison
Chapter 17. Research Methodology
- 17.1 Research Framework & Philosophy
- 17.2 Secondary Research – Sources, Hierarchy & Data Extraction
- 17.3 Data Modeling – Bottom-Up & Top-Down Market Sizing
- 17.4 Primary Research – Stakeholder Framework, LOI & Sample Sizes
- 17.5 Forecast Methodology – Regression, Scenario & Sensitivity Analysis
- 17.6 Quality Control – Four-Layer Validation Framework
- 17.7 Limitations & Standard Assumptions
- 17.8 Disclaimer
