Market Overview
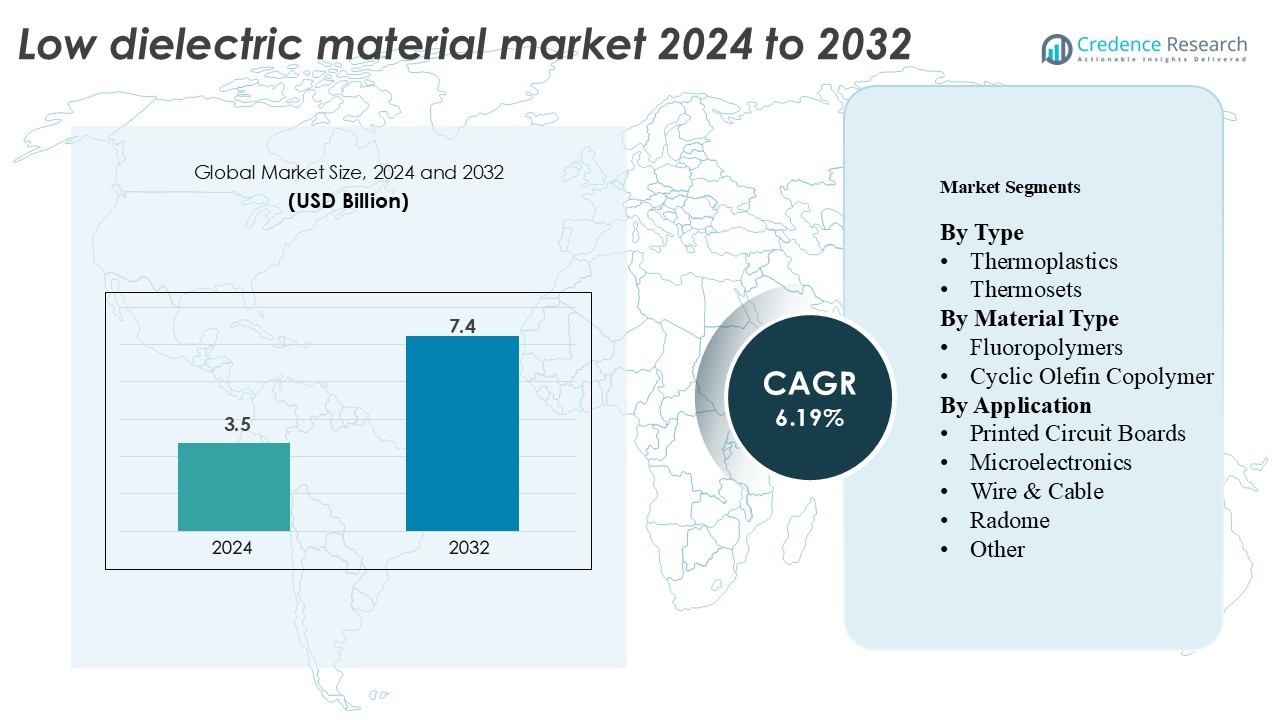
The Low Dielectric Material Market size was valued at USD 3.5 billion in 2024 and is projected to reach USD 6.19 billion by 2032, growing at a CAGR of 7.4% during the forecast period (2025–2032).
| REPORT ATTRIBUTE |
DETAILS |
| Historical Period |
2020-2023 |
| Base Year |
2024 |
| Forecast Period |
2025-2032 |
| Low Dielectric Material Market Size 2024 |
USD 3.5 Billion |
| Low Dielectric Material Market , CAGR |
7.4% |
| Low Dielectric Material Market Size 2032 |
USD 6.19 Billion |
The Low Dielectric Material Market features strong competition among global leaders such as Topas Advanced Polymers, Chemours Company LLC, Asahi Kasei Corporation, Zeon Corp., DIC Corporation, Huntsman Corporation, SABIC, Arxada, Mitsubishi Corporation, and Daikin Industries Ltd. These companies focus on developing high-performance materials like fluoropolymers, cyclic olefin copolymers (COC), polyimides, and modified polyphenylene ethers to support next-generation electronics, 5G infrastructure, and automotive applications. Continuous innovation in ultra-low dielectric constant and dissipation factor materials enhances circuit speed and reliability. Asia Pacific, holding 39.5% of the global market share in 2024, remains the dominant region due to its large-scale electronics manufacturing base and strong investment in communication technologies. North America and Europe follow, driven by technological advancements in aerospace, defense, and data communication systems.
Access crucial information at unmatched prices!
Request your sample report today & start making informed decisions powered by Credence Research Inc.!
Download Sample
Market Insights
- The Low Dielectric Material Market size was valued at USD 3.5 billion in 2024 and is projected to reach USD 6.19 billion by 2032.
- 5G densification and AI compute drive low-loss demand. PCB density rises. EV power electronics, radar, and chargers require stable Dk/Df. Designers prioritize thinner laminates and tighter impedance control.
- Vendors push ultra-low Df films and PTFE blends. Localization strengthens supply resilience. Thermoplastics lead by type at 45%. Fluoropolymers lead by material at 32%. PCBs lead by application at 43%.
- Constraints include fluoropolymer price swings and specialty monomer tightness. Processing windows narrow for drilling, plating, and adhesion. Extended qualification cycles and compliance add cost and delay ramps.
- Asia Pacific leads with 39.5% share in 2024. North America follows at 27.0%, supported by hyperscale and defense. Europe holds 22.0% on automotive and telecom upgrades. Latin America is 6.5%. Middle East & Africa is 5.0%.
Market Segmentation Analysis:
By Type
Thermoplastics led the market with a 45% share in 2023. Flexible processing enables high-volume, low-cost manufacturing. Remelting allows rework and complex shapes. Strong electrical insulation boosts device reliability. Adoption is high in PCBs, wire and cable. Demand rises from telecom, automotive electronics, and smart devices. Thermosets will post faster growth through 2032. Cured networks resist creep and deformation. Superior thermal stability suits harsh environments. Use cases include radomes, antennas, and high-frequency circuits. Growth aligns with 5G rollouts and EV platforms.
- For instance, SABIC’s Ultem 1000 thermoplastic polyetherimide delivers a dielectric constant of 3.15 at 1 MHz and maintains dimensional stability up to 200 °C, enabling its use in advanced communication modules.
By Material Type
Fluoropolymers dominated with a 32% share in 2023. PTFE delivers low dielectric constant and loss. Chemical resistance supports long service life. Reliability under extreme temperatures is proven. Key uses include cables, PCBs, and radomes. 5G and high-speed links amplify demand. Cyclic Olefin Copolymer shows the fastest growth. Low moisture uptake preserves signal integrity. High transparency supports optical components. Mechanical strength suits miniaturized devices. Adoption expands in medical and automotive electronics.
- For instance, Daikin Industries’ Neoflon ETFE film features a dielectric constant of 2.6 at 1 MHz and maintains flexibility down to –200 °C, enhancing signal performance in aerospace and telecom wiring systems.
By Application
Printed circuit boards dominated the market with a 43% share in 2024, driven by rapid advancements in 5G base stations, autonomous vehicles, and data centers. Low dielectric materials enable faster signal transmission, minimal loss, and improved impedance control in multilayer PCBs. Microelectronics and wire & cable applications also gain traction, focusing on high-frequency performance and miniaturization. Radome and antenna systems adopt low Dk materials to enhance radar transparency and reduce reflection losses. Expanding use of high-speed data devices and advanced packaging sustains PCB dominance across multiple end-use industries.Top of Form
Key Growth Drivers
5G, High-Speed Data, and Cloud Expansion
5G rollouts demand low-loss materials across radios and networks. Higher frequencies intensify dielectric loss risks. Low-k substrates protect signal integrity at mmWave. Data centers push higher lane speeds each year. Server boards require tighter impedance control. Materials with stable Dk and low Df win designs. Telecom OEMs specify narrow tolerance windows now. Consistent performance across temperature is also critical. Reliable dielectric behavior reduces retests and rework. These needs accelerate low-k material adoption globally.
- For instance, Rogers Corporation’s RO3003 laminate exhibits a dielectric constant of 3.00 ± 0.04 at 10 GHz and a dissipation factor of 0.0010, ensuring minimal signal loss in 77 GHz automotive radar and 28 GHz 5G base stations.
Electronics Miniaturization and PCB Density Growth
Devices keep shrinking while performance grows. Routing density increases crosstalk and loss. Low-k laminates reduce delay and coupling. Thin cores need predictable dielectric values. High-layer PCBs require uniform resin systems. Consistent glass weave lowers skew risk. Assembly windows are also tightening rapidly. Materials must balance flow and thermal stability. Designers prioritize stackups with proven reliability. Miniaturization trends therefore lift low-dielectric demand.
- For instance, Isola Group’s Astra MT77 laminate provides a dielectric constant of 3.00 ± 0.04 and dissipation factor of 0.0017 at 10 GHz, supporting fine-line routing in 18-layer PCB constructions for 5G radio units.
EV Power Electronics and Vehicle Connectivity
EV adoption expands high-voltage electronics content. Inverters and onboard chargers need low loss. Thermal loads rise in compact enclosures. Materials must pair low-k with heat resilience. ADAS sensors raise bandwidth needs too. Radar and V2X push into GHz bands. Low-loss radome and antenna materials matter. Automotive cycles demand long qualification windows. Stable properties reduce lifetime drift risks. EV and ADAS growth strengthens material pull-through.
Key Trends & Opportunities
Material Innovation: Blends, Film Substrates, and Ultra-Low Df
Vendors advance PTFE blends and engineered thermoplastics. Targets include Df below 0.002. Film substrates improve dimensional stability. COC and LCP attract high-frequency interest. Resin systems optimize copper adhesion profiles. CAF resistance gains priority in dense designs. Ultra-thin laminates support finer lines. Process windows widen for high-volume runs. Consistent Dk across lots reduces tuning. Innovation opens sockets across telecom, compute, and automotive.
- For instance, Taconic’s TLY-5A PTFE laminate delivers a dielectric constant of 2.17 ± 0.02 and a dissipation factor of 0.0009 at 10 GHz, making it suitable for 77 GHz radar and mmWave antenna arrays.
Manufacturing Localization and Secure Supply Chains
OEMs diversify sourcing across regions. Geopolitics and logistics raise supply risks. Local laminate lines reduce lead times. Regional stock lowers program delays. Dual-sourcing strategies gain executive support. Suppliers add capacity near key hubs. Qualification kits ship faster to designers. Local technical support speeds ramps. Stable supply improves cost predictability. Localization creates share gains for agile material vendors.
- For instance, Isola Group established a manufacturing facility in Chandler, Arizona, spanning 175,000 square feet, which enables localized production of advanced laminates and prepregs with turnaround times reduced to under 10 days for North American customers.
Key Challenges
Design for Sustainability and Regulatory Alignment
Regulators tighten chemical and recycling rules. Brands set aggressive sustainability goals. Low-VOC chemistries reduce factory emissions. Recyclable thermoplastic options gain attention. Longer lifetime lowers total footprint. Stable dielectrics reduce field failures. Fewer returns cut waste significantly. Documentation now includes eco metrics. Compliance speeds global homologation. Sustainability focus opens doors with leading OEMs.
Raw Material Volatility and Cost-Performance Balancing
Fluoropolymer inputs face price swings. Specialty monomers remain capacity constrained. Currency shifts complicate global bids. OEMs demand stable year-over-year pricing. Suppliers must hedge and optimize yields. Process efficiency offsets margin pressure. Lower-Df targets raise formulation costs. Value cases must prove lifetime savings. Design wins require clear TCO logic. Cost-performance balance remains difficult industry-wide.
Processing Complexity and High-Frequency Reliability Proof
Advanced laminates need tight process control. Copper roughness impacts insertion loss. Drill and desmear windows narrow quickly. Plating uniformity affects impedance stability. Moisture uptake can shift dielectric values. Thermal cycling stresses delicate interfaces. mmWave reliability requires extended testing. Qualification cycles delay revenue ramps. Field data remains critical for trust. Manufacturing discipline defines long-term winners.
Regional Analysis
Asia Pacific
Asia Pacific holds a 39.5% share, leading in electronics manufacturing scale and telecom rollouts. China, South Korea, Japan, and Taiwan anchor PCB, semiconductor, and materials supply chains. 5G base-station densification and fiber deployments elevate low-loss substrate demand. EV growth in China and Japan adds radar, inverter, and charger needs. Consumer devices require tighter impedance control and thinner laminates. Localized resin and film capacity improves lead times and pricing. Governments support advanced packaging and high-frequency R&D. Cross-industry collaboration accelerates qualification cycles. Regional vendors gain design wins with stable Dk and ultra-low Df portfolios. This scale maintains Asia Pacific’s leadership.
North America
North America accounts for a 27.0% share, driven by hyperscale data centers and defense electronics programs. High-speed networking and AI training clusters require consistent low-loss materials. Aerospace and defense specify rigorous reliability under thermal and vibration stress. Automotive suppliers scale ADAS radar and V2X platforms. PCB fabricators invest in ultra-fine lines and low-skew laminates. Onshoring incentives strengthen advanced packaging and substrate manufacturing. Telecommunications expand mid-band and mmWave 5G coverage. Qualification support from local technical centers reduces time-to-production. Supply security and IP protection attract OEM commitments. These dynamics sustain strong regional share and premium material adoption.
Europe
Europe represents a 22.0% share, reflecting leadership in automotive, industrial automation, and telecom upgrades. German and Nordic OEMs drive stringent quality and sustainability requirements. Low-VOC chemistries and recyclability influence material selection. 5G standalone cores and private networks expand enterprise use cases. Power electronics for renewable integration need low-loss, thermally stable substrates. Aerospace and satellite programs demand radiation-tolerant and moisture-resistant materials. Regional PCB houses advance HDI and RF stackups. EU regulations tighten documentation and compliance, favoring proven suppliers. R&D centers support mmWave testing and reliability studies. These factors keep Europe focused on high-spec, eco-aligned materials.
Latin America
Latin America captures a 6.5% share, supported by telecom modernization and electronics assembly growth. 4G-to-5G transitions upgrade backhaul and radio units. Consumer devices and set-top production require consistent dielectric properties. Automotive clusters in Mexico add connectivity and radar modules. Import reliance shapes pricing and lead times across substrates and films. Distributors expand local inventories for faster program ramps. Training initiatives improve RF design and fabrication capabilities. Government digital agendas encourage network densification and fiber builds. Suppliers offering robust technical support win early design sockets. These conditions drive steady, capability-led market gains.
Middle East & Africa
Middle East and Africa hold a 5.0% share, growing through telecom, smart city, and defense investments. Gulf states scale 5G, cloud regions, and fiber networks. Data center builds require stable low-loss laminates and cables. Harsh climates elevate thermal and moisture performance needs. Transportation and security projects adopt radar and resilient communications. Localization policies favor regional stocking and service hubs. Training and joint labs accelerate qualification and field trials. Renewable integration adds power electronics substrates demand. Suppliers with extended temperature and humidity reliability gain traction. The region advances through infrastructure spending and ecosystem development.
Market Segmentations:
By Type
- Thermoplastics
- Thermosets
By Material Type
- Fluoropolymers
- Cyclic Olefin Copolymer
By Application
- Printed Circuit Boards
- Microelectronics
- Wire & Cable
- Radome
- Other
By Geography
- North America
- Europe
- Germany
- France
- U.K.
- Italy
- Spain
- Rest of Europe
- Asia Pacific
- China
- Japan
- India
- South Korea
- South-east Asia
- Rest of Asia Pacific
- Latin America
- Brazil
- Argentina
- Rest of Latin America
- Middle East & Africa
- GCC Countries
- South Africa
- Rest of the Middle East and Africa
Competitive Landscape
The Low Dielectric Material Market is highly competitive, with global and regional players focusing on material innovation, strategic partnerships, and capacity expansion. Major companies such as Dow, Rogers Corporation, Daikin Industries Ltd., Asahi Glass Co. Ltd., Toray Industries Inc., and 3M dominate the market through extensive R&D and a diverse product portfolio covering fluoropolymers, thermoplastics, and advanced composites. These firms emphasize ultra-low dielectric constant (Dk) and dissipation factor (Df) materials to meet 5G, automotive, and aerospace requirements. For instance, Rogers’ RO3000® and RT/duroid® series are widely used in high-frequency circuits, while Daikin’s PTFE grades deliver low signal loss in communication systems. Strategic mergers, collaborations, and localization of manufacturing facilities enhance global competitiveness. Continuous investment in sustainable formulations, dielectric testing, and miniaturization-friendly materials further strengthens their position in electronics, automotive radar, and data communication sectors. The competitive focus remains on reliability, scalability, and cost-efficient production of high-performance dielectric materials.
Shape Your Report to Specific Countries or Regions & Enjoy 30% Off!
Key Player Analysis
- Topas Advanced Polymers (Cyclic Olefin Copolymers, Modified Polyphenylene Ether)
- Chemours Company LLC (Teflon PTFE, Perfluoropolyether)
- Asahi Kasei Corporation (Modified Polyphenylene Ether, Polyimide)
- Zeon Corp. (Cyclic Olefin Copolymers, Liquid Crystal Polymers)
- DIC Corporation (Phenolic Resins, Polyimide Resins)
- Huntsman Corporation (Cyanate Ester, Epoxy Resins)
- SABIC (Fluoropolymers, Cyclic Olefin Copolymers)
- Arxada (Specialty Polymers, Antimicrobial Coatings)
- Mitsubishi Corporation (Ceramics, Polyimide)
- Daikin Industries Ltd. (Fluoropolymers, Modified Polyphenylene Ether)
Recent Developments
- In October 2024, DIC Corporation and Unitika developed a specialty PPS film with low dielectric properties, ideal for millimeter-wave PCBs and radar applications.
- In July 2024, Additive Drives and Daikin Chemicals are collaborating to develop high-performance materials for electric drives, focusing on improved dielectric properties and efficient, long-lasting motors.
- In February 2024, SABIC unveil new damp heat performance data for capacitors using Elcres™ HTV150A films at APEC 2024. The films, with excellent dielectric properties, are set to enhance reliability in high-temperature electronic applications.
Report Coverage
The research report offers an in-depth analysis based on Type, Material type, Application and Geography. It details leading market players, providing an overview of their business, product offerings, investments, revenue streams, and key applications. Additionally, the report includes insights into the competitive environment, SWOT analysis, current market trends, as well as the primary drivers and constraints. Furthermore, it discusses various factors that have driven market expansion in recent years. The report also explores market dynamics, regulatory scenarios, and technological advancements that are shaping the industry. It assesses the impact of external factors and global economic changes on market growth. Lastly, it provides strategic recommendations for new entrants and established companies to navigate the complexities of the market.
Future Outlook
- 5G to 6G upgrades will accelerate demand for ultra-low loss materials.
- AI servers and optical interconnects will push tighter Dk/Df tolerances.
- EV power electronics will favor thermally robust, low-loss laminates.
- Radar, satellite, and IoT growth will expand RF substrate adoption.
- Advanced packaging will drive thinner cores and finer line capability.
- COC, LCP, and modified PPE will gain share in miniaturized designs.
- Suppliers will localize capacity to improve lead times and resilience.
- Sustainability targets will boost low-VOC chemistries and recyclable thermoplastics.
- Standards and reliability testing will become more stringent at mmWave.
- Design-software and material co-optimization will shorten qualification cycles.


