Market Overview:
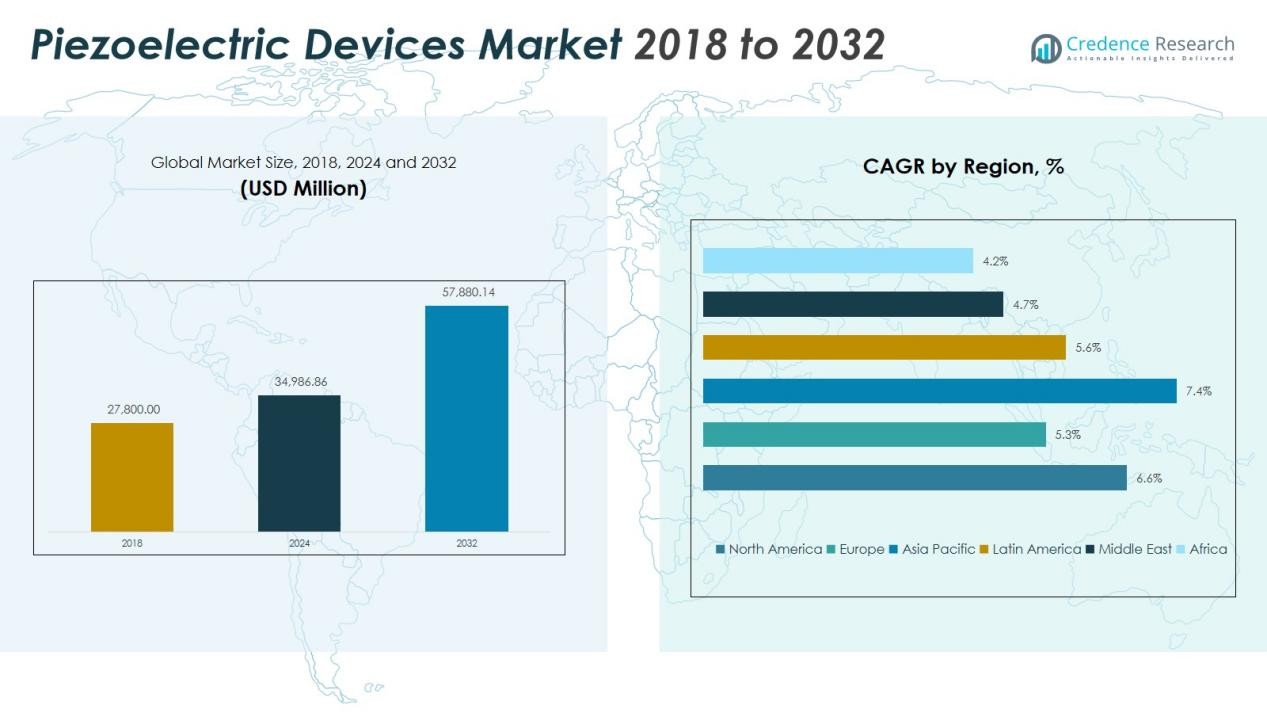
The Global Piezoelectric Devices Market size was valued at USD 27,800 million in 2018 to USD 34,986.86 million in 2024 and is anticipated to reach USD 57,880.14 million by 2032, at a CAGR of 6.58%during the forecast period.
| REPORT ATTRIBUTE |
DETAILS |
| Historical Period |
2020-2023 |
| Base Year |
2024 |
| Forecast Period |
2025-2032 |
| Piezoelectric Devices Market Size 2024 |
USD 34,986.86 Million |
| Piezoelectric Devices Market, CAGR |
6.58% |
| Piezoelectric Devices Market Size 2032 |
USD 57,880.14 Million |
Key growth drivers include the expanding use of piezoelectric devices in automotive, aerospace, defence, healthcare, and consumer electronics industries. The rise in demand for sensors, actuators, and energy-harvesting systems further accelerates adoption. Advancements in materials such as ceramics, composites, and polymers have enhanced device efficiency, durability, and cost-effectiveness. The growing emphasis on automation and miniaturization in industrial and medical applications also boosts market growth.
The Asia-Pacific region dominates the global piezoelectric devices market, accounting for more than half of total revenue in 2024. Countries like China, Japan, South Korea, and India serve as major manufacturing and innovation hubs. North America and Europe follow, supported by strong healthcare, automotive, and industrial automation sectors, though their growth pace remains moderate compared to Asia-Pacific.
Access crucial information at unmatched prices!
Request your sample report today & start making informed decisions powered by Credence Research Inc.!
Download Sample
Market Insights:
- The Global Piezoelectric Devices Market was valued at USD 27,800 million in 2018, increased to USD 34,986.86 million in 2024, and is projected to reach USD 57,880.14 million by 2032, registering a CAGR of 6.58% during the forecast period.
- Asia Pacific holds the largest share of 42%, driven by strong electronics manufacturing in China, Japan, and South Korea, along with growing automation and semiconductor production.
- North America accounts for 28% of the global share, supported by advanced aerospace, defense, and healthcare industries with high R&D spending.
- Europe captures 22% market share, led by Germany, the U.K., and France, owing to robust automotive manufacturing and sustainable material innovation.
- The Asia Pacific region remains the fastest-growing market due to industrial expansion, government-backed automation programs, and high consumer electronics demand.
Market Drivers:
Rising Adoption in Automotive and Industrial Automation
The Global Piezoelectric Devices Market benefits from the rising use of sensors and actuators in automotive and industrial automation. Piezoelectric components enhance engine management, vibration control, and fuel efficiency in modern vehicles. Their precision and quick response make them ideal for automation systems and process control. Increasing demand for electric vehicles and factory digitalization further expands adoption across manufacturing sectors. It continues to gain traction with the integration of smart sensors into industrial equipment.
- For instance, in automotive applications, Bosch reports piezoelectric actuators enabling multi-injection control with sub-10 microsecond response times in high-pressure fuel systems, improving combustion efficiency by enabling up to 3 precise injections per cycle.
Growing Demand in Healthcare and Medical Diagnostics
Piezoelectric technology is gaining ground in medical imaging, diagnostics, and therapeutic equipment. Devices such as ultrasound transducers, nebulizers, and surgical instruments rely on accurate vibration and frequency control. The Global Piezoelectric Devices Market experiences higher demand as healthcare facilities adopt compact and energy-efficient solutions. Rising investments in portable and wearable medical devices strengthen growth prospects. It finds increased use in diagnostic imaging due to the need for precision and reliability.
- For instance, Philips Healthcare’s PureWave crystal technology represents a significant breakthrough, delivering transducers that generate frequencies ranging from 2 to 22 MHz, with the eL18-4 transducer optimized to operate in the clinically relevant range of 4 to 18 MHz, achieving 85% greater efficiency than traditional piezoelectric (PZT) material in converting electrical input into acoustic output.
Technological Advancements and Material Innovation
Continuous innovation in piezoelectric materials supports enhanced performance and cost efficiency. Advancements in lead-free ceramics, polymers, and composite materials improve sensitivity and durability. The market benefits from research focused on miniaturization and integration into microelectromechanical systems (MEMS). It leverages advancements in nanotechnology to expand application scope across consumer electronics and smart devices. Manufacturers are developing materials that enable broader operational ranges and improved energy conversion.
Rising Adoption of Energy Harvesting and Smart Devices
The demand for self-powered electronics and IoT devices is driving the use of piezoelectric energy-harvesting modules. These systems convert mechanical stress into usable electrical energy, reducing dependence on external power sources. The Global Piezoelectric Devices Market gains momentum through applications in sensors, wearables, and remote monitoring systems. Growing trends in smart infrastructure and connected environments accelerate market penetration. It remains vital for creating sustainable, low-power electronic ecosystems.
Market Trends:
Integration of Piezoelectric Technology in Smart and Connected Devices
The Global Piezoelectric Devices Market is witnessing a steady shift toward smart and connected applications across industries. Piezoelectric sensors are now essential in consumer electronics, automotive safety systems, and industrial automation. Their ability to detect pressure, vibration, and acceleration enables real-time data collection in Internet of Things (IoT) ecosystems. Miniaturization and integration with microelectromechanical systems (MEMS) are supporting compact, energy-efficient device designs. It benefits from growing use in smartphones, wearables, and home automation solutions that rely on accurate motion and sound detection. Manufacturers are expanding R&D efforts to improve signal sensitivity, enhance temperature stability, and reduce power consumption. This trend reflects the rising preference for multifunctional sensors that improve performance without adding system complexity.
- For instance, the Bosch Sensortec BMI270 6-axis IMU demonstrates this integration with output data rates spanning from 0.78 Hz to 6.4 kHz across its accelerometer and gyroscope functions, while maintaining ultra-low power consumption of 685 μA in full operation, making it ideal for wearable applications where energy efficiency is critical
Shift Toward Lead-Free Materials and Sustainable Manufacturing
The market is increasingly adopting lead-free and environmentally sustainable piezoelectric materials. Regulations on hazardous substances and rising demand for eco-friendly products are influencing material innovation. Researchers are developing alternatives to lead zirconate titanate (PZT), such as barium titanate and potassium sodium niobate, which provide better compliance with environmental standards. It is driving manufacturers to re-engineer products to maintain high efficiency and mechanical reliability while meeting sustainability goals. Advancements in additive manufacturing and thin-film deposition techniques are enabling mass production of eco-conscious components. The trend toward green production practices aligns with the growing demand for sustainable electronics across automotive, healthcare, and consumer sectors. This evolution reinforces the market’s transition toward cleaner, high-performance material technologies.
- For instance, CeramTec has developed lead-free piezoceramics for medical applications with response times of 100 microseconds for ultrasonic bubble sensors, achieving detection accuracy of ±2mm and enabling bubble detection as small as 1 microliter across diverse liquid flow rates
Market Challenges Analysis:
High Production Costs and Complex Material Processing
The Global Piezoelectric Devices Market faces significant challenges related to high manufacturing costs and material complexity. Producing piezoelectric components requires precision machining, specialized ceramics, and advanced fabrication technologies that increase overall expenses. It encounters limitations in achieving economies of scale, especially for small and mid-sized manufacturers. The dependence on costly materials such as lead zirconate titanate and single crystals adds further strain to production budgets. Complex processing techniques also reduce yield rates and slow production cycles. These factors collectively restrict widespread adoption in cost-sensitive industries like consumer electronics and automotive sensors.
Performance Limitations and Environmental Concerns
The market struggles with technical constraints related to temperature stability, durability, and mechanical fatigue of piezoelectric materials. It faces challenges in maintaining long-term performance under high stress, vibration, or extreme temperature conditions. Environmental regulations restricting the use of lead-based materials create added compliance burdens for manufacturers. Developing reliable lead-free alternatives that match traditional performance remains difficult. The shift toward sustainability increases R&D costs and extends product development timelines. These factors slow innovation cycles and delay commercialization of next-generation piezoelectric technologies.
Market Opportunities:
Emerging Applications in Energy Harvesting and Smart Infrastructure
The Global Piezoelectric Devices Market holds strong opportunities in energy harvesting and smart infrastructure development. Rising demand for self-powered devices in IoT networks is creating new use cases for piezoelectric sensors and actuators. These components can capture mechanical vibrations or movements to generate energy, reducing dependence on traditional batteries. It benefits from rapid adoption in wearable electronics, industrial monitoring systems, and smart city projects. Integration into roads, bridges, and buildings for real-time structural health monitoring presents significant growth potential. Expanding renewable energy initiatives and the drive for energy-efficient solutions will further accelerate market expansion.
Advancements in Healthcare, Aerospace, and Consumer Electronics
The market is set to gain momentum through advancements in healthcare diagnostics, aerospace systems, and next-generation consumer electronics. Piezoelectric technologies are increasingly used in ultrasound imaging, surgical tools, and precision fluid pumps. It offers opportunities for high-precision motion control and sensing in aircraft and spacecraft applications. The growing demand for compact and high-performance electronic devices boosts adoption in smartphones, audio systems, and touch interfaces. Emerging trends in 5G communication and MEMS-based devices also support innovation. These opportunities highlight the expanding application horizon for piezoelectric technology across multiple industries.
Market Segmentation Analysis:
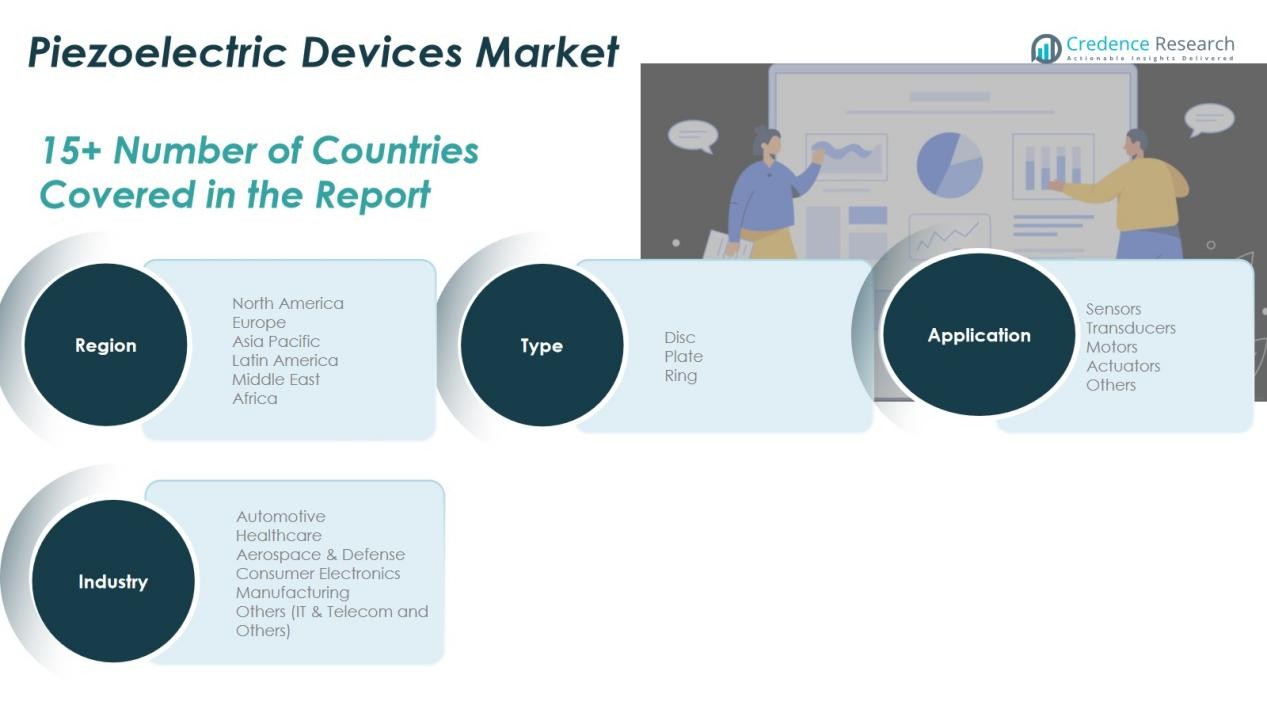
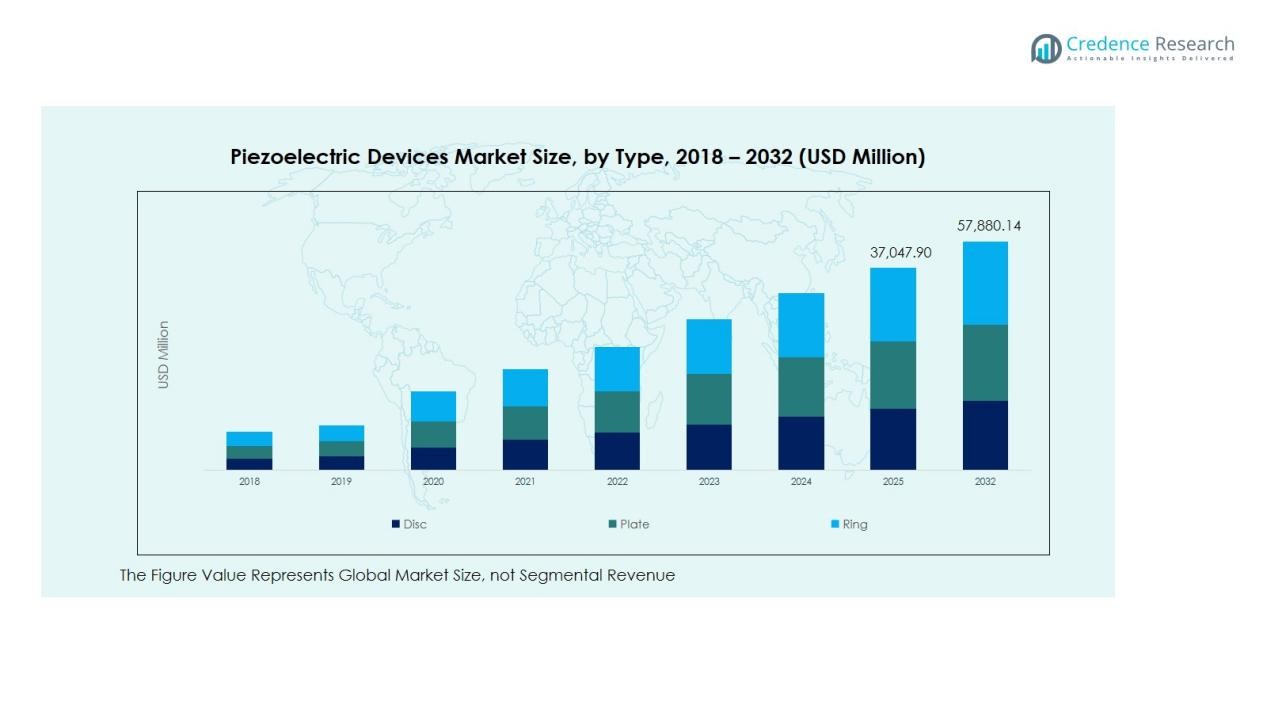
By Type
The Global Piezoelectric Devices Market is segmented into disc, plate, and ring types. Disc-type devices hold a significant share due to their compact structure and suitability for medical imaging and ultrasonic applications. Plate configurations are gaining traction in industrial sensors and actuators due to their high energy conversion efficiency. It continues to witness growth in ring-type components, supported by increased adoption in vibration control and high-precision motion systems. The diverse use of each type across industries strengthens the overall market expansion.
- For instance, APC International’s disc-type piezoelectric materials (APC 850 and APC 855) utilized in ultrasound medical devices achieve an electromechanical coupling coefficient of 0.68 and 0.72 respectively, with dielectric constants reaching 1900 and 3300, providing high precision and clean frequency response critical for diagnostic ultrasound imaging systems.
By Application
Based on application, the market includes sensors, transducers, motors, actuators, and others. Sensors account for the largest share, driven by rising demand in automotive, aerospace, and healthcare sectors. Transducers show strong potential in ultrasonic imaging and sonar technologies. Motors and actuators are experiencing rapid growth due to increased automation and robotics adoption. It benefits from growing use of piezoelectric components in precision instruments and advanced manufacturing processes.
- For instance, advanced piezoelectric transducers have achieved exceptional performance capabilities in high-frequency medical imaging applications, with researchers successfully developing lithium niobate-based ultrasonic transducers operating at 300 MHz with piezoelectric layer thickness of only 9 micrometers, enabling visualization of internal structures at the cellular level with beam widths as narrow as 6.5 micrometers.
By Industry
The market spans automotive, healthcare, aerospace and defense, consumer electronics, manufacturing, and others. Automotive leads due to growing integration of piezoelectric sensors in engine management and safety systems. Healthcare remains a key growth driver with applications in diagnostics and surgical tools. Consumer electronics and aerospace sectors are expanding adoption for enhanced sensing and control functions. It continues to evolve with industrial automation creating new demand across manufacturing lines.
Segmentations:
By Type
By Application
- Sensors
- Transducers
- Motors
- Actuators
- Others
By Industry
- Automotive
- Healthcare
- Aerospace & Defense
- Consumer Electronics
- Manufacturing
- Others
By Region
North America
- U.S.
- Canada
- Mexico
- Europe
- UK
- France
- Germany
- Italy
- Spain
- Russia
- Rest of Europe
Asia Pacific
- China
- Japan
- South Korea
- India
- Australia
- Southeast Asia
- Rest of Asia Pacific
Latin America
- Brazil
- Argentina
- Rest of Latin America
Middle East
- GCC Countries
- Israel
- Turkey
- Rest of Middle East
Africa
- South Africa
- Egypt
- Rest of Africa
Regional Analysis:
North America
The North America Piezoelectric Devices Market size was valued at USD 8,173.20 million in 2018, reaching USD 10,131.98 million in 2024, and is anticipated to reach USD 16,733.25 million by 2032, at a CAGR of 6.6% during the forecast period. The region accounts for 28% of the global revenue share. The United States dominates due to advanced medical device, aerospace, and defense sectors. The Global Piezoelectric Devices Market in North America benefits from strong R&D investment and high adoption of automation technologies. It is further strengthened by demand for precision sensors and actuators in industrial and healthcare applications. Canada and Mexico support growth with expanding automotive and electronics manufacturing.
Europe
The Europe Piezoelectric Devices Market size was valued at USD 4,531.40 million in 2018, rising to USD 5,345.04 million in 2024, and projected to reach USD 8,031.02 million by 2032, at a CAGR of 5.3%. Europe represents 22% of the global market share. Germany, the U.K., and France lead growth due to strong industrial automation and automotive production. The Global Piezoelectric Devices Market in Europe benefits from regulations promoting sustainable material use and high-efficiency devices. It shows steady progress in precision manufacturing and smart infrastructure development. Companies like CeramTec and Morgan Advanced Materials drive continuous innovation in piezoelectric material engineering.
Asia Pacific
The Asia Pacific Piezoelectric Devices Market size was valued at USD 11,898.40 million in 2018, expanding to USD 15,353.84 million in 2024, and expected to reach USD 26,931.67 million by 2032, at a CAGR of 7.4%. The region commands 42% of the global market share, making it the largest contributor. China, Japan, and South Korea dominate production of sensors, actuators, and transducers used in consumer electronics and automotive systems. The Global Piezoelectric Devices Market gains momentum here through strong industrialization and government-backed automation programs. It benefits from large-scale semiconductor manufacturing and expanding demand for MEMS-based components. India and Southeast Asia are emerging as new growth centers for manufacturing and R&D.
Latin America
The Latin America Piezoelectric Devices Market size was valued at USD 1,812.56 million in 2018, growing to USD 2,259.80 million in 2024, and projected to reach USD 3,476.86 million by 2032, at a CAGR of 5.6%. The region contributes 5% of global revenue. Brazil and Mexico lead with rising demand for automotive sensors and healthcare diagnostics. The Global Piezoelectric Devices Market in Latin America is supported by industrial automation and electronics assembly growth. It benefits from increased investments in renewable energy and manufacturing modernization. Expanding industrial capacity and smart factory initiatives strengthen future market potential.
Middle East
The Middle East Piezoelectric Devices Market size was valued at USD 778.40 million in 2018, increasing to USD 895.44 million in 2024, and forecast to reach USD 1,279.47 million by 2032, at a CAGR of 4.7%. The region holds 2.5% of the total market share. The Global Piezoelectric Devices Market benefits from increased use of sensors in oil and gas operations, industrial systems, and defense projects. It gains support from infrastructure modernization and smart city programs in GCC nations. Growth is further supported by aerospace and healthcare technology investments in the UAE and Saudi Arabia. Expanding industrial automation continues to create long-term opportunities.
Africa
The Africa Piezoelectric Devices Market size was valued at USD 606.04 million in 2018, reaching USD 1,000.77 million in 2024, and projected to reach USD 1,427.86 million by 2032, at a CAGR of 4.2%. The region holds 2% of global market share. The Global Piezoelectric Devices Market in Africa is expanding through adoption of medical diagnostics and renewable energy systems. South Africa and Egypt lead demand for sensors in healthcare and consumer electronics. It benefits from industrialization and foreign investments in manufacturing. Despite limited local production, import-led growth and technological adoption continue to drive steady expansion.
Key Player Analysis:
- Piezo System Jena (Germany)
- Murata (Japan)
- Morgan Advanced Materials (U.K.)
- Mad City Labs, Inc. (U.S.)
- Poliak A/S (Denmark)
- CTS Corporation (U.S.)
- Piezomechanik Dr. Lutz Pickelmann GmbH (Germany)
- Physik Instrumente (Germany)
- CeramTec (Germany)
Competitive Analysis:
The Global Piezoelectric Devices Market is highly competitive with strong participation from multinational and regional manufacturers. Key players include Piezo System Jena, Murata, Morgan Advanced Materials, Mad City Labs, Poliak A/S, CTS Corporation, Piezomechanik Dr. Lutz Pickelmann GmbH, Physik Instrumente, CeramTec, and APC International. Competition centers on product innovation, material development, and integration of high-efficiency piezoelectric components. It focuses on expanding application scope across healthcare, automotive, aerospace, and consumer electronics industries. Companies are strengthening portfolios through R&D investments and collaboration with OEMs for customized piezoelectric solutions. Continuous advancements in lead-free materials, miniaturization, and energy harvesting technologies drive differentiation. The market structure favors established manufacturers with global supply networks, though emerging firms are gaining ground through niche applications and cost-optimized products.
Shape Your Report to Specific Countries or Regions & Enjoy 30% Off!
Recent Developments:
- In June 2025, Piezo System Jena announced that its PSH 20/2 and PSH 35/2 tilt-stage systems were nominated as finalists for the Innovation Award 2025 at Laser World of Photonics, highlighting ongoing product enhancements in fast steering mirror technology.
- In October 2025, Piezosystem Jena public updates emphasizes ongoing participation in major industry events (e.g., SEMICON Europa 2025/Laser World of Photonics exhibitions) and continued enhancement of piezo actuators and stages, reflecting sustained product and market engagement.
Report Coverage:
The research report offers an in-depth analysis based on Type, Application, Industry and Region. It details leading market players, providing an overview of their business, product offerings, investments, revenue streams, and key applications. Additionally, the report includes insights into the competitive environment, SWOT analysis, current market trends, as well as the primary drivers and constraints. Furthermore, it discusses various factors that have driven market expansion in recent years. The report also explores market dynamics, regulatory scenarios, and technological advancements that are shaping the industry. It assesses the impact of external factors and global economic changes on market growth. Lastly, it provides strategic recommendations for new entrants and established companies to navigate the complexities of the market.
Future Outlook:
- The Global Piezoelectric Devices Market will expand with growing demand for precision sensors, actuators, and transducers across multiple industries.
- Technological advancements in lead-free materials will enhance environmental compliance and extend device durability.
- Healthcare applications will grow rapidly, driven by innovations in medical imaging, diagnostic tools, and therapeutic devices.
- Automation and robotics integration will increase adoption of piezoelectric motion control and vibration monitoring systems.
- Consumer electronics will remain a strong revenue stream with rising use in smartphones, wearables, and audio devices.
- Energy harvesting applications will gain momentum, supporting the development of self-powered IoT and wireless sensor systems.
- Miniaturization and MEMS-based designs will improve performance and expand use in compact and portable technologies.
- Manufacturers will invest more in advanced ceramics and composites to boost energy conversion efficiency and reliability.
- Strategic collaborations between OEMs and piezoelectric component suppliers will accelerate innovation and market penetration.
- Asia Pacific will continue to dominate global demand, supported by industrial growth and large-scale electronic manufacturing infrastructure.


