Home » Semiconductor & Electronics » UAV Chips Market

UAV Chips Market By Type (8 Bit, 16 Bit, 32 Bit, 64 Bit), By Application (Fixed Wing UAV, Unmanned Helicopter, Multirotor UAV, Others) – Growth, Future Prospects And Competitive Analysis 2019 – 2027

Price: $3699

Published: | Report ID: 10807 | Report Format : PDF

Increasing growth of UAVs in the U.S. to drive the global demand for UAV chips

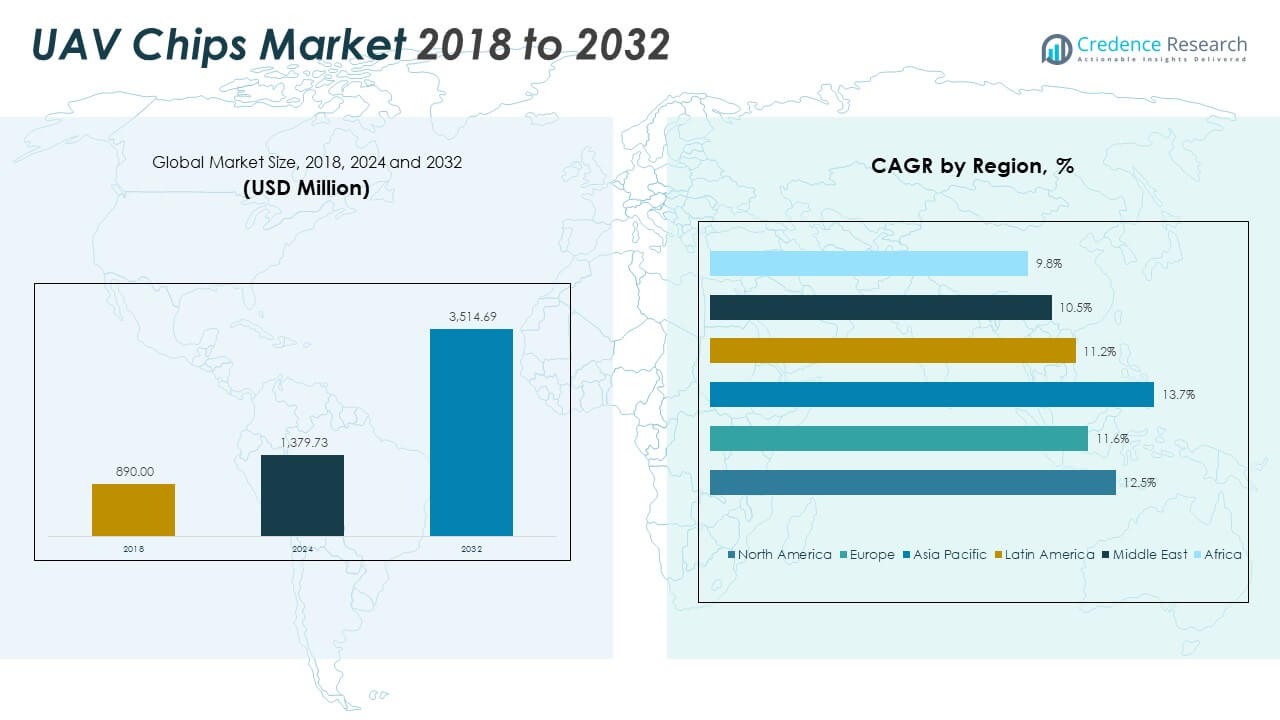
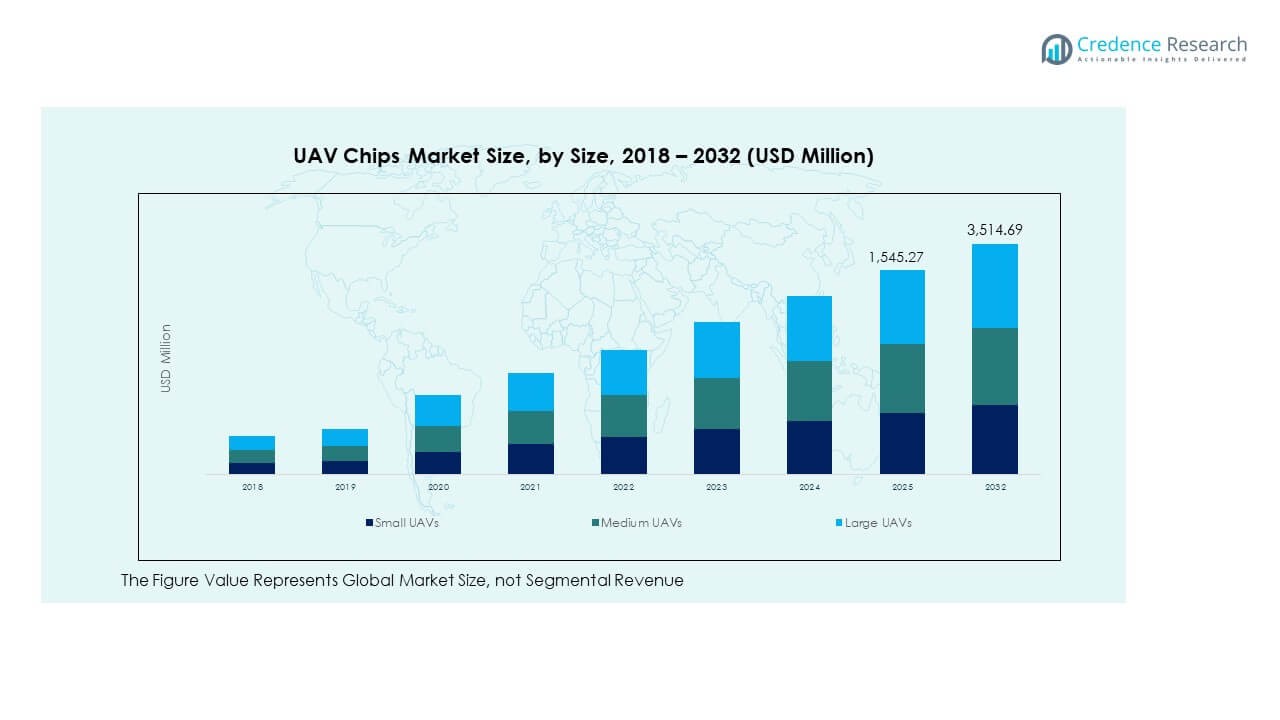
The UAV chips market worldwide is expected to grow with a CAGR of 9.6% during the forecast period from 2019 to 2027, starting from US$ 2.7 Bn in 2018. An unmanned aerial vehicle is a non-human pilot or passenger aircraft. UAVs — sometimes referred to as drones — may be fully or partially autonomous, but a human pilot controls them more often remotely. The chips used in these UAVs are called UAV chips. These chips are made from silicon and other semiconductor devices. There has been an increasing demand for such chips, especially since the launch of several safety norms led by the government or other safety authorities. The U.S. is anticipated to dominate the global UAV chips market owing to rising demand for UAVs, especially for recreational purposes.

Design Element 2

Access crucial information at unmatched prices!

Request your free sample report today & start making informed decisions powered by Credence Research!

Download Free Sample

CTA Design Element 3

Market Synopsis

Fixed Wing UAVs to dominate the global market throughout the forecast period

In 2018, the fixed-wing UAVs segment dominated the global UAV chips market owing to increasing sales of fixed-wing UAVs across several end-use applications. People from all age groups opting for UAVs adopt fixed-wing UAVs due to easy availability, less cost, and ease of operation. Moreover, owing to the fewer costs, fixed-wing UAVs have witnessed huge demand from commercial and military applications. This rising number of fixed-wing UAVs is, in turn, anticipated to drive the demand for UAV chips over the forecast period.

The Asia Pacific to Register the Fastest Growth

North America accounted for the largest share in revenue in 2018 and is set to retain its dominance over the forecast period. Favorable government initiatives towards drone advancement and growing demand for drone-acquired data are the major factors supporting regional market growth. In addition, the U.S. Federal Aviation Administration (FAA) has issued new regulations to provide more consistent and coherent guidance on the legal and safe operation of UAVs in commercial spaces. Such rules and regulations are expected to reduce entry barriers and increase the adoption of regional products.

Asia Pacific is projected to witness the fastest CAGR during the forecast period. Countries such as China and Japan are increasingly accepting automation and advanced technology in order to counter rising labor costs. The higher efficiency of UAVs compared to human labor is expected to boost their adoption across the region for certain tasks, particularly in the agriculture sector. Due to several favorable regulations, drone sales in Europe are steadily increasing. Companies operating in the regional market are exploring new ways of transforming their conventional business processes by taking advantage of drones’ benefits.

Some prominent players in the UAV Chips market include Qualcomm, Intel, STMicroelectronics, TI, Samsung, ATMEL, Nuvoton, XMOS, NVIDIA, and Rockchip, among others.

Historical & Forecast Period

This research report presents the analysis of each segment from 2017 to 2027, considering 2018 as the base year for the research. Compounded Annual Growth Rate (CAGR) for each respective segment calculated for the forecast period from 2019 to 2027.

Shape Your Report to Specific Countries or Regions & Enjoy 30% Off!

Report Scope by Segments

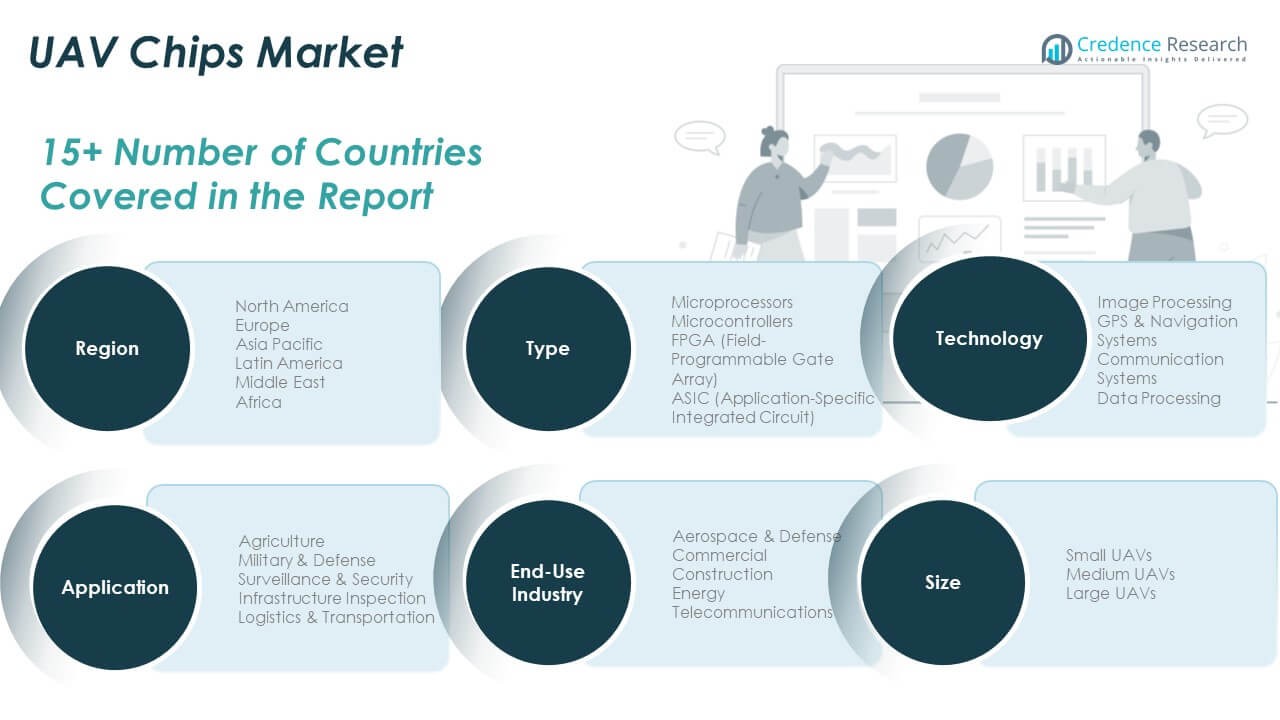
The UAV Chips market report provides market size and estimates based on market dynamics and key trends observed in the industry. In addition, the report provides a holistic view of the global UAV Chips market based on type, application, and geography. Key segments covered in the report are as follows:

Segmentation Type Segment (2017–2027; US$ Bn)

  • 8 bit
  • 16 bit
  • 32 bit
  • 64 bit

Application Segment (2017–2027; US$ Bn)

  • Fixed Wing UAV
  • Unmanned Helicopter
  • Multirotor UAV
  • Others

Geography Segment (2017–2027; US$ Bn)

  • North America (the U.S., Rest of North America)
  • Europe (U.K., Germany, France, Rest of Europe)
  • Asia Pacific (China, Japan, India, Rest of Asia Pacific)
  • Rest of the World (the Middle East & Africa, Latin America

Unique data points of this report

  • Key trends across major regions and their countries in terms of the penetration of UAV chips across different applications
  • Analysis of major developments, strategies, and winning imperatives adopted in the global UAV industry
  • Attractive investment proposition for segments as well as geography
  • Competitive landscape and profiles of major companies operating in the global UAV chips market

Chapter 1. Preface
1.1. Report Description
1.1.1. Purpose of the report
1.1.2. Target Audience
1.1.3. USP & Key Offerings
1.2. Research Scope
1.3. Market Segmentation
1.4. Research Methodology
1.4.1. Phase 1 – Secondary Research
1.4.2. Phase 2 – Primary Research
1.4.3. Phase 3 – Expert Panel Review
1.4.4. Assumptions
1.4.5. Approach Adopted

Chapter 2. Executive Summary
2.1. Market Snapshot: Global UAV Chips Market
2.2. Global UAV Chips Market, By Type, 2018 (US$ Bn)
2.3. Global UAV Chips Market, By Application, 2018 (US$ Bn)
2.4. Global UAV Chips Market, By Geography, 2018 (US$ Bn)

Chapter 3. Market Dynamics
3.1. Introduction
3.2. Market Drivers
3.3. Market Growth Inhibitors
3.3.1. Impact Analysis of Drivers and Restraints
3.4. Key Market Trends
3.5. Attractive Investment Proposition, by Geography, 2018
3.6. Competitive Analysis
3.6.1. Market Positioning of Key UAV Chips Vendors, 2018
3.6.2. Key Strategies Adopted by Leading Players

Chapter 4. Global UAV Chips Market, by Type, 2017-2027 (US$ Bn)
4.1. Overview
4.2. 8 bit
4.3. 16 bit
4.4. 32 bit
4.5. 64 bit

Chapter 5. Global UAV Chips Market, by Application, 2017-2027 (US$ Bn)
5.1. Overview
5.2. Fixed Wing UAV
5.3. Unmanned Helicopter
5.4. Multirotor UAV
5.5. Others

Chapter 6. North America UAV Chips Market Analysis, 2017-2027 (US$ Bn)
6.1. Overview
6.2. North America UAV Chips Market Analysis, by Type, 2017-2027 (US$ Bn)
6.2.1. Market Analysis
6.3. North America UAV Chips Market Analysis, by Application, 2017-2027 (US$ Bn)
6.3.1. Market Analysis
6.4. North America UAV Chips Market Analysis, by Country, 2017-2027 (US$ Bn)
6.4.1. U.S.
6.4.1.1. U.S. UAV Chips Market Analysis, by Type, 2017-2027 (US$ Bn)
6.4.1.2. U.S. UAV Chips Market Analysis, by Application, 2017-2027 (US$ Bn)
6.4.2. Rest of North America
6.4.2.1. Rest of North America UAV Chips Market Analysis, by Type, 2017-2027 (US$ Bn)
6.4.2.2. Rest of North America UAV Chips Market Analysis, by Application, 2017-2027 (US$ Bn)

Chapter 7. Europe UAV Chips Market Analysis, 2017-2027 (US$ Bn)
7.1. Overview
7.2. Europe UAV Chips Market Analysis, by Type, 2017-2027 (US$ Bn)
7.2.1. Market Analysis
7.3. Europe UAV Chips Market Analysis, by Application, 2017-2027 (US$ Bn)
7.3.1. Market Analysis
7.4. Europe UAV Chips Market Analysis, by Country, 2017-2027 (US$ Bn)
7.4.1. Germany
7.4.1.1. Germany UAV Chips Market Analysis, by Type, 2017-2027 (US$ Bn)
7.4.1.2. Germany UAV Chips Market Analysis, by Application, 2017-2027 (US$ Bn)
7.4.2. UK
7.4.2.1. UK UAV Chips Market Analysis, by Type, 2017-2027 (US$ Bn)
7.4.2.2. UK UAV Chips Market Analysis, by Application, 2017-2027 (US$ Bn)
7.4.3. France
7.4.3.1. France UAV Chips Market Analysis, by Type, 2017-2027 (US$ Bn)
7.4.3.2. France UAV Chips Market Analysis, by Application, 2017-2027 (US$ Bn)
7.4.4. Italy
7.4.4.1. Italy UAV Chips Market Analysis, by Type, 2017-2027 (US$ Bn)
7.4.4.2. Italy UAV Chips Market Analysis, by Application, 2017-2027 (US$ Bn)
7.4.5. Rest of Europe
7.4.5.1. Rest of Europe UAV Chips Market Analysis, by Type, 2017-2027 (US$ Bn)
7.4.5.2. Rest of Europe UAV Chips Market Analysis, by Application, 2017-2027 (US$ Bn)

Chapter 8. Asia-Pacific UAV Chips Market Analysis, 2017-2027 (US$ Bn)
8.1. Overview
8.2. Asia-Pacific UAV Chips Market Analysis, by Type, 2017-2027 (US$ Bn)
8.2.1. Market Analysis
8.3. Asia-Pacific UAV Chips Market Analysis, by Application, 2017-2027 (US$ Bn)
8.3.1. Market Analysis
8.4. Asia-Pacific UAV Chips Market Analysis, by Country, 2017-2027 (US$ Bn)
8.4.1. China
8.4.1.1. China UAV Chips Market Analysis, by Type, 2017-2027 (US$ Bn)
8.4.1.2. China UAV Chips Market Analysis, by Application, 2017-2027 (US$ Bn)
8.4.2. India
8.4.2.1. India UAV Chips Market Analysis, by Type, 2017-2027 (US$ Bn)
8.4.2.2. India UAV Chips Market Analysis, by Application, 2017-2027 (US$ Bn)
8.4.3. Japan
8.4.3.1. Japan UAV Chips Market Analysis, by Type, 2017-2027 (US$ Bn)
8.4.3.2. Japan UAV Chips Market Analysis, by Application, 2017-2027 (US$ Bn)
8.4.4. Rest of Asia-Pacific
8.4.4.1. Rest of Asia-Pacific UAV Chips Market Analysis, by Type, 2017-2027 (US$ Bn)
8.4.4.2. Rest of Asia-Pacific UAV Chips Market Analysis, by Application, 2017-2027 (US$ Bn)

Chapter 9. RoW UAV Chips Market Analysis, 2017-2027 (US$ Bn)
9.1. Overview
9.2. RoW UAV Chips Market Analysis, by Type, 2017-2027 (US$ Bn)
9.2.1. Market Analysis
9.3. RoW UAV Chips Market Analysis, by Application, 2017-2027 (US$ Bn)
9.3.1. Market Analysis
9.4. RoW UAV Chips Market Analysis, by Country, 2017-2027 (US$ Bn)
9.4.1. MEA
9.4.1.1. MEA UAV Chips Market Analysis, by Type, 2017-2027 (US$ Bn)
9.4.1.2. MEA UAV Chips Market Analysis, by Application, 2017-2027 (US$ Bn)
9.4.2. Latin America
9.4.2.1. Latin America UAV Chips Market Analysis, by Type, 2017-2027 (US$ Bn)
9.4.2.2. Latin America UAV Chips Market Analysis, by Application, 2017-2027 (US$ Bn)

Chapter 10. Company Profiles
10.1. Qualcomm
10.2. STMicroelectronics
10.3. Intel
10.4. NVIDIA
10.5. TI
10.6. Samsung
10.7. ATMEL
10.8. Nuvoton
10.9. XMOS
10.10. Rockchip


List of Figures

Figure 01: Global UAV Chips Market Segmentation
Figure 02: Global UAV Chips Market Research Methodology
Figure 03: Top Down and Bottom Up Approach
Figure 04: Global UAV Chips, by Type, 2018 (US$ Bn)
Figure 05: Global UAV Chips, by Application, 2018 (US$ Bn)
Figure 06: Global UAV Chips, by Geography, 2018 (US$ Bn)
Figure 07: Global UAV Chips Market Value, 2017-2027, (US$ Bn)
Figure 08: Active Investment Proposition, By Geography
Figure 09: Market Positioning of Key UAV Chips Vendors, 2018
Figure 10: Global UAV Chips Market Value Contribution, By Type, 2018 & 2027 (%)
Figure 11: Global UAV Chips Market Value Contribution, By Application, 2018 & 2027 (%)
Figure 12: North America UAV Chips Market Value, 2017-2027 (US$ Bn)
Figure 13: Europe UAV Chips Market Value, 2017-2027 (US$ Bn)
Figure 14: Asia-Pacific UAV Chips Market Value, 2017-2027 (US$ Bn)
Figure 15: RoW UAV Chips Market Value, 2017-2027 (US$ Bn)

List of Tables

Table 01: Market Snapshot: Global UAV Chips Market
Table 02: Impact Indicators
Table 03: Impact Analysis of Drivers and Restraints
Table 04: North America UAV Chips Market, By Type, 2017-2027 (USD$ Bn)
Table 05: North America UAV Chips Market, By Application, 2017-2027 (USD$ Bn)
Table 06: North America UAV Chips Market, By Country, 2017-2027 (USD$ Bn)
Table 07: U.S. UAV Chips Market, By Type, 2017-2027 (USD$ Bn)
Table 08: U.S. UAV Chips Market, By Application, 2017-2027 (USD$ Bn)
Table 09: Rest of North America UAV Chips Market, By Type, 2017-2027 (USD$ Bn)
Table 10: Rest of North America UAV Chips Market, By Application, 2017-2027 (USD$ Bn)
Table 11: Europe UAV Chips Market, By Type, 2017-2027 (USD$ Bn)
Table 12: Europe UAV Chips Market, By Application, 2017-2027 (USD$ Bn)
Table 13: Europe UAV Chips Market, By Country, 2017-2027 (USD$ Bn)
Table 14: Germany UAV Chips Market, By Type, 2017-2027 (USD$ Bn)
Table 15: Germany UAV Chips Market, By Application, 2017-2027 (USD$ Bn)
Table 16: UK UAV Chips Market, By Type, 2017-2027 (USD$ Bn)
Table 17: UK UAV Chips Market, By Application, 2017-2027 (USD$ Bn)
Table 18: France UAV Chips Market, By Type, 2017-2027 (USD$ Bn)
Table 19: France UAV Chips Market, By Application, 2017-2027 (USD$ Bn)
Table 20: Italy UAV Chips Market, By Type, 2017-2027 (USD$ Bn)
Table 21: Italy UAV Chips Market, By Application, 2017-2027 (USD$ Bn)
Table 22: Rest of Europe UAV Chips Market, By Type, 2017-2027 (USD$ Bn)
Table 23: Rest of Europe UAV Chips Market, By Application, 2017-2027 (USD$ Bn)
Table 24: Asia-Pacific UAV Chips Market, By Type, 2017-2027 (USD$ Bn)
Table 25: Asia-Pacific UAV Chips Market, By Application, 2017-2027 (USD$ Bn)
Table 26: Asia-Pacific UAV Chips Market, By Country, 2017-2027 (USD$ Bn)
Table 27: China UAV Chips Market, By Type, 2017-2027 (USD$ Bn)
Table 28: China UAV Chips Market, By Application, 2017-2027 (USD$ Bn)
Table 29: India UAV Chips Market, By Type, 2017-2027 (USD$ Bn)
Table 30: India UAV Chips Market, By Application, 2017-2027 (USD$ Bn)
Table 31: Japan UAV Chips Market, By Type, 2017-2027 (USD$ Bn)
Table 32: Japan UAV Chips Market, By Application, 2017-2027 (USD$ Bn)
Table 33: Rest of Asia-Pacific UAV Chips Market, By Type, 2017-2027 (USD$ Bn)
Table 34: Rest of Asia-Pacific UAV Chips Market, By Application, 2017-2027 (USD$ Bn)
Table 35: RoW UAV Chips Market, By Type, 2017-2027 (USD$ Bn)
Table 36: RoW UAV Chips Market, By Application, 2017-2027 (USD$ Bn)
Table 37: RoW UAV Chips Market, By Country, 2017-2027 (USD$ Bn)
Table 38: MEA UAV Chips Market, By Type, 2017-2027 (USD$ Bn)
Table 39: MEA UAV Chips Market, By Application, 2017-2027 (USD$ Bn)
Table 40: Latin America UAV Chips Market, By Type, 2017-2027 (USD$ Bn)
Table 41: Latin America UAV Chips Market, By Application, 2017-2027 (USD$ Bn)
Table 42: Qualcomm: Company Snapshot (Company Details, Geographical Presence, Product Portfolio, Recent Developments)
Table 43: STMicroelectronics: Company Snapshot (Company Details, Geographical Presence, Product Portfolio, Recent Developments)
Table 44: Intel: Company Snapshot (Company Details, Geographical Presence, Product Portfolio, Recent Developments)
Table 45: NVIDIA: Company Snapshot (Company Details, Geographical Presence, Product Portfolio, Recent Developments)
Table 46: TI: Company Snapshot (Company Details, Geographical Presence, Product Portfolio, Recent Developments)
Table 47: Samsung: Company Snapshot (Company Details, Geographical Presence, Product Portfolio, Recent Developments)
Table 48: ATMEL: Company Snapshot (Company Details, Geographical Presence, Product Portfolio, Recent Developments)
Table 49: Nuvoton: Company Snapshot (Company Details, Geographical Presence, Product Portfolio, Recent Developments)
Table 50: Acsoon: Company Snapshot (Company Details, Geographical Presence, Product Portfolio, Recent Developments)
Table 51: Qualcomm0: Company Snapshot (Company Details, Geographical Presence, Product Portfolio, Recent Developments)

Frequently asked questions :

What is the size of UAV Chips Market?

The market for UAV Chips Market is expected to reach US$ XX Bn in 2027.

What is the UAV Chips Market CAGR?

The UAV Chips Market is expected to see significant CAGR growth over the coming years, at 9.6%.

What is the Forecast period considered for UAV Chips Market?

The report is forecasted from 2019-2027.

What is the base year considered for UAV Chips Market?

The base year of this report is 2018.

Who are the major players in this market?

Qualcomm, STMicroelectronics, Intel, NVIDIA, TI are some of the major players in the global market.

Global Quantum Sensors Market

Published:
Report ID: 6041

North America Laser Processing Equipment Market

Published:
Report ID: 50533

Wearable Digital Walkie Talkie Market

Published:
Report ID: 50577

Tankless Water Heater Market

Published:
Report ID: 50130

Refurbished Electronics Market

Published:
Report ID: 50226

Water Electrolysis Market

Published:
Report ID: 50222

General Electrical Equipment And Components Market

Published:
Report ID: 33107

Oven Controlled Crystal Oscillator Market

Published:
Report ID: 49938

Residential Electric Underfloor Heating Market

Published:
Report ID: 49927

Traditional Music Market

Published:
Report ID: 49827

France PoP Display Market

Published:
Report ID: 49623

Europe PoP Display Market

Published:
Report ID: 38419

Purchase Options

The report comes as a view-only PDF document, optimized for individual clients. This version is recommended for personal digital use and does not allow printing.
$3699

To meet the needs of modern corporate teams, our report comes in two formats: a printable PDF and a data-rich Excel sheet. This package is optimized for internal analysis and multi-location access, making it an excellent choice for organizations with distributed workforce.
$4699

The report will be delivered in printable PDF format along with the report’s data Excel sheet. This license offers 100 Free Analyst hours where the client can utilize Credence Research Inc.’s research team. It is highly recommended for organizations seeking to execute short, customized research projects related to the scope of the purchased report.
$6699

Smallform of Sample request

Have a question?

User Profile

Don’t settle for less – trust Mitul to help you find the best solution.

Report delivery within 24 to 48 hours

– Other Info –

What people say?-

User Review

I am very impressed with the information in this report. The author clearly did their research when they came up with this product and it has already given me a lot of ideas.

Jana Schmidt
CEDAR CX Technologies

– Connect with us –

Phone

+91 6232 49 3207


support

24/7 Research Support


sales@credenceresearch.com

– Research Methodology –

Going beyond the basics: advanced techniques in research methodology

– Trusted By –

Pepshi, LG, Nestle
Motorola, Honeywell, Johnson and johnson
LG Chem, SIEMENS, Pfizer
Unilever, Samsonite, QIAGEN