
| REPORT ATTRIBUTE | DETAILS |
|---|---|
| Historical Period | 2020-2023 |
| Base Year | 2024 |
| Forecast Period | 2025-2032 |
| Meso Erythritol Market Size 2024 | USD 342.4 Million |
| Meso Erythritol Market, CAGR | 3.90% |
| Meso Erythritol Market Size 2032 | USD 465.0 Million |
Market Overview
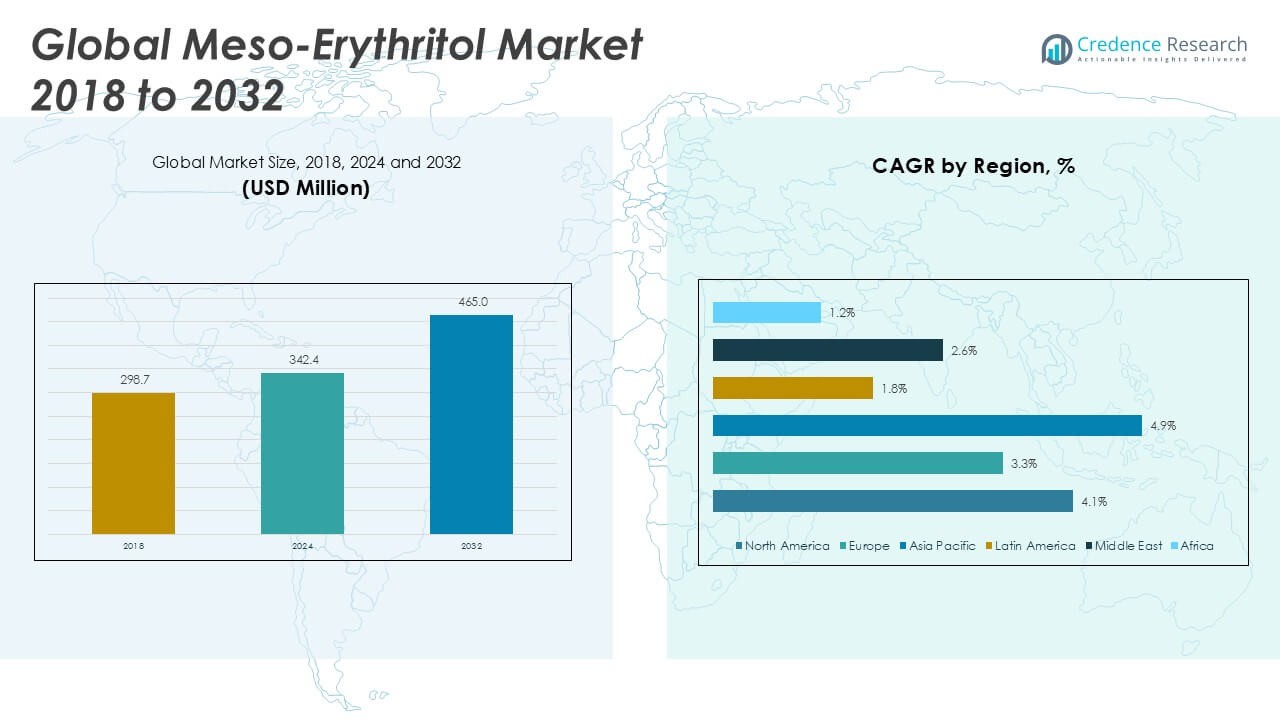
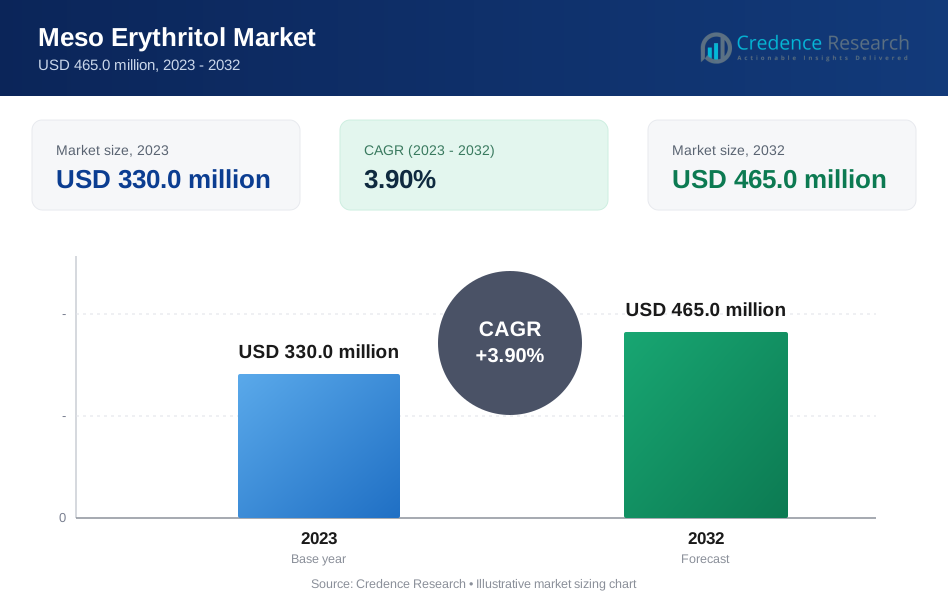
The Global Meso Erythritol Market is projected to grow from USD 342.4 million in 2024 to an estimated USD 465.0 million by 2032, reflecting a compound annual growth rate (CAGR) of 3.90% from 2025 to 2032.
Health concerns related to excessive sugar intake and rising prevalence of diabetes drive adoption of erythritol as a sugar substitute. Clean-label trends encourage naturally derived sweeteners in baked goods, dairy products, and nutraceuticals. Partnerships between ingredient suppliers and food manufacturers spur product innovations and broaden application portfolios. The shift toward e-commerce and direct-to-consumer sales channels accelerates market reach and product accessibility. Favorable regulatory approvals and labeling standards in key regions reinforce industry growth.
North America holds the largest market share, driven by strong consumer awareness and well-established food and beverage infrastructure. Asia Pacific exhibits the fastest growth rate on account of rising disposable incomes, expanding retail channels, and increasing adoption of functional foods in China, India, and Japan. Europe maintains steady growth supported by health-oriented regulations and sustainability initiatives. Key players operating across the value chain include Cargill, Jungbunzlauer, Ingredion, Matsutani Chemical Industry, and Weishardt International, all of which focus on strategic collaborations and new product launches to strengthen regional presence.
Market Insights
- The Global Meso Erythritol Market is projected to grow from USD 342.4 million in 2024 to USD 465.0 million by 2032, at a CAGR of 3.90%.
- Rising health awareness and demand for zero-calorie sweeteners fuel its adoption in functional foods and beverages.
- Clean-label trends and diabetic-friendly diets support the growing use of erythritol in natural product formulations.
- High production costs and volatility in raw material prices limit profitability for small-scale manufacturers.
- Regulatory complexities and inconsistent global labeling standards hinder faster product expansion.
- North America leads the market with a 34.2% share, supported by strong consumer awareness and mature food processing industries.
- Asia Pacific shows the highest growth rate of 4.9%, driven by rising disposable incomes, health-focused diets, and retail expansion.
Market Drivers
Increasing Consumer Demand for Low-Calorie Sweeteners
The Global Meso Erythritol Market benefits from growing health awareness. Consumers seek alternatives to sugar for weight management and glycemic control. It provides zero-calorie sweetness without aftertaste. Diabetic patients prefer it over other substitutes. Regulators endorse it through favorable approvals. Public health campaigns underscore sugar reduction in diets. Food companies respond with reformulated recipes.
- For instance, according to the International Food Information Council’s 2024 survey, over 38,000 new food and beverage products launched globally in the past year featured low- or no-calorie sweeteners, with erythritol being a leading ingredient in these formulations.
Expansion of Food and Beverage Applications Across Product Segments
The Global Meso Erythritol Market finds increased use in bakery, dairy, and confectionery sectors. It enables cleaner-label claims on packaging. Manufacturers introduce new snacks, beverages, and nutraceuticals with it. Bakery firms highlight its heat stability for baked goods. Beverage developers choose it for clear drinks. Nutraceutical brands exploit its mouthfeel and sweetness profile. Strategic launches boost product portfolios.
- For instance, Mintel’s Global New Products Database recorded more than 2,700 new bakery and confectionery products containing erythritol introduced across North America, Europe, and Asia in 2024, illustrating its growing application in diverse food segments.
Technological Improvements in Fermentation Processes Enhance Production
The Global Meso Erythritol Market benefits from optimized fermentation techniques. Engineers apply high-yield microbial strains to reduce costs. It achieves greater purity levels through refined downstream operations. Producers adopt continuous bioreactors for consistent throughput. Quality control labs implement real-time monitoring. Supply chain managers secure raw materials with traceability systems. Investment in process upgrades cuts lead times.
Strategic Partnerships and Digital Channels Expand Market Reach
The Global Meso Erythritol Market leverages partnerships with food-ingredient distributors. It reaches niche consumers through e-commerce platforms. Marketing teams deploy targeted campaigns on social-media channels. Distributors collaborate on promotional bundles to enhance sales. Industry alliances share research data to refine formulations. Retailers feature erythritol-based products in health sections. Collaborative efforts reinforce brand visibility.
Market Trends
Adoption of Clean-Label Products Fuels Market Growth
The Global Meso Erythritol Market reflects rising clean-label demands among health-conscious consumers. It drives companies to replace synthetic additives with naturally derived sweeteners. Food brands highlight erythritol in label claims to attract buyers who avoid sugars. Health-focused retailers dedicate shelf space to low-calorie products. Regulatory bodies approve it under safe-status guidelines, reinforcing trust. Manufacturers promote transparent sourcing to build brand credibility.
- For instance, in a 2023 FDA survey of U.S. food manufacturers, 1,200 new product launches featured meso erythritol as a primary sweetener, with health-focused retailers stocking over 500 erythritol-based products in their low-calorie categories.
Expansion of Application Portfolio Through Product Innovation
The Global Meso Erythritol Market experiences growth through novel formulation techniques. It enables confectionery producers to refine sweetness profiles. R\&D teams collaborate on blend development with other polyols. Food scientists test functionality in varied pH conditions. Consumer trials yield data that guide recipe adjustments. Launches of diverse erythritol-based snacks highlight trend.
- For instance, according to a 2022 industry report, a leading confectionery company introduced 15 new erythritol-based snack products after successful consumer trials involving over 2,000 participants, driving expanded shelf presence across major retail chains.
Integration of Advanced Supply Chain Technologies
The Global Meso Erythritol Market leverages real-time tracking systems to secure raw material shipments. It reduces inventory risks by forecasting demand patterns. Procurement teams analyze data to optimize supplier performance. Quality control protocols apply batch-level traceability. Logistics partners adopt temperature-monitoring solutions to preserve purity. Collaborative platforms streamline order management.
Shift Toward Sustainable Production and Circular Economy Principles
The Global Meso Erythritol Market commits to waste reduction through process optimization. It applies bioreactor recycling methods to minimize resource use. Green chemistry principles guide solvent selection. Corporate sustainability reports disclose carbon footprint metrics. Stakeholders support renewable energy integration at manufacturing sites. Investors reward firms that demonstrate environmental stewardship.
Market Challenges
High Production Cost and Feedstock Price Volatility Challenge
The Global Meso Erythritol Market faces pressure from elevated production expenses and unstable raw material prices. Manufacturers must absorb high costs for refined glucose substrates and specialized enzymes. It struggles to maintain competitive pricing against sugar and other polyols. Profit margins shrink when feedstock suppliers raise rates. Quality control requirements demand advanced equipment and trained personnel. Smaller producers risk exit when they cannot invest in efficient bioprocessing technology.
- For instance, non-compliance with certification requirements can delay product approvals by an average of 6 months, and a study by the University of Maryland Medical Center revealed that nearly 40% of commercially available essential oils failed purity tests, highlighting the regulatory and quality control challenges faced by market participants
Strict Regulatory Scrutiny and Market Penetration Barriers
The Global Meso Erythritol Market contends with complex approval processes across regions. Regulatory agencies enforce rigorous safety and purity standards for novel food ingredients. It takes lengthy approval timelines before product launches in new territories. Labeling rules vary by country and can hinder cross-border distribution. Incumbent sweetener suppliers lobby to slow approvals of alternatives. Limited consumer education on erythritol may restrain trial and adoption.
Market Opportunities
Emerging Health-Conscious Consumer Segments Offer Expansion Potential
The Global Meso Erythritol Market can tap into health-focused product lines. It meets sugar reduction goals for diabetic and fitness consumers. Retailers promote low-calorie options in grocery chains. Food manufacturers integrate it in protein bars, sports drinks, and meal replacements. Strong interest in natural ingredients fuels trial adoption. Collaborative marketing campaigns can educate end users. Strategic branding can position it as premium sweetener.
Strategic Partnerships and Technological Innovations Unlock Production Scalability
The Global Meso Erythritol Market benefits from joint ventures with biotechnology firms. It gains from advanced bioreactor designs that cut cycle times and lower waste. Contract manufacturers provide flexible capacity to meet different demand levels. Investment in process control systems ensures consistent quality. Expanded facility networks reduce lead times for regional customers. Analytical labs support formulation refinement and ensure compliance. Shared R\&D efforts drive cost savings and faster market entry.
Market Segmentation Analysis
By Type
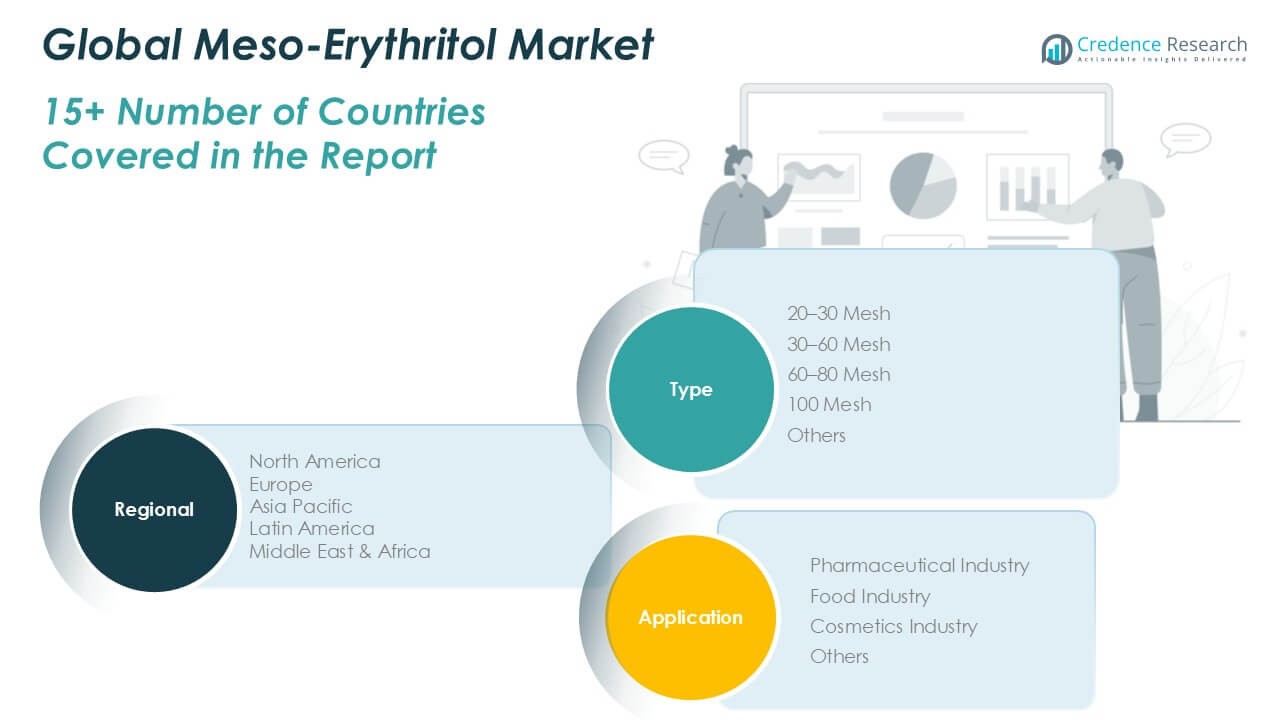
The Global Meso Erythritol Market provides detailed insights by particle size categories. 20–30 mesh leads volume share due to balanced sweetness release and production efficiency. It supports broad applications in powdered blends and low-cost formulations. 30–60 mesh secures significant revenue share thanks to its widespread use in confectionery and bakery mixes. 60–80 mesh finds niche appeal in specialty products requiring smooth mouthfeel. 100 mesh commands premium pricing for high-purity grades in sensitive applications. Other mesh sizes serve niche segments with tailored performance characteristics. Quality control protocols ensure consistency across all grades and batch deliveries.
- For instance, according to a 2024 production audit by Cargill, the company processed over 15,000 metric tons of 20–30 mesh erythritol for use in global powdered beverage and sweetener blends.
By Application
The Global Meso Erythritol Market segmentation by application reveals diverse end-user industries. Pharmaceutical companies adopt erythritol as an inert excipient and bulking agent in tablet and capsule formulations. It meets strict purity standards and supports controlled-release profiles. Food industry players integrate it into bakery, beverage, and confectionery products to reduce caloric content. Cosmetics brands include it in oral-care and skincare formulations for humectant properties. Other applications encompass nutraceuticals, animal feed supplements, and specialty chemical uses. Collaborative R\&D efforts drive tailored formulations that align with clean-label and health-oriented consumer trends.
- For instance, a 2023 survey by the International Food Additives Council (IFAC) reported that more than 2,200 food and beverage manufacturers worldwide used erythritol in their low-calorie product lines.
Segments
Based on Type
- 20–30 Mesh
- 30–60 Mesh
- 60–80 Mesh
- 100 Mesh
- Others
Based on Application
- Pharmaceutical Industry
- Food Industry
- Cosmetics Industry
- Others
Based on Region
- North America
- U.S.
- Canada
- Mexico
- Europe
- UK
- France
- Germany
- Italy
- Spain
- Russia
- Belgium
- Netherlands
- Austria
- Sweden
- Poland
- Denmark
- Switzerland
- Rest of Europe
- Asia Pacific
- China
- Japan
- South Korea
- India
- Australia
- Thailand
- Indonesia
- Vietnam
- Malaysia
- Philippines
- Taiwan
- Rest of Asia Pacific
- Latin America
- Brazil
- Argentina
- Peru
- Chile
- Colombia
- Rest of Latin America
- Middle East
- UAE
- KSA
- Israel
- Turkey
- Iran
- Rest of Middle East
- Africa
- Egypt
- Nigeria
- Algeria
- Morocco
- Rest of Africa
Regional Analysis
North America Meso Erythritol Market
North America Meso Erythritol Market held USD 117.1 million in 2024 and will reach USD 143.2 million by 2032 at a CAGR of 4.1%. It accounted for roughly 34.2% share in 2024. Strong consumer awareness of low-calorie sweeteners drives demand. Manufacturers invest in fermentation capacity to meet regional needs. Regulatory approvals remain favorable. Distribution networks ensure broad availability through retail and e-commerce.
Europe Meso Erythritol Market
Europe Meso Erythritol Market recorded USD 75.0 million in 2024 and will expand to USD 91.1 million by 2032 at a CAGR of 3.3%. It held about 21.9% of the global market in 2024. Stringent sugar reduction regulations push food manufacturers to use erythritol. Producers develop partnerships with bakery and confectionery brands. Quality control standards support high-purity grades. Supply chains operate across EU member states.
Asia Pacific Meso Erythritol Market
Asia Pacific Meso Erythritol Market reached USD 100.0 million in 2024 and is projected to hit USD 160.4 million by 2032 at a CAGR of 4.9%. It captured around 29.2% market share in 2024. Rising urbanization and disposable incomes fuel demand for functional foods. It benefits from expanding retail chains and direct-to-consumer platforms. R\&D centers in China and India optimize production processes. Local regulations approve erythritol for food and pharmaceutical uses.
Latin America Meso Erythritol Market
Latin America Meso Erythritol Market stood at USD 17.5 million in 2024 and will grow to USD 27.9 million by 2032 at a CAGR of 1.8%. It represented nearly 5.1% share in 2024. Urban populations in Brazil and Mexico drive demand for low-sugar products. Manufacturers partner with distributors to enter niche markets. Supply chain improvements reduce lead times. Regulatory bodies slowly adopt erythritol approvals for diverse applications.
Middle East Meso Erythritol Market
Middle East Meso Erythritol Market recorded USD 21.9 million in 2024 and is expected to reach USD 32.1 million by 2032 at a CAGR of 2.6%. It held about 6.4% of the global market in 2024. Health and wellness trends influence product launches in GCC countries. It relies on imports due to limited local production capacities. Strategic alliances with global suppliers secure consistent supply. Retail expansion in Saudi Arabia and UAE boosts availability.
Africa Meso Erythritol Market
Africa Meso Erythritol Market reached USD 11.0 million in 2024 and will slightly decline to USD 10.2 million by 2032 at a CAGR of 1.2%. It accounted for roughly 3.2% share in 2024. Limited awareness and higher costs restrict market penetration. Import dependencies increase product prices. It benefits from regional food processing investments. Government-led health initiatives may improve adoption rates.
Key players
- Cargill, Incorporated
- Archer Daniels Midland Company (ADM)
- Jungbunzlauer Suisse AG
- Roquette Frères
- Tate & Lyle PLC
- Ingredion Incorporated
- Zibo ZhongShi GeRui Biotech Co., Ltd.
- Shandong Sanyuan Biotechnology Co., Ltd.
- Mitsubishi Chemical Corporation
- Baolingbao Biology Co., Ltd.
- Anhui FQ Biological Technology Co., Ltd.
- Zhejiang Huakang Pharmaceutical Co., Ltd.
- NovaGreen, Inc.
- Shandong Shengtai Pharmaceutical Co., Ltd.
Competitive Analysis
The Meso Erythritol Market shows high concentration among global ingredient producers that leverage scale and integrated supply chains to secure raw materials. It pits established players like Cargill and ADM against specialty firms such as Jungbunzlauer and Roquette, which emphasize purity and customized grades. Tier-one companies invest in fermentation capacity expansions and process control systems to lower unit costs and strengthen margins. Regional biotechnology firms from China focus on cost leadership through local substrate sourcing and streamlined operations. Tate & Lyle and Ingredion differentiate through co-development agreements with food and beverage brands, creating exclusive formulations. Smaller players such as NovaGreen adopt niche strategies by serving pharmaceutical excipient segments that demand stringent quality. Competitive dynamics center on capacity utilization, production efficiency, and speed to market for novel applications. Continuous process improvements and strategic alliances will determine leadership positions.
Recent Developments
- On February 4, 2025, ADM reported its fourth-quarter and full-year 2024 results, with net earnings of $1.8 billion and adjusted net earnings of $2.3 billion. The company announced targeted actions to deliver $500–$750 million in cost savings and increased its quarterly dividend.
- On March 21, 2025, Roquette released its 2024 full-year results, confirmed by the Board of Directors, highlighting a rise in sales volume due to market recovery and the company's strategic focus on maintaining market leadership in its region.
Market Concentration and Characteristics
The Meso Erythritol Market displays moderate to high concentration among leading global ingredient suppliers such as Cargill, ADM and Jungbunzlauer. It features integrated supply chains and significant capital requirements for fermentation facilities. It demands stringent quality control and regulatory compliance. Scale advantages grant established players pricing power and market access. Smaller producers compete in niche pharmaceutical and specialty segments. Customers prioritize consistent product grades and transparency in sourcing. Barriers to entry include high feedstock costs and bioprocess expertise. Technological advances in process optimization can shift competitive balance.
Report Coverage
The research report offers an in-depth analysis based on Type, Application and Region. It details leading market players, providing an overview of their business, product offerings, investments, revenue streams, and key applications. Additionally, the report includes insights into the competitive environment, SWOT analysis, current market trends, as well as the primary drivers and constraints. Furthermore, it discusses various factors that have driven market expansion in recent years. The report also explores market dynamics, regulatory scenarios, and technological advancements that are shaping the industry. It assesses the impact of external factors and global economic changes on market growth. Lastly, it provides strategic recommendations for new entrants and established companies to navigate the complexities of the market.
Future Outlook
- Health-driven product innovations will expand erythritol applications. Brands will develop diabetic-friendly snacks and beverages to capture growing demand.
- Strategic capacity expansions will optimize supply. Producers will commission new fermentation units to meet rising global requirements.
- Cost reduction initiatives will enhance competitiveness. It will implement continuous bioprocessing to lower operational expenses and improve margins.
- Clean-label positioning will strengthen brand appeal. Manufacturers will highlight natural sourcing and non-GMO credentials on packaging.
- Regional production hubs will streamline logistics. Companies will establish plants in Asia Pacific and North America to reduce lead times.
- Digital marketing campaigns will boost consumer awareness. Ingredient suppliers will partner with influencers to educate on erythritol benefits.
- Regulatory harmonization will accelerate market entry. Authorities will align safety standards, enabling cross-border distribution of erythritol products.
- Collaborative R\&D projects will drive novel uses. Food scientists will explore erythritol blends with other sweeteners for tailored sweetness profiles.
- Sustainability commitments will guide raw material sourcing. Firms will adopt renewable feedstocks and report carbon metrics in annual disclosures.
- E-commerce channel growth will broaden reach. Direct-to-consumer platforms will feature erythritol as a key ingredient in health-oriented portfolios.
Request a Free Sample
Fill in your details and we'll send you a free sample report.
- Sample data tables & charts
- Research methodology
Need a Custom Version of This Report?
Tailor the scope, geography, or segments to your exact requirements.
- Custom geography or segment scope
- Direct access to our analyst team
Frequently Asked Questions
What were the market size in 2023, the forecast for 2032, and the CAGR for the Global Meso Erythritol Market?
Which factors drive demand for meso erythritol?
What major applications use meso erythritol?
Which regions lead the meso erythritol market?
What challenges restrict market growth?
Table of Content
Chapter 1. Report Introduction
- 1.1 Report Description & Purpose
- 1.1.1 Report Title & Market Definition
- 1.1.2 Unique Selling Propositions (USP) & Key Differentiators
- 1.1.3 Value Proposition for Stakeholders
- 1.2 Research Objectives
- 1.2.1 Market Sizing Objectives (Volume & Revenue)
- 1.2.2 Segmentation Objectives
- 1.2.3 Competitive Intelligence Objectives
- 1.2.4 Forecast & Scenario Objectives
- 1.3 Report Scope
- 1.3.1 Meso Erythritol Scope – Types & Subtypes Covered
- 1.3.2 Geographic Scope – Regions & Countries Covered
- 1.3.3 Historical Period, Base Year & Forecast Period (2023; forecast to 2032)
- 1.3.4 Inclusions & Exclusions
- 1.4 HS Code & Classification Framework
- 1.5 Currency, Units & Pricing Basis
- 1.6 Target Stakeholders
- 1.7 Limitations & Assumptions
Chapter 2. Executive Summary
- 2.1 Global Meso Erythritol Market Snapshot
- 2.1.1 Market Size – Historical (2023) & Forecast (2023-2032) (2023: USD 330.0 million → 2032: USD 465.0 million)
- 2.1.2 Volume & Revenue – Global Totals
- 2.1.3 Key Market Highlights – Top Five Facts
- 2.2 Meso Erythritol Market Segmentation Snapshot
- 2.2.1 Market Split by Region – 2023 vs. 2032
- 2.3 Competitive Snapshot
- 2.3.1 Top 10 Players by Revenue Share – 2023
- 2.3.2 Top 10 Players by Volume Share – 2023
- 2.3.3 Recent Strategic Developments (18-Month Summary)
- 2.4 Key Investment Highlights & Strategic Conclusions
Chapter 3. Meso Erythritol Market Dynamics & Industry Analysis
- 3.1 Market Overview & Context
- 3.1.1 Meso Erythritol Market Position in the Broader Automotive Value Chain
- 3.1.2 OEM vs. Replacement Market Dynamics
- 3.1.3 Market Maturity & Development Stage by Region
- 3.2 Meso Erythritol Market Drivers
- 3.3 Meso Erythritol Market Restraints & Challenges
- 3.4 Meso Erythritol Market Opportunities
- 3.5 Porter's Five Forces Analysis
- 3.5.1 Threat of New Entrants
- 3.5.2 Bargaining Power of Suppliers
- 3.5.3 Bargaining Power of Buyers
- 3.5.4 Threat of Substitutes
- 3.5.5 Competitive Rivalry – Intensity Assessment
- 3.6 Meso Erythritol Value Chain Analysis
- 3.6.1 Upstream – Raw Material/Input Suppliers
- 3.6.1.1 Raw Material/Input 1
- 3.6.1.2 Raw Material/Input 2
- 3.6.1.3 Raw Material/Input 3
- 3.6.2 Midstream – Production/Manufacturing/Service Delivery
- 3.6.2.1 Production/Process Overview
- 3.6.2.2 Key Facility Locations & Capacity by Manufacturer
- 3.6.3 Downstream – Distribution & End Consumer
- 3.6.3.1 Primary Channel – B2B/OEM
- 3.6.3.2 Secondary Channels – Dealer, Retail, Online, Direct
- 3.6.4 Value Chain Profitability Analysis
- 3.6.1 Upstream – Raw Material/Input Suppliers
- 3.7 PESTEL Analysis
- 3.7.1 Political Factors
- 3.7.2 Economic Factors
- 3.7.3 Social Factors
- 3.7.4 Technological Factors
- 3.7.5 Environmental Factors
- 3.7.6 Legal Factors
- 3.8 Meso Erythritol Supply Chain Analysis
- 3.8.1 Raw Material/Input Supply Risk Assessment
- 3.8.2 Manufacturing Concentration Risk (Geographic Exposure)
- 3.8.3 Trade Disruption Impact Analysis
- 3.9 Regulatory & Policy Landscape
Note: The regulatory and policy landscape section covers regulations based on their applicability to the market, Meso Erythritol category, geography, and scope of the study. Only regulatory frameworks with a material impact on operations, compliance, trade, sustainability, or market access are analyzed in detail.
Chapter 4. Key Investment Pockets & Opportunity Analysis
- 4.1 Meso Erythritol Market Attractiveness Analysis
- 4.1.1 By Region – Investment Attractiveness Matrix (Volume × CAGR)
- 4.2 Absolute Revenue Growth Opportunity
- 4.2.1 By Region – Absolute USD Growth Through 2032
- 4.3 Incremental Volume Opportunity
- 4.3.1 By Region – Incremental Volume Through 2032
- 4.3.2 Segment – Incremental Volume
- 4.4 Emerging Submarket Opportunity Deep Dive (Subject to Applicability)
- 4.5 Emerging Market Opportunity Scorecards
- 4.5.1 United States
- 4.5.2 Europe
- 4.5.3 Asia
- 4.5.4 Middle East & Africa
Note: Emerging Market Opportunity Scorecards will be included based on relevance and strategic importance. Regions listed are indicative and may vary depending on data availability and market dynamics.
Chapter 5. Meso Erythritol Import-Export Analysis & Trade Flows
- 5.1 Global Trade Overview
- 5.1.1 Global Export Value by Country (2023)
- 5.1.2 Global Export Volume by Country (2023)
- 5.1.3 Global Import Value by Country (2023)
- 5.1.4 Global Import Volume by Country (2023)
- 5.1.5 Net Trade Balance by Country (2023)
- 5.2 Export Analysis – Segment
- 5.2.1 Type 1 (HS Code)
- 5.2.2 Type 2 (HS Code)
- 5.2.3 Type 3 (HS Code)
- 5.2.4 Type 4 (HS Code)
- 5.2.5 Type 5 (HS Code)
- 5.3 Import Analysis – Segment
- 5.3.1 Type 1 (HS Code)
- 5.3.2 Type 2 (HS Code)
- 5.3.3 Type 3 (HS Code)
- 5.3.4 Type 4 (HS Code)
- 5.3.5 Type 5 (HS Code)
- 5.4 Average Unit Trade Prices
- 5.4.1 Average Export Price – Segment & Country
- 5.4.2 Average Import Price – Segment & Source Country
- 5.4.3 Price Trends (2023)
- 5.5 Key Trade Route Analysis
- 5.5.1 Trade Route 1
- 5.5.2 Trade Route 2
- 5.5.3 Trade Route 3
- 5.5.4 Trade Route 4
- 5.5.5 Trade Route 5
- 5.6 Trade Policy Impact Assessment
- 5.6.1 US Anti-Dumping & Section 301 Tariffs
- 5.6.2 EU Customs Union Impact
- 5.6.3 Major Free Trade Agreements
- 5.6.4 USMCA Rules of Origin
Note: Trade policy analysis will be included only where relevant to the Meso Erythritol market.
Chapter 6. Competitive Landscape & Company Benchmarking
- 6.1 Meso Erythritol Market Concentration & Structure
- 6.1.1 Herfindahl-Hirschman Index (HHI) – vs. 2023
- 6.1.2 Tier 1, Tier 2 & Tier 3 Market Structure
- 6.1.3 Global, Regional & Local Player Dynamics
- 6.2 Meso Erythritol Market Share Analysis – 2023
- 6.2.1 Global Revenue Share by Company
- 6.2.2 Global Volume Share by Company
- 6.2.3 Regional Revenue Share
- 6.2.4 Market Share Evolution ( vs. 2023)
- 6.2.5 OEM Segment Share by Company
- 6.2.6 Replacement Segment Share by Company
- 6.3 Production/Delivery Capacity & Facility Analysis
- 6.3.1 Global Installed Capacity
- 6.3.2 Capacity Utilization Rates
- 6.3.3 Production/Output Volume
- 6.3.4 Facility Locations & Capacity Map
- 6.3.5 Planned Capacity Additions
- 6.4 Meso Erythritol Competitive Benchmarking Matrix
- 6.4.1 Revenue, Volume, CAGR & Profitability Comparison
- 6.4.2 Channel Revenue Mix
- 6.4.3 Geographic Revenue Exposure
- 6.4.4 R&D Intensity
- 6.4.5 Sustainability Maturity
- 6.5 Strategic Developments in Meso Erythritol (Last 24 Months)
- 6.5.1 Mergers, Acquisitions & Divestments
- 6.5.2 New Meso Erythritol Launches
- 6.5.3 Facility Expansions
- 6.5.4 Strategic Alliances, Joint Ventures & Partnerships
- 6.5.5 Distribution Expansion & Market Entry
- 6.5.6 Sustainability & ESG Initiatives
- 6.6 Competitive Strategy Mapping
- 6.6.1 Leader, Challenger, Follower & Niche Classification
- 6.6.2 Pricing Strategy Comparison
- 6.6.3 Channel Strategy Matrix
Note: Strategic developments are included based on their materiality and the availability of reliable information.
Chapter 7. Global Meso Erythritol Market – By Distribution Channel
- 7.1 Segment Overview
- 7.1.1 Volume & Revenue Split by Channel (2023 & 2032)
- 7.1.2 Channel Mix Evolution (2023-2032)
Chapter 8. Regional Market Analysis – Global Overview
- 8.1 Global Regional Overview
- 8.1.1 Regional Volume Share
- 8.1.2 Regional Revenue Share
- 8.1.3 Regional Volume by Region
- 8.1.4 Regional Revenue by Region
- 8.1.5 Regional Forecast Through 2032
- 8.2 Cross-Regional Segment Analysis
- 8.2.1 By Distribution Channel
- 8.2.2 By Brand/Price Tier
Chapter 9. North America Meso Erythritol Market
- 9.1 United States
- 9.2 Canada
- 9.3 Mexico
Chapter 10. Europe Meso Erythritol Market
- 10.1 Germany
- 10.2 France
- 10.3 Italy
- 10.4 United Kingdom
- 10.5 Spain
- 10.6 Poland
- 10.7 Russia
- 10.8 Netherlands
- 10.9 Belgium
- 10.10 Sweden
- 10.11 Denmark
- 10.12 Norway
- 10.13 Rest of Europe
Chapter 11. Asia Pacific Meso Erythritol Market
- 11.1 China
- 11.2 India
- 11.3 Japan
- 11.4 South Korea
- 11.5 Thailand
- 11.6 Indonesia
- 11.7 Vietnam
- 11.8 Malaysia
- 11.9 Australia
- 11.10 Rest of Asia Pacific
Chapter 12. Latin America Meso Erythritol Market
- 12.1 Brazil
- 12.2 Argentina
- 12.3 Colombia
- 12.4 Chile
- 12.5 Rest of Latin America
Chapter 13. Middle East Meso Erythritol Market
- 13.1 Saudi Arabia
- 13.2 United Arab Emirates
- 13.3 Turkey
- 13.4 Israel
- 13.5 Iran
- 13.6 Rest of the Middle East
Chapter 14. Africa Meso Erythritol Market
- 14.1 South Africa
- 14.2 Egypt
- 14.3 Nigeria
- 14.4 Morocco
- 14.5 Rest of Africa
Chapter 15. Meso Erythritol Company Profiles
- 15.1 [Company 01]
- 15.1.1 Company Overview
- 15.1.2 Key Management Personnel
- 15.1.3 Products & Services Portfolio
- 15.1.4 Financial Performance
- 15.1.5 Key Market Focus & Geographic Presence
- 15.1.6 Recent Developments & Strategic Initiatives
Note: The company profile list is preliminary and may change based on research findings, market developments, data availability, and client requirements.
Chapter 16. Appendices
- Appendix A – List of Abbreviations & Acronyms
- Appendix B – Industry Classification Code Reference – Full Series
- Appendix C – Production & Capacity Data Tables
- Appendix D – End-Use & Demand Base Tables
- Appendix E – Consumption & Replacement Rate Assumptions
- Appendix F – ASP Reference Tables
- Appendix G – Manufacturing & Facility Database
- Appendix H – Import-Export Data Tables
- Appendix I – Regulatory Summary Tables
- Appendix J – Primary Research Participant List (Anonymized)
- Appendix K – Primary Research Questionnaire Framework
- Appendix L – Data Sources & Bibliography
- Appendix M – Market Size Divergence & Source Comparison
Chapter 17. Research Methodology
- 17.1 Research Framework & Philosophy
- 17.2 Secondary Research – Sources, Hierarchy & Data Extraction
- 17.3 Data Modeling – Bottom-Up & Top-Down Market Sizing
- 17.4 Primary Research – Stakeholder Framework, LOI & Sample Sizes
- 17.5 Forecast Methodology – Regression, Scenario & Sensitivity Analysis
- 17.6 Quality Control – Four-Layer Validation Framework
- 17.7 Limitations & Standard Assumptions
- 17.8 Disclaimer
