Market Overview:
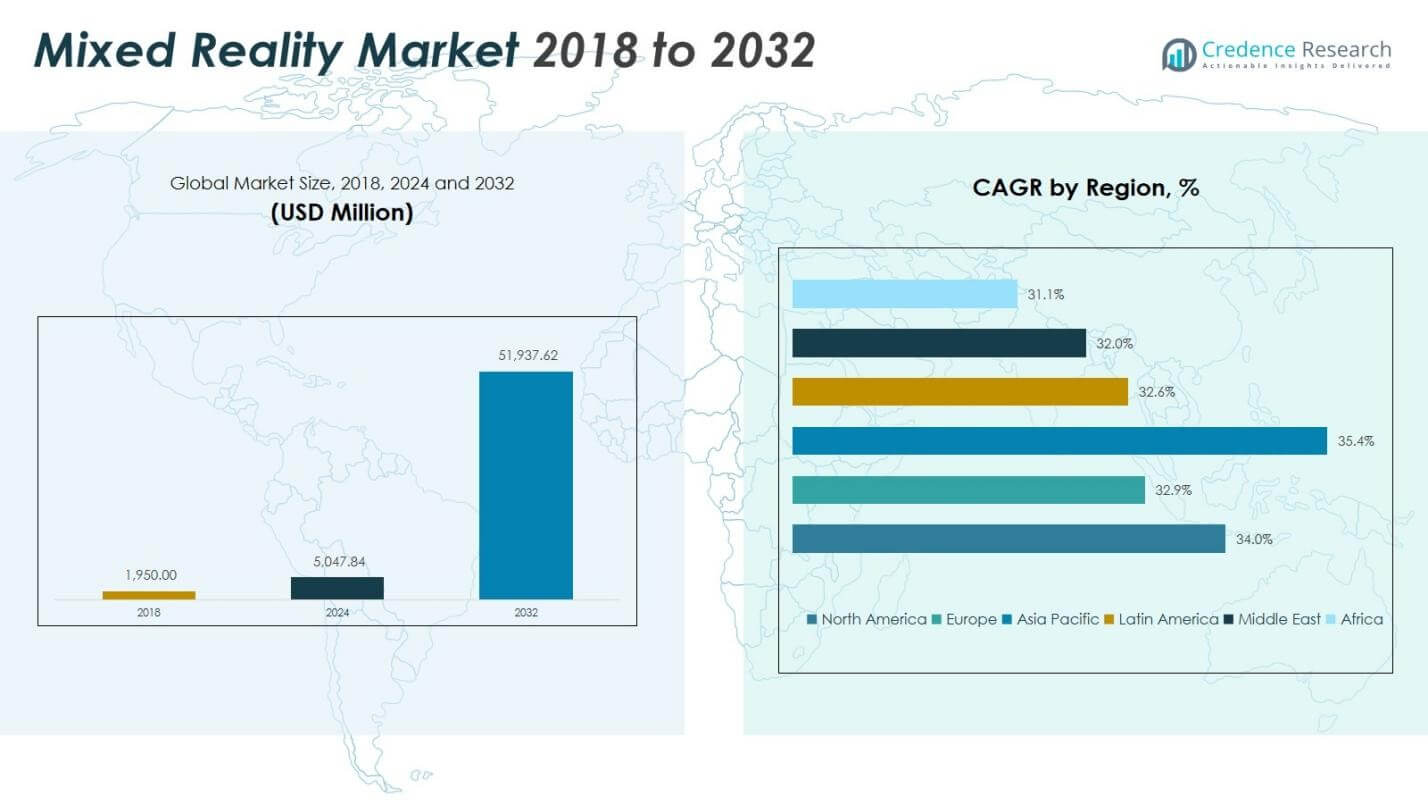
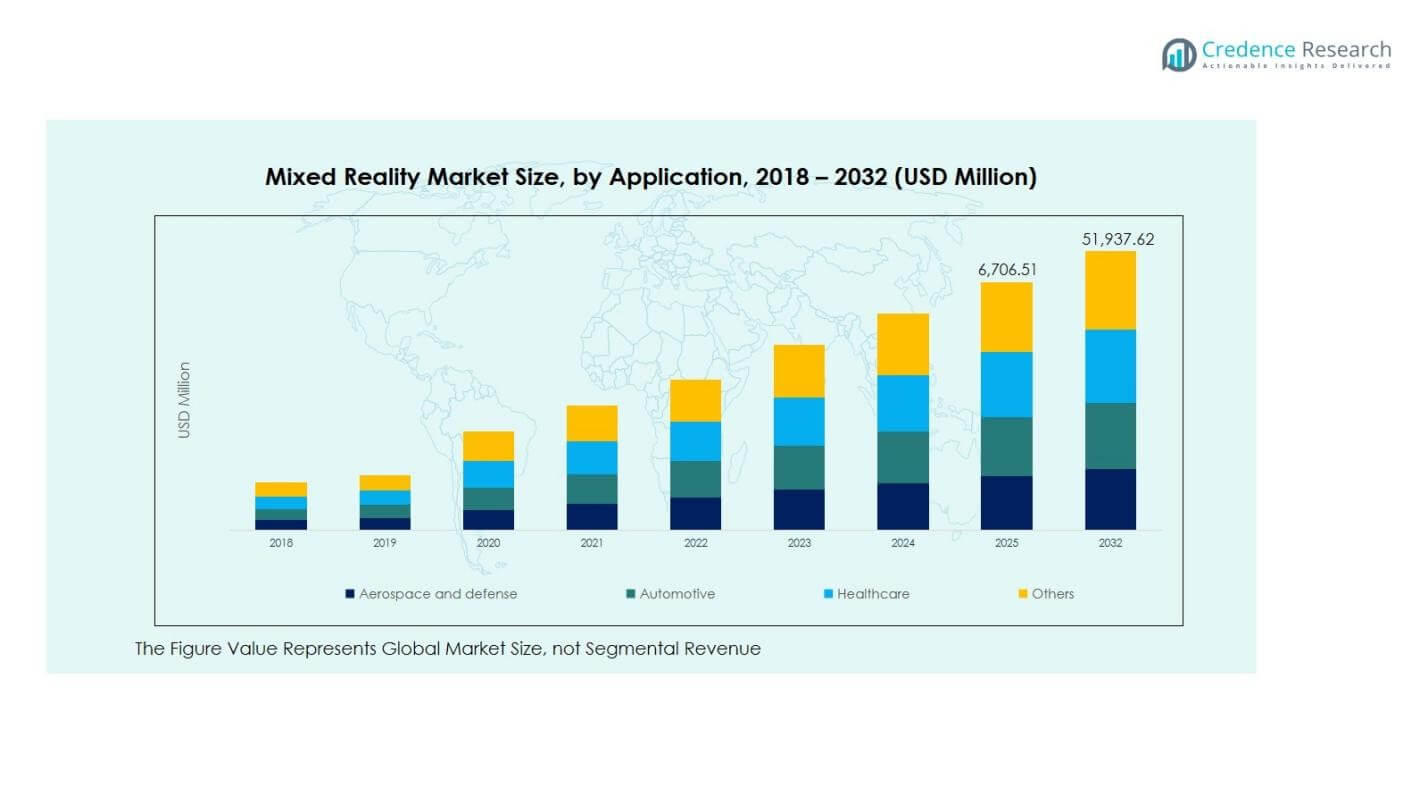
Mixed Reality Market size was valued at USD 1,950.00 Million in 2018 and USD 5,047.84 Million in 2024, and is anticipated to reach USD 51,937.62 Million by 2032, at a CAGR of 33.97% during the forecast period.
| REPORT ATTRIBUTE |
DETAILS |
| Historical Period |
2020-2023 |
| Base Year |
2024 |
| Forecast Period |
2025-2032 |
| Mixed Reality Market Size 2024 |
USD 5,047.84 million |
| Mixed Reality Market, CAGR |
33.97% |
| Mixed Reality Market Size 2032 |
USD 51,937.62 million |
Market Insights
- Growth is driven by enterprise and industrial adoption, with MR enhancing training, design visualization, maintenance, and process optimization across aerospace, automotive, and manufacturing sectors.
- Key trends include MR integration with AI and IoT, enabling real-time analytics, immersive collaboration, and adoption in retail and e-commerce for virtual try-ons and customer engagement.
- Market restraints include high implementation costs, complex infrastructure, and content interoperability issues, limiting adoption in cost-sensitive regions and slowing large-scale enterprise deployment.
- North America leads with 0% share, Asia Pacific 35.4%, Europe 32.9%, Latin America 32.6%, Middle East 32.0%, Africa 31.1%, driven by enterprise adoption and technology infrastructure.
Market Segmentation Analysis:
By Component
The Hardware segment dominated the Mixed Reality Market in 2024 with a 61.3% share, driven by rising adoption of head-mounted displays, motion-tracking devices, and advanced sensors across gaming, industrial, and healthcare applications. Innovations in lightweight designs, high-resolution displays, and precise tracking systems are accelerating enterprise and consumer deployment. The Software segment accounted for 38.7% of the market, fueled by immersive application platforms, simulation tools, and AI-integrated solutions that enhance training, design, and collaborative experiences. Growing investments in MR software development and cloud-based solutions support the segment’s robust growth during the forecast period.
- For instance, Microsoft’s HoloLens 2, featuring eye-tracking and hand gesture controls, is widely used in industrial remote collaboration and medical training.
By Application
Among applications, Gaming & Entertainment led with a 20.7% market share in 2024, driven by demand for immersive VR/AR gaming, interactive experiences, and cloud-based multiplayer platforms. The Aerospace & Defense segment held 14.5%, supported by MR-enabled simulators, mission planning, and equipment visualization. Automotive (12.8%) and Industrial & Manufacturing (11.3%) segments are expanding due to virtual prototyping, assembly line optimization, and maintenance assistance. Other segments include Education (10.2%), Healthcare (7.4%), E-Commerce & Retail (8.6%), and Others (4.6%), all benefiting from immersive visualization, enhanced training, and customer engagement solutions.
- For instance, Meta’s Quest 3 headset introduced mixed reality gameplay with over 500 VR titles, while Sony’s PlayStation VR2, launched in 2023, enhanced user immersion with 4K HDR visuals and eye-tracking.
Access crucial information at unmatched prices!
Request your sample report today & start making informed decisions powered by Credence Research Inc.!
Download Sample
Key Growth Drivers
Rising Adoption Across Enterprise and Industrial Sectors
The Mixed Reality Market is witnessing significant growth due to increasing adoption in enterprise and industrial sectors. Companies are leveraging MR solutions for training, design visualization, maintenance, and process optimization, which improves operational efficiency and reduces errors. Aerospace, automotive, and manufacturing industries deploy MR for virtual prototyping, assembly line monitoring, and predictive maintenance. MR enables real-time collaboration, allowing experts to remotely assist and guide on-site personnel. The demand for immersive technologies to reduce costs, enhance workforce productivity, and accelerate project timelines is driving sustained investment and fueling market expansion globally.
- For instance, Airbus at its Getafe plant deploys mixed reality for A330 conversions to Multi Role Tanker Transports, completing 70% of work orders mainly electrical and hydraulic installations since 2019 using Microsoft’s HoloLens 2 for holographic task guidance and documentation.
Advancements in Hardware and Software Technologies
Technological advancements in MR hardware, including head-mounted displays, sensors, haptic devices, and motion tracking systems, coupled with sophisticated software platforms, are key growth drivers. Enhanced resolution, lightweight designs, and precise tracking improve user experience across applications. Software innovations integrating AI, cloud computing, and analytics enable scalable, customizable MR experiences for enterprises and consumers. The continuous improvement of development tools, simulation platforms, and content management systems facilitates faster deployment of MR solutions. These hardware and software enhancements support immersive training, gaming, and industrial use cases, thereby driving increased market adoption and revenue growth.
- For instance, Microsoft’s HoloLens 2 leverages spatial mapping, eye tracking, and cloud connectivity through Azure Remote Rendering to deliver high-fidelity industrial training and design visualization.
Expansion in Gaming, Healthcare, and Education Applications
The growth of the MR Market is strongly supported by rising demand in gaming, healthcare, and education sectors. In gaming and entertainment, MR provides immersive 3D experiences, interactive gameplay, and social engagement. Healthcare institutions adopt MR for surgical planning, training, and patient care, improving outcomes and procedural efficiency. Educational institutions leverage MR to deliver interactive learning and remote skill-based training. Rising investments, increasing content availability, and enhanced accessibility of MR solutions in these sectors are fueling adoption. The expansion of MR in high-impact applications ensures continuous market growth and positions the technology as a transformative tool across industries.
Key Trends & Opportunities
Integration of Artificial Intelligence and IoT
The integration of MR with Artificial Intelligence (AI) and the Internet of Things (IoT) is creating significant market opportunities. AI-powered analytics, context-aware computing, and predictive insights enhance decision-making and operational efficiency across enterprises. IoT-connected devices enable real-time tracking, monitoring, and collaboration, particularly in manufacturing, healthcare, and defense applications. The synergy of MR, AI, and IoT offers interactive, data-driven environments, improving productivity, safety, and user experience. Companies are exploring these converged technologies to deliver innovative solutions, reduce downtime, and create personalized experiences, presenting lucrative opportunities for market expansion and competitive differentiation.
- For instance, in healthcare, Siemens Healthineers uses AI-powered MR visualization tools alongside connected imaging systems to assist surgeons with spatial guidance during complex procedures.
Emergence of MR in Retail and E-Commerce
Mixed Reality is transforming retail and e-commerce by providing immersive product visualization, virtual try-ons, and interactive shopping experiences. Consumers can visualize products in real-time, reducing purchase hesitation and returns, while enhancing engagement and brand loyalty. Retailers are adopting MR solutions to differentiate offerings, optimize customer journeys, and increase online and in-store sales. The rise of mobile MR applications, wearable devices, and AR-enabled marketing campaigns further drives adoption. These advancements create opportunities for MR developers to design innovative solutions that improve consumer experience and open new revenue streams, particularly in omnichannel retail environments.
- For instance, Nykaa partnered with L’Oréal to launch ModiFace, an AI-powered virtual try-on tool on its website and app for cosmetics across categories. The technology uses face-tracking to apply photo-realistic shades of lipstick, eyeshadow, and more in real-time.
Key Challenges
High Implementation Costs and Infrastructure Requirements
Despite its benefits, the Mixed Reality Market faces challenges related to high implementation costs and complex infrastructure requirements. Advanced hardware such as head-mounted displays, sensors, and computing devices, combined with software development and integration, require significant capital investment. Enterprises, especially small and medium-sized businesses, may find adoption financially challenging. Additionally, deployment in large-scale industrial or enterprise settings demands robust network infrastructure, skilled personnel, and ongoing maintenance. These factors can slow MR adoption and limit penetration in cost-sensitive markets, presenting a critical hurdle for vendors seeking widespread market expansion.
Content Development and Interoperability Issues
The development of high-quality MR content and lack of standardization across platforms present significant market challenges. Creating interactive, realistic 3D content for enterprise, educational, or entertainment applications requires specialized skills and substantial investment. Furthermore, interoperability issues between different hardware devices, software platforms, and enterprise systems hinder seamless deployment. Fragmented ecosystems and limited compatibility can restrict the scalability of MR solutions. These challenges necessitate collaborative development efforts, adherence to industry standards, and investment in adaptable content and platforms to ensure efficient integration, usability, and market growth.
Regional Analysis
North America
North America dominated the Mixed Reality Market in 2024 with a market share of 34.0%, reaching USD 1,850.51 Million from USD 723.45 Million in 2018, and is projected to reach USD 19,014.46 Million by 2032 at a CAGR of 34.0%. Growth is driven by strong adoption across aerospace, defense, automotive, and gaming sectors, supported by early technology adoption and high investments in MR hardware and software. The presence of leading technology companies, R&D initiatives, and enterprise deployment for training, simulation, and product visualization reinforces North America as a key market globally.
Europe
Europe accounted for 32.9% of the Mixed Reality Market in 2024, with revenues of USD 1,084.14 Million, up from USD 438.75 Million in 2018, and is expected to reach USD 10,426.62 Million by 2032 at a CAGR of 32.9%. Adoption is driven by industrial automation, automotive innovation, and aerospace training programs. Key European countries like Germany, the UK, and France are investing in MR for industrial applications, education, and healthcare. Strong government support, technology infrastructure, and enterprise digitization facilitate market growth and expansion across Western and Central Europe.
Asia Pacific
The Asia Pacific region held a market share of 35.4% in 2024, with a market size of USD 1,513.57 Million, growing from USD 563.55 Million in 2018, and projected to reach USD 16,947.29 Million by 2032 at a CAGR of 35.4%. Growth is fueled by rising adoption in China, Japan, India, and South Korea across gaming, education, and manufacturing applications. Increasing investments by tech giants, government initiatives for digital transformation, and expanding MR content and hardware availability drive regional expansion. Emerging economies are witnessing faster adoption due to affordable devices and increasing awareness of MR benefits.
Latin America
Latin America accounted for a 32.6% market share in 2024, reaching USD 289.70 Million, up from USD 113.10 Million in 2018, and is expected to grow to USD 2,745.94 Million by 2032 at a CAGR of 32.6%. Brazil and Argentina are key contributors, driven by adoption in industrial training, education, and emerging entertainment sectors. Growth is supported by improving digital infrastructure, rising enterprise awareness, and investments in MR solutions for immersive experiences. While adoption is slower than in North America and Asia Pacific, increasing regional investments and technology partnerships are accelerating market development.
Middle East
The Middle East held a 32.0% market share in 2024, with revenues of USD 159.48 Million, up from USD 66.30 Million in 2018, and is projected to reach USD 1,459.73 Million by 2032 at a CAGR of 32.0%. Market growth is driven by adoption in defense, oil & gas, education, and healthcare sectors. Governments in the GCC countries and Israel are investing in MR for training, simulation, and smart city projects. Rising infrastructure development, technology integration, and enterprise deployment are supporting the expansion of MR across the region.
Africa
Africa accounted for 31.1% of the Mixed Reality Market in 2024, with a market size of USD 150.45 Million, growing from USD 44.85 Million in 2018, and is expected to reach USD 1,343.59 Million by 2032 at a CAGR of 31.1%. South Africa and Egypt are leading contributors, driven by MR adoption in education, healthcare, and industrial training. Increasing awareness of immersive technologies, improving digital infrastructure, and government initiatives for innovation are key growth drivers. While adoption is relatively nascent, rising investments and pilot projects are expected to accelerate market expansion across Africa.
Market Segmentations:
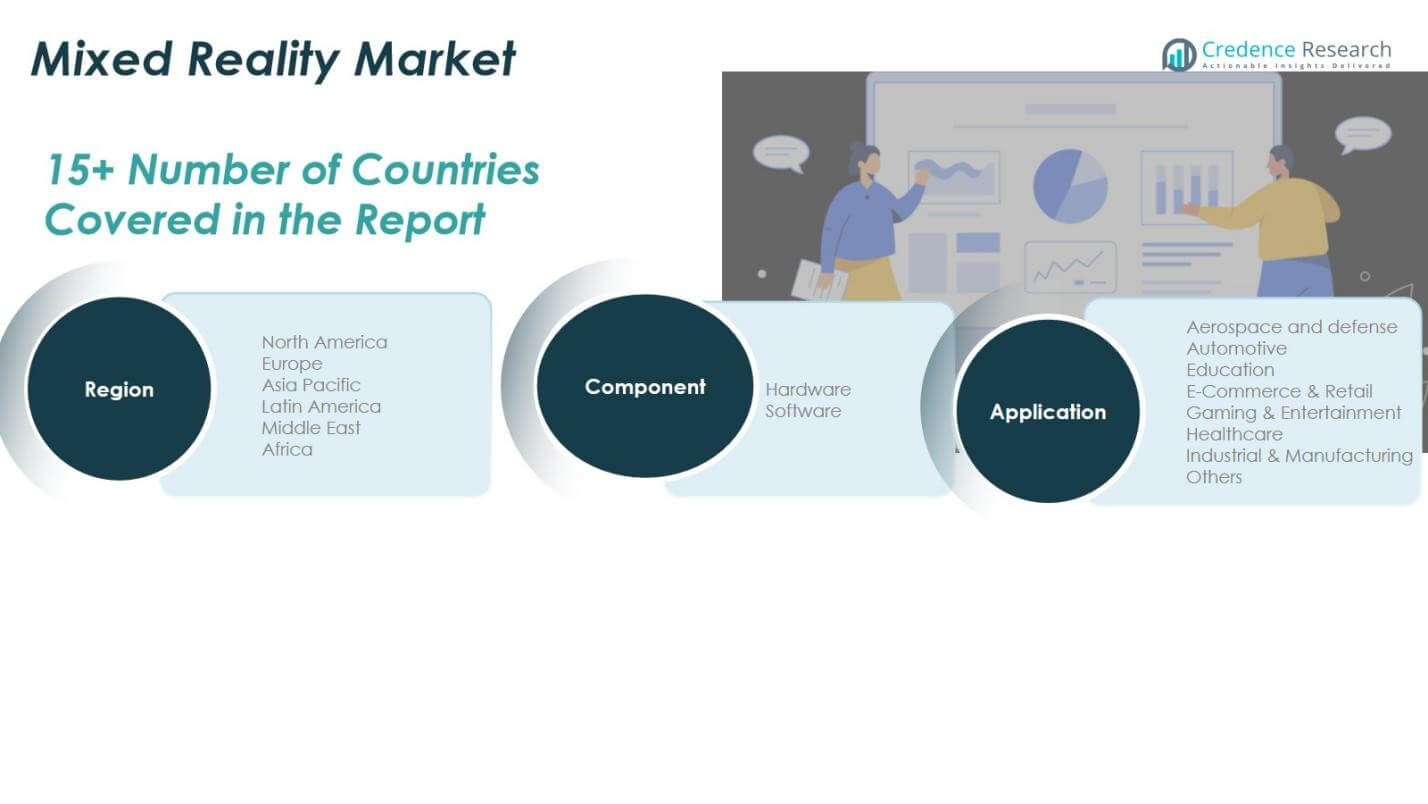
By Component
By Application
- Aerospace & Defense
- Automotive
- Education
- E-Commerce & Retail
- Gaming & Entertainment
- Healthcare
- Industrial & Manufacturing
- Others
By Geography
- North America
- Europe
- Germany
- France
- U.K.
- Italy
- Spain
- Rest of Europe
- Asia Pacific
- China
- Japan
- India
- South Korea
- South-east Asia
- Rest of Asia Pacific
- Latin America
- Brazil
- Argentina
- Rest of Latin America
- Middle East & Africa
- GCC Countries
- South Africa
- Rest of the Middle East and Africa
Competitive Landscape
Competitive landscape in the Mixed Reality Market includes key players such as Acer Inc., Google LLC, HTC Corporation, Magic Leap, Inc., Microsoft, Meta, Samsung Electronics Company Limited, Hewlett Packard Enterprise Development LP, Canon Inc., Dell Inc., Varjo, Seiko Epson Corporation, and Niantic. The market is characterized by rapid technological innovation, strategic partnerships, and continuous product development to strengthen market positioning. Companies are investing heavily in advanced MR hardware, immersive software solutions, and content development to enhance user experience across gaming, industrial, healthcare, and education applications. Mergers, acquisitions, and collaborations are common strategies to expand geographical presence and technology capabilities. Additionally, focus on AI integration, cloud platforms, and enterprise solutions is driving competitive differentiation. Strong R&D capabilities, brand recognition, and extensive distribution networks enable these players to maintain leadership, while emerging startups and regional players contribute to innovation and diversification of MR offerings, fostering an increasingly dynamic and competitive market environment.
Shape Your Report to Specific Countries or Regions & Enjoy 30% Off!
Key Player Analysis
Recent Developments
- In December 2025, Warby Parker announced a collaboration with Google to develop lightweight AI‑powered smart glasses, with the first product targeted for launch in 2026, expanding MR‑related wearable innovation.
- In September 2025, Meta launched the Meta Ray‑Ban Display, a new category of AI glasses featuring integrated visual display capabilities, enhancing mixed reality experiences.
- In October 2025, Samsung Electronics unveiled the Samsung Galaxy XR mixed reality headset, showcasing advanced passthrough cameras and Android XR ecosystem capabilities.
Report Coverage
The research report offers an in-depth analysis based on Component, Application and Geography. It details leading market players, providing an overview of their business, product offerings, investments, revenue streams, and key applications. Additionally, the report includes insights into the competitive environment, SWOT analysis, current market trends, as well as the primary drivers and constraints. Furthermore, it discusses various factors that have driven market expansion in recent years. The report also explores market dynamics, regulatory scenarios, and technological advancements that are shaping the industry. It assesses the impact of external factors and global economic changes on market growth. Lastly, it provides strategic recommendations for new entrants and established companies to navigate the complexities of the market.
Future Outlook
- The Mixed Reality Market is expected to continue strong growth driven by enterprise and consumer adoption.
- Increasing integration of MR with AI, IoT, and cloud technologies will enhance immersive experiences.
- Hardware innovations, including lightweight displays, improved sensors, and advanced tracking, will support market expansion.
- Software platforms for simulation, training, and collaboration will gain higher adoption across industries.
- Gaming and entertainment applications will remain a major revenue contributor globally.
- Industrial and manufacturing sectors will increasingly deploy MR for design, maintenance, and workforce training.
- Healthcare and education sectors will expand MR adoption for training, procedural planning, and interactive learning.
- E-commerce and retail will leverage MR for virtual try-ons and immersive customer experiences.
- Regional growth in Asia Pacific and North America will drive global market expansion.
- Strategic partnerships, acquisitions, and product launches will continue to shape competitive dynamics.


