Market Overview
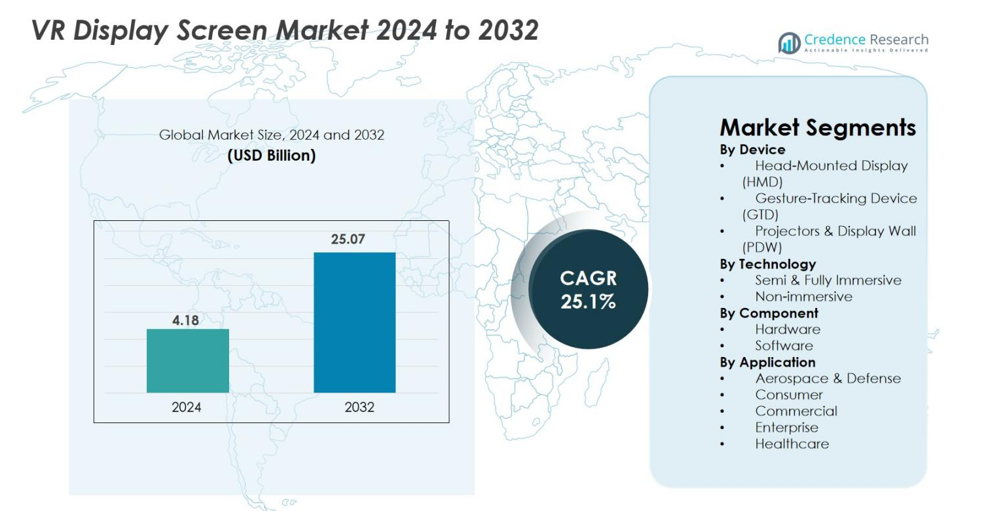
VR Display Screen Market size was valued at USD 4.18 Billion in 2024 and is anticipated to reach USD 25.07 Billion by 2032, at a CAGR of 25.1% during the forecast period.
| REPORT ATTRIBUTE |
DETAILS |
| Historical Period |
2020-2023 |
| Base Year |
2024 |
| Forecast Period |
2025-2032 |
| VR Display Screen Market Size 2024 |
USD 4.18 Billion |
| VR Display Screen Market, CAGR |
25.1% |
| VR Display Screen Market Size 2032 |
USD 25.07 Billion |
VR Display Screen Market features strong participation from major technology innovators, including Samsung Electronics, Meta Platforms, HTC Corporation, Sony Group, Microsoft Corporation, Alphabet Inc., Barco NV, Ultraleap, Sensics, Sixense Enterprises (Penumbra), and CyberGlove Systems, each advancing high-resolution displays, optics, and immersive interface technologies. These companies focus on enhancing clarity, reducing latency, and improving ergonomics to strengthen adoption across gaming, enterprise training, and healthcare simulation. North America led the market with a 38.4% share in 2024, driven by robust tech infrastructure and early adoption of immersive devices, followed by Europe at 27.6% and Asia-Pacific at 24.1%, supported by strong consumer electronics manufacturing and rising VR applications.
Market Insights
- VR Display Screen Market was valued at USD 4.18 Billion in 2024 and is projected to reach USD 25.07 Billion by 2032, registering a CAGR of 25.1%.
- Strong market growth is driven by rising adoption of VR in gaming, training, healthcare simulation, and enterprise collaboration, with Head-Mounted Displays (HMDs) holding the dominant 67.3% device share.
- Key trends include advancements in micro-OLED and micro-LED panels, lightweight ergonomics, and integration of AI, eye-tracking, and foveated rendering to enhance immersion and reduce latency.
- Leading players such as Samsung Electronics, Meta Platforms, HTC Corporation, Sony Group, Microsoft, Barco NV, and Ultraleap focus on high-resolution displays, optics innovation, and strategic partnerships to strengthen their presence.
- Regionally, North America led with a 38.4% share, followed by Europe at 27.6% and Asia-Pacific at 24.1%, while hardware dominated components with a 64.8% share, reflecting strong demand for advanced display modules and sensors.
Access crucial information at unmatched prices!
Request your sample report today & start making informed decisions powered by Credence Research Inc.!
Download Sample
Market Segmentation Analysis
By Device
The VR Display Screen Market by device is dominated by Head-Mounted Displays (HMDs), capturing 67.3% market share in 2024, driven by rapid adoption across gaming, training, education, and enterprise simulation environments. HMDs benefit from continuous improvements in resolution, refresh rates, field of view, and lightweight form factors. Gesture-Tracking Devices (GTDs) gain momentum as immersive interactions become essential for industrial design, medical simulation, and virtual collaboration. Projectors & Display Walls (PDWs) maintain niche demand for large-scale visualization in defense and research, but HMDs continue to lead due to affordability, portability, and widespread consumer penetration.
- For instance, Sony released the PlayStation VR2 PC Adapter enabling PS VR2’s 2000 × 2040 OLED panels and 120Hz support for PC VR applications.
By Technology
The Semi & Fully Immersive segment led the VR Display Screen Market with 71.5% share in 2024, supported by rising demand for high-fidelity environments in gaming, automotive prototyping, remote training, and healthcare simulation. Advancements in 4K/8K micro-OLED, fast-switching LCDs, and panoramic displays enhance user realism, making immersive systems the preferred choice. The non-immersive segment remains relevant in education and enterprise collaboration where budget-friendly, desktop-based VR experiences suffice, but immersive solutions continue to outpace growth due to accelerating investment in metaverse platforms and experiential learning environments.
- For instance, Apple introduced the Vision Pro featuring dual 4K micro-OLED displays with 23 million pixels, delivering ultra-immersive visual clarity for enterprise and medical visualization.
By Component
The Hardware segment accounted for the largest share at 64.8% in 2024, driven by strong demand for display panels, sensors, optics, controllers, and processing units that form the core of VR systems. Innovations in AMOLED, micro-LED, and pancake lenses enable superior clarity, reduced latency, and improved ergonomic performance, fueling hardware dominance. Software shows rising adoption as AI-based rendering, gesture-recognition algorithms, and VR content platforms expand applications. However, hardware maintains leadership due to the continuous need for upgraded display technologies and sensor integration essential for premium immersive experiences.
Key Growth Drivers
Advancements in High-Resolution Display Technologies
Rapid advancements in high-resolution display technologies significantly accelerate the growth of the VR Display Screen market. Innovations such as micro-OLED, micro-LED, fast-switching LCDs, and pancake optics are enhancing pixel density, refresh rates, brightness, and contrast ratios, enabling more immersive and comfortable VR experiences. Manufacturers are increasingly focused on reducing the screen-door effect, improving color accuracy, and minimizing motion blur all critical parameters for user satisfaction in gaming, enterprise simulation, healthcare training, and remote collaboration. The push toward 4K and 8K per-eye resolution is redefining visual clarity, making VR more suitable for mission-critical applications such as defense visualization, engineering design, and medical diagnostics. As production costs decline and technology matures, OEMs integrate advanced display modules into both consumer and enterprise-grade HMDs, expanding accessibility. These innovations collectively strengthen market expansion by elevating visual realism and broadening use cases across industries.
- For instance, Sony’s PS VR2 integrates HDR-enabled OLED panels at 2000 × 2040 per eye with up to 120Hz refresh rates, reducing motion blur for high-intensity gaming and simulation.
Growing Adoption of VR in Gaming, Training, and Enterprise Applications
Expanding adoption of VR across gaming, corporate training, education, and industrial environments remains a major driver of the VR Display Screen market. Gaming continues to dominate with surging demand for immersive content, realistic graphics, and enhanced ergonomics, prompting continuous upgrades in display screens. Meanwhile, enterprises increasingly deploy VR solutions for workforce training, safety simulations, remote assistance, and product demonstrations, which require high-performance displays with reduced latency and wide fields of view. Sectors such as healthcare, automotive, aviation, manufacturing, and retail leverage VR to cut training costs, improve knowledge retention, and minimize operational risks. Virtual classrooms and digital learning platforms also integrate VR to create interactive education environments. As organizations globalize their operations and adopt digital transformation initiatives, VR display technologies offer scalable, high-impact visualization solutions, driving consistent demand for advanced, durable, and high-resolution VR displays.
- For instance, Walmart deployed more than 17,000 VR headsets across its U.S. stores for employee training, citing improved engagement and faster skill acquisition.
Expansion of the Metaverse and Immersive Digital Ecosystems
The accelerating development of the metaverse and immersive digital ecosystems represents a pivotal growth driver for the VR Display Screen market. Technology leaders, gaming companies, and enterprises are investing heavily in virtual worlds, digital workplaces, 3D social platforms, and immersive commerce solutions. These environments require high-quality VR displays capable of delivering long-duration comfort, photorealistic graphics, and seamless interaction. As consumer behavior shifts toward virtual entertainment, interactive experiences, and digital ownership models including NFTs and virtual assets—the need for advanced VR headsets grows correspondingly. Enterprises adopt metaverse-based collaboration tools to facilitate global teamwork, remote design reviews, and virtual conferences. The integration of AI, spatial computing, and cloud rendering further enhances immersive experiences, making the metaverse more accessible and technologically feasible. As these ecosystems evolve, demand for next-generation VR display screens intensifies, supporting sustained long-term market growth.
Key Trends & Opportunities
Rise of Wireless, Lightweight, and Ergonomically Enhanced VR Devices
A major trend shaping the VR Display Screen market is the shift toward wireless, lightweight, and ergonomically optimized VR devices. Consumers and enterprise users increasingly demand headsets that minimize fatigue, improve balance, and deliver comfortable long-term use, driving manufacturers to adopt compact optics, thinner panels, and efficient thermal designs. Pancake lenses and micro-OLED displays enable significantly slimmer form factors, supporting next-generation wearable experiences. Wireless connectivity powered by Wi-Fi 6, 6E, and 5G reduces dependence on wired systems, improving mobility in gaming, training, and enterprise simulations. This transition opens opportunities for VR display vendors to supply ultra-low-latency screens with high brightness and reduced power consumption. As devices become more user-friendly, adoption expands across fitness, therapy, education, and commercial applications, positioning ergonomically enhanced VR hardware as a crucial opportunity for manufacturers.
- For instance, Meta’s Quest 3, launched in October 2023, incorporates pancake lenses that reduce the headset’s optical profile by 40%, enabling a significantly lighter and better-balanced design for extended use.
Increasing Integration of AI, Eye-Tracking, and Foveated Rendering
The integration of AI-driven processing, eye-tracking sensors, and foveated rendering presents a transformative opportunity in the VR Display Screen market. Eye-tracking enables dynamic resolution allocation, improving visual quality exactly where users focus while reducing GPU workload. This capability allows VR devices to deliver higher resolutions without compromising performance or increasing power consumption. AI-enhanced rendering algorithms further refine image clarity, predict motion paths, and reduce latency, enabling more realistic and responsive VR experiences. These intelligent systems support advanced applications such as VR-based surgical planning, automotive design, and scientific visualization. For manufacturers, integrating these technologies into display modules unlocks new revenue opportunities in premium HMDs and enterprise-grade VR systems. As content developers optimize software for AI-supported hardware, demand for advanced VR display screens will continue to grow substantially.
- For instance, Varjo headsets combine eye-tracking with GPU-accelerated foveated rendering to achieve human-eye-resolution views for engineering and simulation tasks.
Key Challenges
High Cost of Advanced Display Technologies and Manufacturing Complexity
One of the primary challenges for the VR Display Screen market is the high cost and manufacturing complexity associated with cutting-edge display technologies such as micro-LED, micro-OLED, and high-resolution LCOS. These advanced panels require precision fabrication, specialized materials, and low-defect production processes, increasing overall device costs. This can limit adoption in price-sensitive markets and restrict widespread penetration of premium VR headsets. Additionally, integrating sensors, high-performance processors, and advanced optics further raises system BOM costs. Vendors face challenges in scaling production while maintaining uniformity in color, brightness, and pixel arrangement. Supply-chain constraints for semiconductor components and optical modules also contribute to manufacturing delays and cost fluctuations. These combined factors create pricing barriers, particularly for consumer segments, slowing mass-market adoption and intensifying pressure on manufacturers to balance cost and performance.
User Discomfort, Motion Sickness, and Technical Limitations
User discomfort, motion sickness, and technical limitations present substantial challenges to the VR Display Screen market. Despite improvements, issues such as latency, limited field of view, image distortion, low contrast in bright environments, and insufficient refresh rates continue to impact user experience. Motion sickness arises from mismatches between perceived motion and visual feedback, discouraging prolonged use. Ergonomic issues including headset weight, heat buildup, and pressure points further reduce comfort in long VR sessions. These problems particularly affect education, healthcare, and enterprise applications where multi-hour use is common. Overcoming these challenges requires continuous advancements in display resolution, optical engineering, motion prediction, and thermal management. Until these aspects improve considerably, new-user adoption may remain cautious, restricting market acceleration.
Regional Analysis
North America
North America dominated the VR Display Screen Market with 38.4% share in 2024, driven by strong adoption of VR in gaming, enterprise training, defense simulation, and healthcare applications. The presence of leading technology companies, high consumer spending on advanced electronics, and robust investment in metaverse development support sustained growth. The U.S. leads regional demand due to accelerated deployment of VR in automotive design, remote collaboration, and entertainment. Increasing penetration of high-resolution HMDs and enterprise-grade visualization solutions continues to strengthen the region’s position as a global innovation hub for VR display technologies.
Europe
Europe accounted for 27.6% of the VR Display Screen Market in 2024, supported by rising adoption of VR across automotive engineering, industrial training, education, and medical simulation. Countries such as Germany, France, the U.K., and the Netherlands invest heavily in digital transformation, strengthening demand for high-resolution displays and immersive visual interfaces. Strong government initiatives promoting Industry 4.0 and virtual prototyping accelerate enterprise VR deployment. The gaming and entertainment segment also contributes significantly, particularly with expanding esports and VR arcades. Europe’s focus on ergonomics, design efficiency, and sustainability further drives innovation in advanced VR display solutions.
Asia-Pacific
Asia-Pacific emerged as the fastest-growing region with 24.1% market share in 2024, driven by rapid expansion of consumer electronics manufacturing and strong adoption of VR devices in China, Japan, South Korea, and India. The region benefits from large-scale production of OLED, micro-LED, and LCD panels, enabling cost efficiencies and faster technology innovation. Gaming, virtual training, and digital education accelerate demand, while government-backed tech initiatives expand VR infrastructure. Companies across China and South Korea are heavily investing in next-generation HMDs and immersive platforms, positioning Asia-Pacific as a global powerhouse for VR display development and mass-market adoption.
Latin America
Latin America held 5.2% of the VR Display Screen Market in 2024, with growing adoption in gaming, education, and enterprise visualization. Countries such as Brazil, Mexico, and Chile increasingly integrate VR for skill training, architectural design, and medical learning applications. Expanding broadband connectivity and declining hardware costs encourage consumer uptake, although market penetration remains moderate compared to major regions. Local entertainment and retail sectors are exploring VR-based customer engagement, supporting incremental demand. While economic constraints and limited enterprise budgets pose challenges, rising digital transformation initiatives gradually strengthen the region’s growth potential.
Middle East & Africa
The Middle East & Africa captured 4.7% share in 2024, driven by increasing adoption of VR in education, healthcare, real estate visualization, and aviation training. Gulf countries such as the UAE and Saudi Arabia invest heavily in immersive technologies to support smart city programs and tourism innovation. VR-enabled construction modeling and oil & gas training also contribute to demand for high-performance display solutions. Africa shows emerging adoption in digital learning and medical training, though growth is constrained by affordability and limited infrastructure. As regional innovation ecosystems mature, VR display uptake is expected to accelerate steadily.
Shape Your Report to Specific Countries or Regions & Enjoy 30% Off!
Market Segmentations
By Device
- Head-Mounted Display (HMD)
- Gesture-Tracking Device (GTD)
- Projectors & Display Wall (PDW)
By Technology
- Semi & Fully Immersive
- Non-immersive
By Component
By Application
- Aerospace & Defense
- Consumer
- Commercial
- Enterprise
- Healthcare
By Geography
- North America
- Europe
- Germany
- France
- U.K.
- Italy
- Spain
- Rest of Europe
- Asia Pacific
- China
- Japan
- India
- South Korea
- South-east Asia
- Rest of Asia Pacific
- Latin America
- Brazil
- Argentina
- Rest of Latin America
- Middle East & Africa
- GCC Countries
- South Africa
- Rest of the Middle East and Africa
Competitive Landscape
The VR Display Screen Market features a dynamic competitive landscape shaped by rapid technological advancements and increasing investments from global technology leaders. Companies such as Samsung Electronics, Meta Platforms, HTC Corporation, Sony Group, Alphabet Inc., Microsoft Corporation, Barco NV, Ultraleap, Sensics, Sixense Enterprises (Penumbra), and CyberGlove Systems play central roles in driving innovation across display panels, optics, motion-tracking systems, and immersive interface technologies. Manufacturers increasingly focus on high-resolution micro-OLED and micro-LED displays, enhanced ergonomics, and AI-enabled rendering to gain differentiation. Strategic partnerships between hardware developers, content creators, and software platforms strengthen market positioning, while continuous product launches accelerate adoption in gaming, enterprise training, healthcare simulation, and metaverse applications. Companies also invest heavily in R&D to overcome technical barriers such as latency, motion sickness, and thermal management, expanding opportunities for next-generation VR headsets. The industry remains highly innovation-driven, with strong competition centered on performance, user experience, and pricing.
Key Player Analysis
Recent Developments
- In 2025, Samsung Electronics launched its new VR/AR headset Galaxy XR marking a major new entry in the VR display-screen market.
- In September 2025, Meta unveiled Meta Ray-Ban Display smart glasses featuring a full-color, high-resolution in-lens display.
- In March 2025, TCL CSOT showcased next-generation immersive VR displays for headsets contributing to emerging VR screen-technology innovations.
Report Coverage
The research report offers an in-depth analysis based on Device, Technology, Component, Application and Geography. It details leading market players, providing an overview of their business, product offerings, investments, revenue streams, and key applications. Additionally, the report includes insights into the competitive environment, SWOT analysis, current market trends, as well as the primary drivers and constraints. Furthermore, it discusses various factors that have driven market expansion in recent years. The report also explores market dynamics, regulatory scenarios, and technological advancements that are shaping the industry. It assesses the impact of external factors and global economic changes on market growth. Lastly, it provides strategic recommendations for new entrants and established companies to navigate the complexities of the market.
Future Outlook
- The market will expand rapidly as high-resolution micro-OLED and micro-LED displays become mainstream in next-generation VR headsets.
- Eye-tracking, foveated rendering, and AI-driven optimization will significantly improve visual performance and reduce processing load.
- Lightweight, ergonomically enhanced HMD designs will drive broader consumer and enterprise adoption.
- Increasing integration of VR in training, simulation, and remote collaboration will accelerate enterprise demand.
- Growth of the metaverse and immersive digital ecosystems will stimulate investment in advanced display technologies.
- Wireless VR systems will gain traction as low-latency connectivity standards mature globally.
- Medical training, rehabilitation, and mental-health therapy will emerge as high-growth application areas.
- Automotive, aerospace, and industrial sectors will expand VR usage for prototyping and real-time visualization.
- Content ecosystems and developer support will strengthen, enabling richer and more interactive VR experiences.
- Emerging markets will contribute increasingly as VR hardware costs decline and digital infrastructure improves.


