
Market Overview:
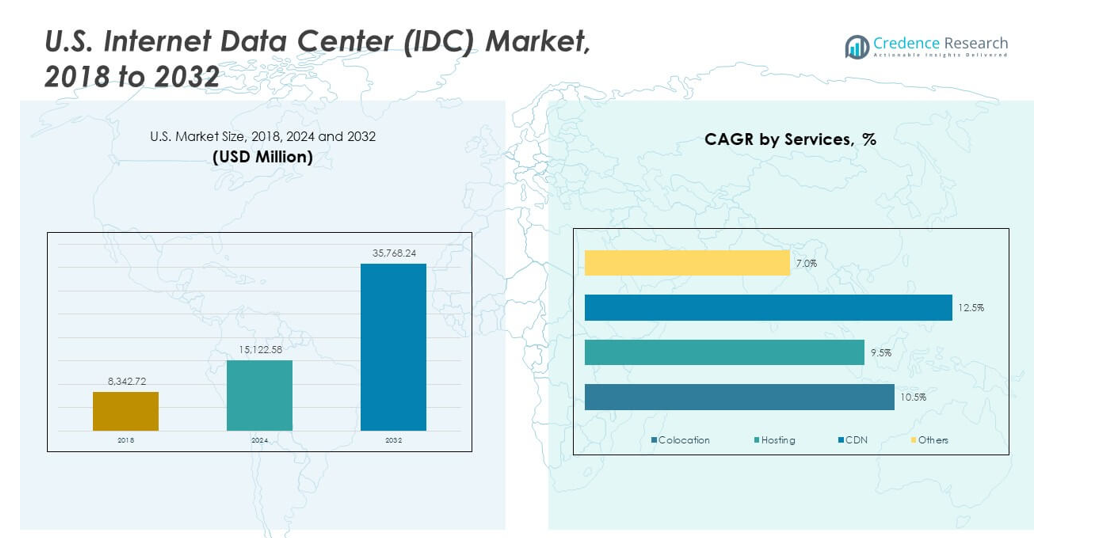
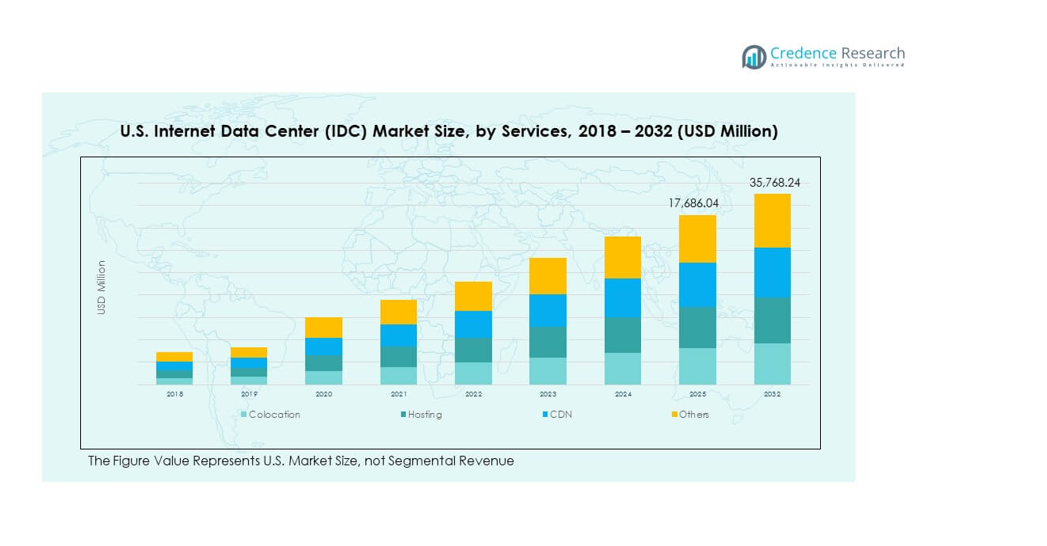
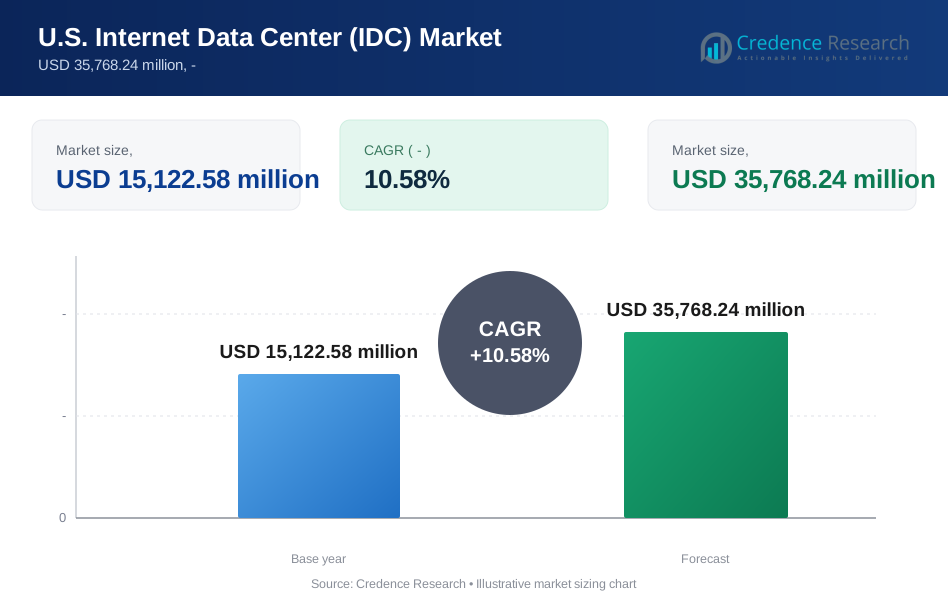
The U.S. Internet Data Center (IDC) Market size was valued at USD 8,342.72 million in 2018 to USD 15,122.58 million in 2024 and is anticipated to reach USD 35,768.24 million by 2032, at a CAGR of 10.58% during the forecast period.
| REPORT ATTRIBUTE | DETAILS |
|---|---|
| Historical Period | 2020-2023 |
| Base Year | 2024 |
| Forecast Period | 2025-2032 |
| U.S. Internet Data Center (IDC) MarketSize 2024 | USD 15,122.58 million |
| U.S. Internet Data Center (IDC) Market, CAGR | 10.58% |
| U.S. Internet Data Center (IDC) Market Size 2032 | USD 35,768.24 million |
Rising use of cloud apps drives wider use of U.S. Internet Data Center (IDC) Market services. Firms adopt AI tools that need dense compute clusters and strong network layers. Rising streaming, fintech tasks, and IoT devices push higher storage needs. Many enterprises modernize legacy systems to improve uptime. Edge zones support lower latency for key tasks. Strong digital shifts in retail and healthcare add fresh capacity needs. Cybersecurity upgrades also lift new investments in advanced racks.
The U.S. Internet Data Center (IDC) Market grows fastest across states with strong tech activity. The West leads due to hyperscale clusters and strong cloud ecosystems. The South rises due to lower power rates and land access. The Midwest gains traction due to enterprise hubs seeking stable networks. The Northeast keeps demand steady due to finance, media, and research firms. Emerging zones expand as more operators deploy edge nodes to improve content reach.
Market Insights:
- The U.S. Internet Data Center (IDC) Market grew from USD 8,342.72 million in 2018 to USD 15,122.58 million in 2024, with projections reaching USD 35,768.24 million by 2032 at a CAGR of 10.58%, reflecting strong expansion in cloud, hosting, and interconnection demand.
- The Western region leads with 38% share due to hyperscale density and strong cloud ecosystems, followed by the Southern region at 32% driven by low-cost power and land access, and the Eastern region at 20%, supported by finance, media, and research activity.
- The Midwestern region, holding 10% share, emerges as the fastest-growing zone due to expanding enterprise workloads, cost-efficient energy availability, and rising adoption of edge and industrial automation systems.
- Colocation represents the largest service share in the segment mix shown in the chart, supported by rising enterprise migration and demand for scalable, security-aligned hosting environments.
- Hosting and CDN segments jointly hold a significant mid-tier share, driven by rapid streaming growth, e-commerce activity, and rising performance needs tied to AI, digital media, and real-time content delivery.
Market Drivers:
Rapid Expansion of Cloud Adoption Across Enterprise and Public Systems
The U.S. Internet Data Center (IDC) Market grows through higher cloud use across key sectors. Firms shift workloads into stable digital stacks that improve daily output. It supports AI models that need dense compute layers and quick data flow. Streaming platforms push higher demand for safe hosting zones. Retail and banking groups modernize systems to reduce downtime risk. Healthcare users deploy telehealth tools that need strong uptime. Government projects drive steady traffic toward certified centers. Enterprises rely on flexible cloud capacity that scales with rising tasks. Strong digital maturity fuels continued market gains.
- For instance, Google Cloud expanded its U.S. regions with new C3 instances powered by Intel Xeon processors delivering up to 20% improved performance for enterprise workloads.
Rising Dependence On High-Density Computing And AI Workflows
High-density clusters drive new upgrades for operators across major hubs. AI tools need faster GPUs that increase load inside many racks. It pushes firms to pick centers that support stable heat control. Data-rich tasks in research labs require low-latency routes for model runs. Autonomous tech players accelerate demand for secure storage arrays. Robotics groups use real-time data feeds from remote systems. Automation firms depend on tight compute cycles for quick output. Machine learning teams select centers that support balanced thermal design. The U.S. Internet Data Center (IDC) Market sees stronger demand from AI-focused users.
- For instance, NVIDIA’s H100 GPUs deliver up to 30 times faster training performance for LLM workloads, prompting U.S. data centers to upgrade racks for high-power-density clusters.
Growth In Edge Deployments Supporting Real-Time Digital Activity
Edge nodes expand across cities to cut latency for tasks tied to mobility. It helps service providers support live apps with steady speed. Telecom players deploy upgraded networks that improve coverage. Smart retail zones push wider use of connected devices that need quick sync. Logistics firms use dense data to track goods in active routes. Smart industry plants need constant feed from sensors placed across units. AR platforms gain stable links through low-delay routes. Autonomous fleets need rapid compute near traffic clusters. Edge builds push operators to widen local footprints.
Stronger Need For Cybersecurity And Compliance-Aligned Hosting Systems
Security upgrades support major flows toward trusted centers nationwide. It drives firms to host sensitive data inside certified racks. Finance groups demand audited systems that meet set standards. Healthcare units adopt secure formats to protect patient records. Retailers move transactions into hardened stacks with strict control. Energy firms need strong monitoring for grids. Insurance groups push load into safe clusters that reduce breach risk. Government users prefer local centers that meet strict rules. The U.S. Internet Data Center (IDC) Market gains traction from rising compliance needs.
Market Trends:
Shift Toward Liquid Cooling And High-Efficiency Thermal Designs
Thermal systems evolve to match rising heat loads within dense racks. It drives operators to replace older cooling models with fluid setups. Many firms choose immersion cooling for better energy balance. High-density AI tasks require steady flow that avoids thermal spikes. It supports greener targets through lower power use across zones. Telecom units test hybrid cooling to reduce strain in edge rooms. Hyperscale players expand efficient layouts that handle GPU clusters. Developers design racks that support flexible coolant lines. The U.S. Internet Data Center (IDC) Market adapts to advanced cooling norms.
- For instance, Microsoft tested two-phase immersion cooling that reduced server power consumption by up to 15%, supporting higher density AI configurations.
Growth In Modular And Prefabricated Data Center Deployments
Modular builds gain pace due to faster setup and lower site disruption. It supports rollouts across regions seeking quick digital growth. Telecom groups use modular rooms to scale with rising network loads. Cloud users prefer setups that fit varied land profiles. Operators use modular stacks to reduce build time for new halls. IT teams value repeatable designs that cut project delays. Prefab units allow smoother expansion across remote areas. Many centers integrate modular power blocks for flexible upgrades. The U.S. Internet Data Center (IDC) Market seems clear gains from modular demand.
- For instance, Schneider Electric’s prefabricated data center modules cut deployment time by up to 60% while supporting power capacities exceeding 1 MW per unit.
Wider Integration Of Renewable Power Across Hyperscale And Colocation Sites
Green energy grows across large hosting sites that target lower emissions. Many states offer easy access to wind and solar power routes. Operators sign long deals to secure stable green supply for daily use. It helps centers reduce grid stress during heavy demand periods. Firms track carbon output to meet stricter sustainability goals. New builds adopt efficient lighting and optimized airflow paths. Renewable focus improves brand value for customer groups. It builds strong appeal for users with climate goals. The U.S. Internet Data Center (IDC) Market shifts toward cleaner power.
Expansion Of Interconnection Hubs Supporting Digital Trade And Cloud Workflows
Interconnection layers expand across large metros with high data flow. It supports cloud partners that need direct links for smooth sync. Carrier hotels gain traction through easy routing options. Media firms use peering setups to push stable content. Fintech groups select nodes with rich link density for quick trades. SaaS firms use strong links to reduce hit on core systems. IoT players link many devices to nodes with faster exchange. Dense fiber maps support higher traffic levels. The U.S. Internet Data Center (IDC) Market gains value from deeper interconnect growth.
Market Challenges Analysis:
Rising Energy Costs And Pressure On Power Availability Across Dense Metro Zones
Power strain limits expansion for operators that depend on stable supply. It pushes delays across cities with tight grid access. Many centers face pressure to manage peak loads during growth cycles. Renewable use supports long-term goals but needs stable grid links. Firms struggle to balance cost control with rising density. Aging substations slow expansion in high-demand corridors. It increases risk for users that need constant uptime. Operators invest in power backup to reduce vulnerability. The U.S. Internet Data Center (IDC) Market faces clear hurdles tied to power gaps.
Complex Regulatory Requirements And Limited Availability Of Skilled Workforce
Compliance rules create heavy work for firms that run large centers. It pushes operators to maintain strict records and security control. Many states set rules tied to emissions and data rights. Firms need trained workers who understand advanced cooling and power. Talent supply stays tight due to high technical needs. It affects build timelines across key states. Operators invest in training to improve worker depth. Strict zoning limits new builds in busy metros. The U.S. Internet Data Center (IDC) Market sees growth limits from rule pressure and talent gaps.
Market Opportunities:
Expansion Of AI-Ready Infrastructure And Advanced Computing Zones Nationwide
AI demand creates space for centers that support strong GPU layers. It drives operators to build halls that handle higher heat and load. Many firms upgrade racks to support real-time model runs. Telecom users expand nodes that support data-heavy apps. It boosts interest in hybrid hosting formats for flexible use. Research groups need fast compute for large models. Cloud vendors invest in zones near tech hubs to meet rising AI work. The U.S. Internet Data Center (IDC) Market gains new scale from AI-ready builds.
Rising Scope For Edge Data Centers In Smart Cities And Connected Industrial Zones
Edge centers expand across regions adopting smart mobility and smart grids. It supports low-delay apps that need quick access to local compute. Robotics plants use real-time data from many sensors. Retail systems adopt edge nodes for quick checkout tasks. Smart transport networks depend on tight sync across moving units. Logistics hubs gain faster tracking through local data zones. Edge builds support safer digital routes in busy corridors. The U.S. Internet Data Center (IDC) Market benefits from broad edge deployment potential.
Market Segmentation Analysis:
Services Segment
The U.S. Internet Data Center (IDC) Market expands through strong use of colocation, hosting, CDN, and other managed services. Colocation gains steady demand from enterprises seeking secure racks with flexible capacity. Hosting supports firms that need stable environments for web platforms and workflow systems. CDN services grow due to fast content delivery for media and retail. Other managed services support backup needs and network optimization tasks. It delivers strong value for users needing predictable performance. Service diversity strengthens market stability across key states.
Deployment Segment
Public, private, and hybrid formats shape deployment growth across technical ecosystems. Public deployment supports rapid scaling for cloud-native platforms. Private setups gain interest from regulated sectors seeking strict control. Hybrid formats lead due to their balanced integration across workloads. Telecom firms prefer hybrid routes for latency control. BFSI users rely on private nodes for tighter security. Public nodes power digital tools for many SMEs. Deployment mixes help operators meet varied demand types.
- For instance, IBM Hybrid Cloud reported that clients using its hybrid framework achieved up to 2.5 times the business value compared to a public cloud-only approach, which has driven wider adoption across regulated U.S. sectors.
Data Center Size Segment
Large enterprises lift demand for dense compute and broad storage layers. SMEs expand their use of efficient hosting setups with lower upfront load. It supports varying infrastructure priorities tied to workload intensity. Large users seek advanced cooling formats for AI and analytics. SMEs rely on shared systems that improve affordability. Both groups create steady flow for colocation and hybrid services. Size diversity supports long-term expansion across metros.
End User Segment
Cloud service providers lead demand due to constant growth in digital use. Telecom firms widen footprints to support 5G-linked tasks. Government units depend on secure nodes for critical workflows. BFSI users maintain strict compliance paths within private zones. Media groups drive CDN use for heavy content. E-commerce and retail users need fast routing for daily traffic. Other sectors contribute steady baseline demand across regions.
Segmentation:
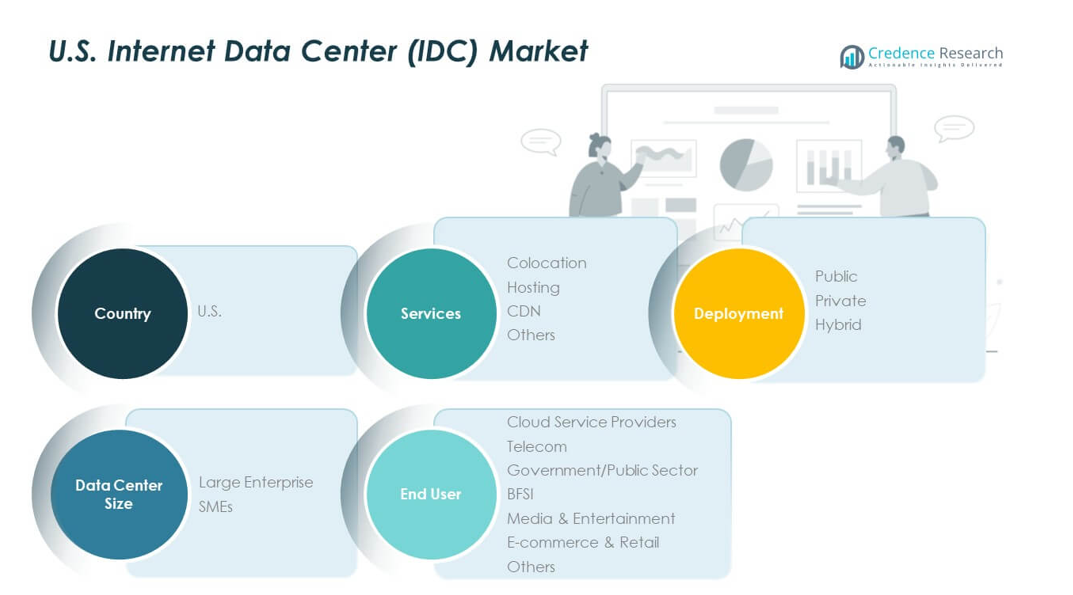
- By Services
- Colocation
- Hosting
- CDN
- Others
- By Deployment
- Public
- Private
- Hybrid
- By Data Center Size
- Large Enterprise
- SMEs
- By End User
- Cloud Service Providers
- Telecom
- Government/Public Sector
- BFSI
- Media & Entertainment
- E-commerce & Retail
- Others
- By Country
- U.S. (with segmentation by Services, Deployment, Data Center Size, End User)
Regional Analysis:
Western Region Leadership
The Western region holds the largest share of the U.S. Internet Data Center (IDC) Market at around 38%. Dense hyperscale clusters anchor this lead due to strong cloud and AI demand. It benefits from access to advanced network routes and steady renewable power links. Technology firms expand footprints across major hubs that support high-density compute. Content platforms rely on edge nodes placed near urban zones. Operators gain strength from mature fiber systems that improve routing efficiency. The U.S. Internet Data Center (IDC) Market gains stable momentum through this region’s deep digital base.
Southern and Eastern Growth Corridors
The Southern region secures about 32% share driven by low power costs and wide land access. It attracts new builds that need high cooling efficiency and flexible zoning rules. Telecom firms scale deployments in states that support strong 5G adoption. Eastern states hold near 20% share due to demand from finance, media, and research users. It gains value from dense enterprise clusters that elevate colocation use. Public units rely on secure nodes placed near key metros. Both regions shape diverse growth paths for operators expanding their networks.
Midwestern Expansion and Emerging Edge Zones
The Midwest accounts for roughly 10% share supported by rising enterprise workloads and stable power access. It draws interest from firms seeking balanced cost structures across growing metros. Edge deployments gain traction in states planning smart mobility and industrial automation. It supports low-latency needs for logistics and retail users. Cloud partners select midwestern hubs for redundancy and disaster recovery. Media groups test new CDN routes in developing corridors. Broader edge expansion strengthens long-term prospects for regional operators.
Key Player Analysis:
Competitive Analysis:
The U.S. Internet Data Center (IDC) Market shows strong competition among hyperscale operators, colocation providers, and cloud leaders that expand capacity across major metros. It features firms with advanced cooling systems, dense interconnection layers, and broad service portfolios. Operators focus on hybrid-ready designs that support AI-driven workloads and high-density compute. Many companies invest in modular builds to reduce deployment timelines and improve scalability. Telecom players secure strategic sites to strengthen 5G integration. Cloud leaders expand multi-region footprints to capture enterprise migration. Growing demand for secure hosting pushes firms to enhance compliance frameworks and expand edge nodes for regional reach.
Recent Developments:
- In October 2025, Google unveiled a $9 billion investment in South Carolina through 2027 to expand its existing Berkeley County data center campus and support the continued construction of two new data center sites in Dorchester County. This investment reinforces South Carolina's role as a critical hub for American infrastructure and cloud computing. Since establishing its Berkeley County facility in 2007, Google has invested over $4.5 billion in the state and generated approximately $6.4 billion in economic activity. The company also pledged to provide a Google.org grant to the Electrical Training Alliance to integrate AI tools into training programs, preparing more than 160 apprentices for careers in South Carolina's growing tech and energy sector.
- In September 2025, CoreSite announced the launch of NY3, a new AI-optimized data center expanding capacity in the New York Metro area. This strategic facility represents more than just added capacity and serves as a strategic investment in customers' futures. NY3 is designed as purpose-built infrastructure for high-performance and AI-driven workloads, offering advanced liquid cooling solutions and robust interconnectivity solutions through the Open Cloud Exchange to access all major public cloud providers. The facility empowers enterprises in the New York market to innovate, connect, and grow with confidence.
- In July 2025, Google announced a $25 billion investment in data center and artificial intelligence infrastructure over two years across states within the PJM Interconnection, the largest electric grid in the United States. Additionally, Google committed $3 billion to upgrade two hydropower facilities in Pennsylvania as part of a strategic agreement with Brookfield Asset Management to acquire 3 megawatts of hydro energy throughout the U.S., addressing the escalating energy demands of data center operations.
- In June 2025, AWS announced an even larger investment of $20 billion in Pennsylvania to expand its data center infrastructure for artificial intelligence and cloud computing technologies. The two-year investment will support the construction of two data center complexes: one located in Salem Township adjacent to the Susquehanna nuclear power plant in northeastern Pennsylvania, and another in Falls Township north of Philadelphia at the Keystone Trade Center logistics campus, a former U.S. Steel mill site. This landmark investment is expected to create at least 1,250 new high-skilled jobs while supporting thousands of additional positions in the AWS supply chain. Governor Josh Shapiro characterized this as the largest capital influx in Pennsylvania's history, and since 2010, Amazon has invested $26 billion in the Commonwealth, contributing significantly to the state's economic development.
Report Coverage:
The research report offers an in-depth analysis based on Services, Deployment, Data Center Size, End User, and Country. It details leading market players, providing an overview of their business, product offerings, investments, revenue streams, and key applications. Additionally, the report includes insights into the competitive environment, SWOT analysis, current market trends, as well as the primary drivers and constraints. Furthermore, it discusses various factors that have driven market expansion in recent years. The report also explores market dynamics, regulatory scenarios, and technological advancements that are shaping the industry. It assesses the impact of external factors and global economic changes on market growth. Lastly, it provides strategic recommendations for new entrants and established companies to navigate the complexities of the market.
Future Outlook:
- Strong enterprise migration creates wider demand for modern colocation platforms.
- AI-driven workloads push operators to deploy high-density GPU clusters across new halls.
- Hybrid deployment grows stronger due to varied compliance needs across industries.
- Energy-efficient cooling formats gain rapid adoption across major campuses.
- Edge nodes expand in cities adopting smart mobility and retail automation.
- Telecom groups integrate 5G workloads into regional data centers for faster routing.
- Cloud leaders strengthen multi-region builds to support real-time compute tasks.
- Renewable power deals shape site selection for long-term hosting stability.
- Interconnection hubs gain value through rich peering options for digital trade.
- Security-focused infrastructure investments increase due to rising cyber risk across users.
Request a Free Sample
Fill in your details and we'll send you a free sample report.
- Sample data tables & charts
- Research methodology
Need a Custom Version of This Report?
Tailor the scope, geography, or segments to your exact requirements.
- Custom geography or segment scope
- Direct access to our analyst team
Frequently Asked Questions
What is the current size of the U.S. Internet Data Center (IDC) market?
At what Compound Annual Growth Rate is the U.S. Internet Data Center (IDC) Market projected to grow between 2024 and 2032?
What factors are driving the growth of the U.S. Internet Data Center (IDC) market?
What are some challenges faced by the U.S. Internet Data Center (IDC) market?
Who are the major players in the U.S. Internet Data Center (IDC) market?
Table of Content
Chapter 1. Report Introduction
- 1.1 Report Description & Purpose
- 1.1.1 Report Title & Market Definition
- 1.1.2 Unique Selling Propositions (USP) & Key Differentiators
- 1.1.3 Value Proposition for Stakeholders
- 1.2 Research Objectives
- 1.2.1 Market Sizing Objectives (Volume & Revenue)
- 1.2.2 Segmentation Objectives
- 1.2.3 Competitive Intelligence Objectives
- 1.2.4 Forecast & Scenario Objectives
- 1.3 Report Scope
- 1.3.1 U.S. Internet Data Center (IDC) Scope – Types & Subtypes Covered
- 1.3.2 Geographic Scope – Regions & Countries Covered
- 1.3.3 Historical Period, Base Year & Forecast Period (the historical period; forecast to the forecast period)
- 1.3.4 Inclusions & Exclusions
- 1.4 HS Code & Classification Framework
- 1.5 Currency, Units & Pricing Basis
- 1.6 Target Stakeholders
- 1.7 Limitations & Assumptions
Chapter 2. Executive Summary
- 2.1 Global U.S. Internet Data Center (IDC) Market Snapshot
- 2.1.1 Market Size – Historical (the historical period) & Forecast (the forecast period) (base year: USD 15,122.58 million → forecast year: USD 35,768.24 million)
- 2.1.2 Volume & Revenue – Global Totals
- 2.1.3 Key Market Highlights – Top Five Facts
- 2.2 U.S. Internet Data Center (IDC) Market Segmentation Snapshot
- 2.2.1 Market Split by Region – vs.
- 2.3 Competitive Snapshot
- 2.3.1 Top 10 Players by Revenue Share –
- 2.3.2 Top 10 Players by Volume Share –
- 2.3.3 Recent Strategic Developments (18-Month Summary)
- 2.4 Key Investment Highlights & Strategic Conclusions
Chapter 3. U.S. Internet Data Center (IDC) Market Dynamics & Industry Analysis
- 3.1 Market Overview & Context
- 3.1.1 U.S. Internet Data Center (IDC) Market Position in the Broader Automotive Value Chain
- 3.1.2 OEM vs. Replacement Market Dynamics
- 3.1.3 Market Maturity & Development Stage by Region
- 3.2 U.S. Internet Data Center (IDC) Market Drivers
- 3.3 U.S. Internet Data Center (IDC) Market Restraints & Challenges
- 3.4 U.S. Internet Data Center (IDC) Market Opportunities
- 3.5 Porter's Five Forces Analysis
- 3.5.1 Threat of New Entrants
- 3.5.2 Bargaining Power of Suppliers
- 3.5.3 Bargaining Power of Buyers
- 3.5.4 Threat of Substitutes
- 3.5.5 Competitive Rivalry – Intensity Assessment
- 3.6 U.S. Internet Data Center (IDC) Value Chain Analysis
- 3.6.1 Upstream – Raw Material/Input Suppliers
- 3.6.1.1 Raw Material/Input 1
- 3.6.1.2 Raw Material/Input 2
- 3.6.1.3 Raw Material/Input 3
- 3.6.2 Midstream – Production/Manufacturing/Service Delivery
- 3.6.2.1 Production/Process Overview
- 3.6.2.2 Key Facility Locations & Capacity by Manufacturer
- 3.6.3 Downstream – Distribution & End Consumer
- 3.6.3.1 Primary Channel – B2B/OEM
- 3.6.3.2 Secondary Channels – Dealer, Retail, Online, Direct
- 3.6.4 Value Chain Profitability Analysis
- 3.6.1 Upstream – Raw Material/Input Suppliers
- 3.7 PESTEL Analysis
- 3.7.1 Political Factors
- 3.7.2 Economic Factors
- 3.7.3 Social Factors
- 3.7.4 Technological Factors
- 3.7.5 Environmental Factors
- 3.7.6 Legal Factors
- 3.8 U.S. Internet Data Center (IDC) Supply Chain Analysis
- 3.8.1 Raw Material/Input Supply Risk Assessment
- 3.8.2 Manufacturing Concentration Risk (Geographic Exposure)
- 3.8.3 Trade Disruption Impact Analysis
- 3.9 Regulatory & Policy Landscape
Note: The regulatory and policy landscape section covers regulations based on their applicability to the market, U.S. Internet Data Center (IDC) category, geography, and scope of the study. Only regulatory frameworks with a material impact on operations, compliance, trade, sustainability, or market access are analyzed in detail.
Chapter 4. Key Investment Pockets & Opportunity Analysis
- 4.1 U.S. Internet Data Center (IDC) Market Attractiveness Analysis
- 4.1.1 By Region – Investment Attractiveness Matrix (Volume × CAGR)
- 4.2 Absolute Revenue Growth Opportunity
- 4.2.1 By Region – Absolute USD Growth Through the forecast period
- 4.3 Incremental Volume Opportunity
- 4.3.1 By Region – Incremental Volume Through the forecast period
- 4.3.2 Segment – Incremental Volume
- 4.4 Emerging Submarket Opportunity Deep Dive (Subject to Applicability)
- 4.5 Emerging Market Opportunity Scorecards
- 4.5.1 United States
- 4.5.2 Europe
- 4.5.3 Asia
- 4.5.4 Middle East & Africa
Note: Emerging Market Opportunity Scorecards will be included based on relevance and strategic importance. Regions listed are indicative and may vary depending on data availability and market dynamics.
Chapter 5. U.S. Internet Data Center (IDC) Import-Export Analysis & Trade Flows
- 5.1 Global Trade Overview
- 5.1.1 Global Export Value by Country (the historical period)
- 5.1.2 Global Export Volume by Country (the historical period)
- 5.1.3 Global Import Value by Country (the historical period)
- 5.1.4 Global Import Volume by Country (the historical period)
- 5.1.5 Net Trade Balance by Country (the historical period)
- 5.2 Export Analysis – Segment
- 5.2.1 Type 1 (HS Code)
- 5.2.2 Type 2 (HS Code)
- 5.2.3 Type 3 (HS Code)
- 5.2.4 Type 4 (HS Code)
- 5.2.5 Type 5 (HS Code)
- 5.3 Import Analysis – Segment
- 5.3.1 Type 1 (HS Code)
- 5.3.2 Type 2 (HS Code)
- 5.3.3 Type 3 (HS Code)
- 5.3.4 Type 4 (HS Code)
- 5.3.5 Type 5 (HS Code)
- 5.4 Average Unit Trade Prices
- 5.4.1 Average Export Price – Segment & Country
- 5.4.2 Average Import Price – Segment & Source Country
- 5.4.3 Price Trends (the historical period)
- 5.5 Key Trade Route Analysis
- 5.5.1 Trade Route 1
- 5.5.2 Trade Route 2
- 5.5.3 Trade Route 3
- 5.5.4 Trade Route 4
- 5.5.5 Trade Route 5
- 5.6 Trade Policy Impact Assessment
- 5.6.1 US Anti-Dumping & Section 301 Tariffs
- 5.6.2 EU Customs Union Impact
- 5.6.3 Major Free Trade Agreements
- 5.6.4 USMCA Rules of Origin
Note: Trade policy analysis will be included only where relevant to the U.S. Internet Data Center (IDC) market.
Chapter 6. Competitive Landscape & Company Benchmarking
- 6.1 U.S. Internet Data Center (IDC) Market Concentration & Structure
- 6.1.1 Herfindahl-Hirschman Index (HHI) – vs.
- 6.1.2 Tier 1, Tier 2 & Tier 3 Market Structure
- 6.1.3 Global, Regional & Local Player Dynamics
- 6.2 U.S. Internet Data Center (IDC) Market Share Analysis –
- 6.2.1 Global Revenue Share by Company
- 6.2.2 Global Volume Share by Company
- 6.2.3 Regional Revenue Share
- 6.2.4 Market Share Evolution ( vs. )
- 6.2.5 OEM Segment Share by Company
- 6.2.6 Replacement Segment Share by Company
- 6.3 Production/Delivery Capacity & Facility Analysis
- 6.3.1 Global Installed Capacity
- 6.3.2 Capacity Utilization Rates
- 6.3.3 Production/Output Volume
- 6.3.4 Facility Locations & Capacity Map
- 6.3.5 Planned Capacity Additions
- 6.4 U.S. Internet Data Center (IDC) Competitive Benchmarking Matrix
- 6.4.1 Revenue, Volume, CAGR & Profitability Comparison
- 6.4.2 Channel Revenue Mix
- 6.4.3 Geographic Revenue Exposure
- 6.4.4 R&D Intensity
- 6.4.5 Sustainability Maturity
- 6.5 Strategic Developments in U.S. Internet Data Center (IDC) (Last 24 Months)
- 6.5.1 Mergers, Acquisitions & Divestments
- 6.5.2 New U.S. Internet Data Center (IDC) Launches
- 6.5.3 Facility Expansions
- 6.5.4 Strategic Alliances, Joint Ventures & Partnerships
- 6.5.5 Distribution Expansion & Market Entry
- 6.5.6 Sustainability & ESG Initiatives
- 6.6 Competitive Strategy Mapping
- 6.6.1 Leader, Challenger, Follower & Niche Classification
- 6.6.2 Pricing Strategy Comparison
- 6.6.3 Channel Strategy Matrix
Note: Strategic developments are included based on their materiality and the availability of reliable information.
Chapter 7. Global U.S. Internet Data Center (IDC) Market – By Distribution Channel
- 7.1 Segment Overview
- 7.1.1 Volume & Revenue Split by Channel ( & )
- 7.1.2 Channel Mix Evolution (the forecast period)
Chapter 8. Regional Market Analysis – Global Overview
- 8.1 Global Regional Overview
- 8.1.1 Regional Volume Share
- 8.1.2 Regional Revenue Share
- 8.1.3 Regional Volume by Region
- 8.1.4 Regional Revenue by Region
- 8.1.5 Regional Forecast Through the forecast period
- 8.2 Cross-Regional Segment Analysis
- 8.2.1 By Distribution Channel
- 8.2.2 By Brand/Price Tier
Chapter 9. North America U.S. Internet Data Center (IDC) Market
- 9.1 United States
- 9.2 Canada
- 9.3 Mexico
Chapter 10. Europe U.S. Internet Data Center (IDC) Market
- 10.1 Germany
- 10.2 France
- 10.3 Italy
- 10.4 United Kingdom
- 10.5 Spain
- 10.6 Poland
- 10.7 Russia
- 10.8 Netherlands
- 10.9 Belgium
- 10.10 Sweden
- 10.11 Denmark
- 10.12 Norway
- 10.13 Rest of Europe
Chapter 11. Asia Pacific U.S. Internet Data Center (IDC) Market
- 11.1 China
- 11.2 India
- 11.3 Japan
- 11.4 South Korea
- 11.5 Thailand
- 11.6 Indonesia
- 11.7 Vietnam
- 11.8 Malaysia
- 11.9 Australia
- 11.10 Rest of Asia Pacific
Chapter 12. Latin America U.S. Internet Data Center (IDC) Market
- 12.1 Brazil
- 12.2 Argentina
- 12.3 Colombia
- 12.4 Chile
- 12.5 Rest of Latin America
Chapter 13. Middle East U.S. Internet Data Center (IDC) Market
- 13.1 Saudi Arabia
- 13.2 United Arab Emirates
- 13.3 Turkey
- 13.4 Israel
- 13.5 Iran
- 13.6 Rest of the Middle East
Chapter 14. Africa U.S. Internet Data Center (IDC) Market
- 14.1 South Africa
- 14.2 Egypt
- 14.3 Nigeria
- 14.4 Morocco
- 14.5 Rest of Africa
Chapter 15. U.S. Internet Data Center (IDC) Company Profiles
- 15.1 [Company 01]
- 15.1.1 Company Overview
- 15.1.2 Key Management Personnel
- 15.1.3 Products & Services Portfolio
- 15.1.4 Financial Performance
- 15.1.5 Key Market Focus & Geographic Presence
- 15.1.6 Recent Developments & Strategic Initiatives
Note: The company profile list is preliminary and may change based on research findings, market developments, data availability, and client requirements.
Chapter 16. Appendices
- Appendix A – List of Abbreviations & Acronyms
- Appendix B – Industry Classification Code Reference – Full Series
- Appendix C – Production & Capacity Data Tables
- Appendix D – End-Use & Demand Base Tables
- Appendix E – Consumption & Replacement Rate Assumptions
- Appendix F – ASP Reference Tables
- Appendix G – Manufacturing & Facility Database
- Appendix H – Import-Export Data Tables
- Appendix I – Regulatory Summary Tables
- Appendix J – Primary Research Participant List (Anonymized)
- Appendix K – Primary Research Questionnaire Framework
- Appendix L – Data Sources & Bibliography
- Appendix M – Market Size Divergence & Source Comparison
Chapter 17. Research Methodology
- 17.1 Research Framework & Philosophy
- 17.2 Secondary Research – Sources, Hierarchy & Data Extraction
- 17.3 Data Modeling – Bottom-Up & Top-Down Market Sizing
- 17.4 Primary Research – Stakeholder Framework, LOI & Sample Sizes
- 17.5 Forecast Methodology – Regression, Scenario & Sensitivity Analysis
- 17.6 Quality Control – Four-Layer Validation Framework
- 17.7 Limitations & Standard Assumptions
- 17.8 Disclaimer
