Home » Information and Communications Technology » Technology & Media » Mobile Video Optimization Market

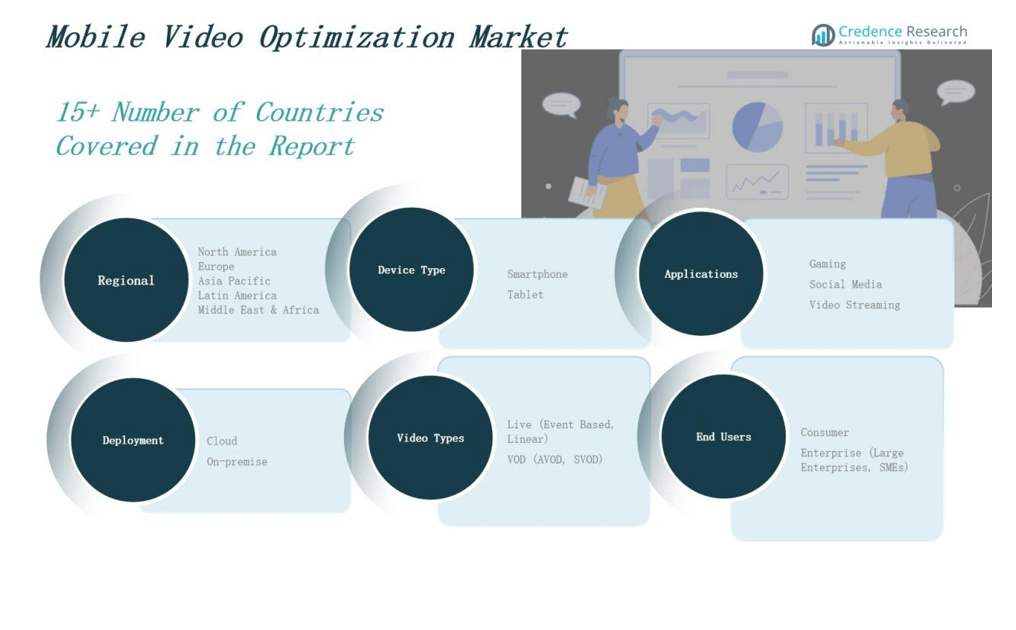
Mobile Video Optimization Market By Application (Gaming, Social Media, Video Streaming); By Device Type (Smartphones, Tablets); By Deployment (Cloud, On-Premise); By Video Types (Live – Event Based, Linear; VOD – AVOD, SVOD); By End Users (Consumer, Enterprise – Large Enterprises, SMEs) – Growth, Share, Opportunities & Competitive Analysis, 2024 – 2032

Report ID: 8946 | Report Format : Excel, PDF

Market Overview:

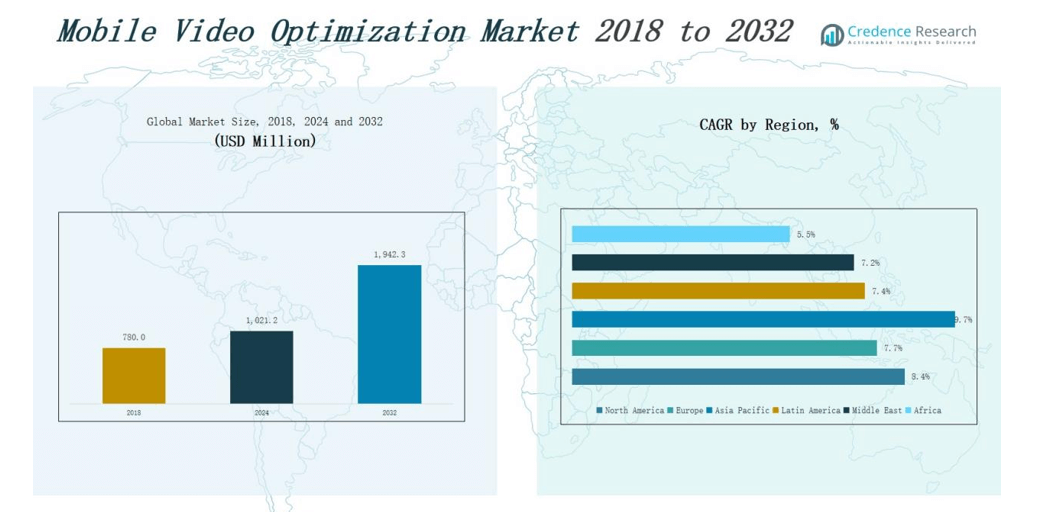
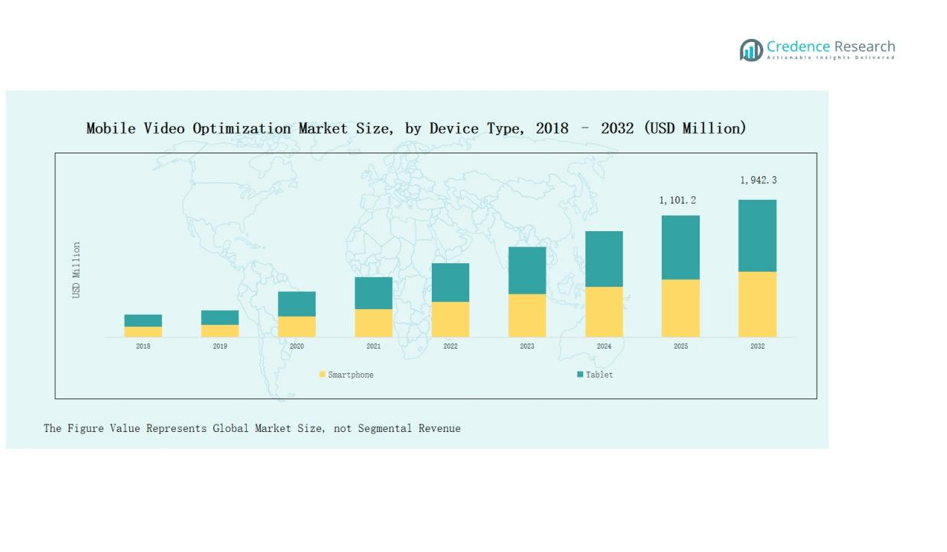
Mobile Video Optimization Market size was valued at USD 780.0 million in 2018 to USD 1,021.2 million in 2024 and is anticipated to reach USD 1,942.3 million by 2032, at a CAGR of 8.4% during the forecast period.

REPORT ATTRIBUTE DETAILS
Historical Period 2020-2023
Base Year 2024
Forecast Period 2025-2032
Mobile Video Optimization Market Size 2024 USD 1,021.2 million
Mobile Video Optimization Market, CAGR 8.4%
Mobile Video Optimization Market Size 2032 USD 1,942.3 million


The Mobile Video Optimization Market is shaped by leading players such as Akamai Technologies, Fastly, Google, Microsoft, Lumen Technologies, Limelight Networks, Ericsson, ZTE Corporation, ChinaCache International Holdings, and Viavi Solutions. These companies compete through advanced cloud-based delivery networks, AI-driven optimization tools, and partnerships with telecom operators to enhance video quality and reduce bandwidth strain. North America emerges as the leading region, accounting for 32% of the global market share in 2024, driven by strong 5G adoption, high smartphone penetration, and the dominance of OTT platforms demanding superior video experiences.

Mobile Video Optimization Market size

Market Insights

  • The market is projected to grow from USD 780.0 million in 2018 to USD 1,942.3 million by 2032, driven by rising demand for seamless video experiences.
  • Video streaming leads with a 52% share, followed by gaming and social media, supported by high-definition and interactive content demand.
  • Smartphones dominate device adoption with a 68% share, while cloud deployment leads with 61% due to scalability and cost efficiency.
  • North America holds the largest regional share at 32% in 2024, followed by Europe at 25% and Asia Pacific at 23%.
  • Key players including Akamai, Fastly, Google, Microsoft, Lumen, Ericsson, ZTE, and Limelight compete through AI-driven solutions, telecom partnerships, and global expansions.

Access crucial information at unmatched prices!

Request your sample report today & start making informed decisions powered by Credence Research Inc.!

Download Sample

Market Segment Insights

By Application

Video streaming dominates the mobile video optimization market with a 52% share. The segment leads due to rising consumption of high-definition and 4K content across platforms like Netflix, YouTube, and Amazon Prime Video. Network operators prioritize video optimization to reduce buffering, enhance user experience, and manage rising mobile data traffic. Gaming holds a significant portion, supported by mobile eSports and cloud gaming platforms. Social media contributes steadily, driven by short-form video growth on platforms such as TikTok, Instagram, and Facebook.

  •  For instance, Microsoft’s Xbox Cloud Gaming service expanded to over 30 countries by 2024, enabling mobile users to stream console-quality games without downloads.

By Device Type

Smartphones account for a dominant 68% share of the market. Their leadership stems from global smartphone penetration, affordable data plans, and the shift toward video-first communication. Optimized video delivery on mobile devices is critical, as users expect smooth playback even on lower bandwidths. Tablets maintain a smaller share, supported by enterprise adoption and usage for education and entertainment. Growth in larger-screen video consumption, particularly among students and professionals, keeps the tablet segment relevant.

  • For instance, Samsung’s Galaxy Tab S9 series introduced in 2023 emphasizes productivity and immersive video experiences, aligning with growing demand among professionals and students alike.

By Deployment

Cloud deployment leads with a 61% share in the mobile video optimization market. Enterprises and service providers prefer cloud-based solutions for scalability, faster updates, and lower infrastructure costs. Rising adoption of video-on-demand and live streaming services further strengthens cloud’s position. On-premise deployment retains demand from organizations prioritizing data control, security, and compliance. Industries such as government and large enterprises still opt for on-premise models, though the shift toward hybrid solutions is increasing.

Market Overview

Rising Mobile Data Traffic

The rapid surge in mobile data consumption is a primary driver for the mobile video optimization market. Increasing video streaming, gaming, and social media usage on smartphones generates unprecedented data loads on networks. Telecom operators face pressure to maintain service quality while managing bandwidth constraints. Video optimization technologies help reduce buffering, latency, and network congestion. With global mobile internet adoption accelerating, operators and content providers are investing heavily in optimization tools to deliver seamless experiences, directly fueling market expansion.

  • For instance, Ericsson reported in its 2024 Mobility Report that video accounts for over 70% of global mobile data traffic, with short-form videos from platforms like TikTok driving the sharpest increases.

Expansion of OTT and Video-on-Demand Platforms

The expansion of OTT platforms such as Netflix, Disney+, and Amazon Prime is boosting demand for video optimization solutions. Consumers increasingly prefer high-quality, on-demand content on mobile devices, requiring advanced optimization to support smooth playback across varying network conditions. Video quality, adaptive streaming, and minimal lag are critical to subscriber retention. As competition intensifies among OTT platforms, providers seek optimization technologies to differentiate services and deliver superior user experience. This demand significantly drives market growth across both developed and emerging regions.

  • For instance, Disney+ leverages Google Cloud’s adaptive bitrate streaming to dynamically adjust video resolution based on network conditions, maintaining consistency across devices.

Growth in Mobile Gaming Ecosystem

The growth of mobile gaming, including cloud-based and eSports platforms, is fueling the need for video optimization. Gaming requires ultra-low latency, high-resolution graphics, and uninterrupted connections. Mobile video optimization ensures real-time responsiveness and smooth gameplay, even on fluctuating networks. The rising popularity of multiplayer and live-streamed games amplifies demand for advanced optimization solutions. Telecom operators and gaming companies are collaborating to optimize network resources for immersive experiences. This strong alignment of gaming and optimization technologies drives revenue growth in the market.

Key Trends & Opportunities

Shift Toward Cloud-Based Optimization

A key trend in the mobile video optimization market is the shift toward cloud-based solutions. Cloud platforms provide scalability, cost-efficiency, and faster deployment compared to on-premise systems. Service providers can dynamically manage network traffic and deliver enhanced video experiences using AI-driven analytics. This transition supports real-time monitoring and adaptive optimization across devices and regions. As enterprises and telecom operators increasingly adopt cloud ecosystems, the demand for cloud-native optimization tools grows, opening strong opportunities for vendors and solution providers.

  • For instance, in 2023, Ericsson introduced its Cloud RAN solutions that allow operators to virtualize network functions in the cloud, enabling more flexible video delivery.

Integration of AI and Machine Learning

The integration of AI and machine learning in video optimization is creating new growth opportunities. These technologies enable predictive analytics, automated traffic management, and personalized video delivery. AI-powered solutions can identify patterns in user behavior, optimize bandwidth allocation, and enhance video quality dynamically. Machine learning algorithms improve compression efficiency and reduce data usage without affecting performance. The push for intelligent networks and 5G deployments makes AI-driven optimization central to future advancements, positioning it as a transformative opportunity in the market.

  • For instance, Netflix’s recommendation engine uses sophisticated AI and machine learning algorithms to suggest content that users are likely to enjoy.

Mobile Video Optimization Market share

Key Challenges

Rising Network Complexity

The increasing complexity of mobile networks poses a major challenge for video optimization providers. The introduction of 5G, combined with legacy 3G and 4G infrastructure, creates fragmented environments that require tailored optimization strategies. Managing diverse device ecosystems and varying traffic loads adds further complications. Providers must continuously innovate to ensure seamless integration of optimization tools across multi-layered networks. This complexity increases implementation costs and technical barriers, limiting adoption among smaller operators and slowing overall market penetration.

Data Privacy and Security Concerns

Data privacy and security challenges hinder the adoption of mobile video optimization solutions. Optimization often requires processing and analyzing user data, raising concerns about compliance with regulations such as GDPR and CCPA. Any breach or misuse of sensitive data can lead to reputational damage and financial penalties. Enterprises and telecom providers face added scrutiny while deploying these technologies. Addressing privacy through secure architectures, encryption, and transparent practices is critical to building trust and expanding adoption in this market.

High Infrastructure and Deployment Costs

The high cost of infrastructure upgrades and solution deployment remains a barrier to market growth. Advanced optimization solutions often require significant investment in hardware, software, and skilled expertise. For small and mid-sized telecom operators, these costs can outweigh the benefits, limiting adoption. The challenge intensifies in developing regions where budget constraints and limited technical capabilities prevail. Vendors must develop cost-effective, scalable solutions to encourage wider acceptance. Without addressing affordability, growth in several potential markets may remain restricted.

Regional Analysis

North America

North America holds the largest share of the mobile video optimization market at 32% in 2024, valued at USD 360.9 million. Strong adoption of video-on-demand, gaming, and social media platforms drives demand for advanced optimization solutions. The U.S. dominates due to its mature telecom infrastructure, rapid 5G deployment, and high smartphone penetration. Enterprises in media and entertainment continue to invest heavily in cloud-based video optimization for scalability and performance. With a projected CAGR of 8.4%, the region is expected to reach USD 685.3 million by 2032, maintaining leadership in the global market.

Europe

Europe represents a significant 25% share in 2024, valued at USD 280.1 million. Demand is driven by high mobile video consumption in markets such as the UK, Germany, and France, supported by advanced broadband and LTE infrastructure. Strong regulatory support for data efficiency and network optimization fosters adoption across enterprises and telecom providers. The region benefits from the growing popularity of OTT services and social video content. With a CAGR of 7.7%, Europe’s market is expected to reach USD 505.5 million by 2032, solidifying its position as the second-largest market globally.

Asia Pacific

Asia Pacific accounts for 23% of the market in 2024, valued at USD 259.2 million, and is the fastest-growing region. The strong CAGR of 9.7% reflects rapid smartphone adoption, affordable data plans, and a booming base of OTT subscribers in China, India, and Southeast Asia. Telecom operators face significant bandwidth pressures due to surging mobile video consumption, driving investments in optimization technologies. Japan and South Korea lead in early 5G deployment, further enhancing demand for cloud-based solutions. The market is projected to reach USD 542.7 million by 2032, strengthening Asia Pacific’s global share.

Latin America

Latin America represents a 6% share in 2024, valued at USD 63.0 million. Growing internet penetration, rising smartphone adoption, and expansion of local streaming services contribute to steady growth. Brazil and Mexico drive most of the regional demand, with enterprises and telecom providers investing in optimization tools to manage rising mobile traffic. Limited infrastructure in smaller economies slows adoption but presents future opportunities. The region is expected to grow at a CAGR of 7.4%, reaching USD 111.1 million by 2032, supported by improved broadband connectivity and digitalization initiatives.

Middle East

The Middle East holds a 5% share in 2024, valued at USD 38.9 million. Demand is concentrated in GCC countries, where rapid 5G rollouts and smart city projects fuel adoption of advanced video optimization solutions. Rising demand for streaming services and gaming further supports market expansion. Israel and Turkey also contribute to growth, driven by strong telecom investments. The region is forecasted to grow at a CAGR of 7.2%, reaching USD 67.2 million by 2032. Continued infrastructure development and digital transformation initiatives will underpin future market momentum.

Africa

Africa accounts for the smallest share at 3% in 2024, valued at USD 19.1 million. Limited network infrastructure and affordability challenges restrict large-scale adoption of optimization solutions. However, increasing smartphone penetration and expanding 4G coverage are improving conditions for market growth. South Africa leads the region, followed by Egypt, with growing demand for mobile video and social media content. The market is projected to expand at a CAGR of 5.5%, reaching USD 30.5 million by 2032, with gradual improvements in connectivity driving long-term opportunities.

Mobile Video Optimization Market segmentation

Market Segmentations:

By Application

  • Gaming
  • Social Media
  • Video Streaming

By Device Type

  • Smartphones
  • Tablets

By Deployment

  • Cloud
  • On-premise

By Video Types

  • Live (Event Based, Linear)
  • VOD (AVOD, SVOD)

By End Users

  • Consumer
  • Enterprise
  • Large Enterprises
  • SMEs

By Region

  • North America
    • U.S.
    • Canada
    • Mexico
  • Europe
    • Germany
    • France
    • U.K.
    • Italy
    • Spain
    • Rest of Europe
  • Asia Pacific
    • China
    • Japan
    • India
    • South Korea
    • South-east Asia
    • Rest of Asia Pacific
  • Latin America
    • Brazil
    • Argentina
    • Rest of Latin America
  • Middle East & Africa
    • GCC Countries
    • South Africa
    • Rest of the Middle East and Africa

Competitive Landscape

The mobile video optimization market is highly competitive, with global technology providers and telecom-focused solution vendors striving to expand their presence. Leading companies such as Akamai Technologies, Fastly, Google, Microsoft, and Lumen Technologies dominate through advanced content delivery networks and cloud-based optimization solutions. Vendors like Limelight Networks, Ericsson, ZTE Corporation, and ChinaCache International strengthen their positions by leveraging telecom partnerships and expanding infrastructure support. Competitive strategies include mergers, acquisitions, and investments in AI-driven optimization to enhance video quality and reduce bandwidth consumption. Market players also focus on regional expansions to capture high-growth markets in Asia Pacific and Latin America. Pricing flexibility, scalability, and integration with 5G ecosystems remain critical differentiators. The market is characterized by high innovation intensity, where companies prioritize real-time traffic management, adaptive streaming, and secure video delivery to maintain an edge in addressing increasing mobile data demands worldwide.

Shape Your Report to Specific Countries or Regions & Enjoy 30% Off!

Key Players

  • Akamai Technologies, Inc
  • Fastly, Inc.
  • Google LLC
  • Microsoft Corporation
  • Lumen Technologies, Inc.
  • Limelight Networks, Inc.
  • ChinaCache International Holdings Ltd.
  • Ericsson AB
  • ZTE Corporation
  • Viavi Solutions Inc.

Recent Developments

  • In January 2025, Verve completed the acquisition of Jun Group, a mobile video and gaming platform. The deal enhances Verve’s mobile ad tech portfolio, strengthening its capabilities in mobile video optimization and advertising solutions.
  • In May 2025, Aarki introduced Encore, a full-funnel mobile growth platform designed with deep neural optimization and SKAN 4-ready targeting features.
  • In February 2025, Mediaocean finalized the acquisition of Innovid, expanding its reach and strengthening its position as an independent omnichannel ad tech platform.
  • In June 2024, Verve acquired Jun Group, a mobile video and gaming platform, to boost its mobile ad tech and video optimization capabilities.

Market Concentration & Characteristics

The Mobile Video Optimization Market reflects a moderately concentrated structure, with a few global leaders controlling significant revenue share and several regional players focusing on niche opportunities. It is shaped by the dominance of companies with strong cloud infrastructure, advanced content delivery capabilities, and telecom partnerships. Competition is driven by innovation intensity, where vendors differentiate through AI-powered analytics, adaptive streaming, and low-latency delivery. The market demonstrates high entry barriers due to capital-intensive infrastructure, technical expertise requirements, and regulatory compliance challenges. It also shows strong regional variation, with mature markets such as North America and Europe leading adoption, while Asia Pacific emerges as the fastest-growing hub due to rapid mobile penetration and OTT expansion. Pricing strategies, scalability, and interoperability across devices influence vendor competitiveness. The Mobile Video Optimization Market continues to evolve with 5G rollouts, rising video consumption, and the growing need for efficient bandwidth management across global networks.

Report Coverage

The research report offers an in-depth analysis based on Application, Device Type, Deployment, Video Types and Region. It details leading market players, providing an overview of their business, product offerings, investments, revenue streams, and key applications. Additionally, the report includes insights into the competitive environment, SWOT analysis, current market trends, as well as the primary drivers and constraints. Furthermore, it discusses various factors that have driven market expansion in recent years. The report also explores market dynamics, regulatory scenarios, and technological advancements that are shaping the industry. It assesses the impact of external factors and global economic changes on market growth. Lastly, it provides strategic recommendations for new entrants and established companies to navigate the complexities of the market.

Future Outlook

  1. Growing global smartphone penetration will drive continuous demand for seamless, high-quality mobile video experiences.
  2. Cloud-based optimization platforms will dominate adoption, offering scalability, flexibility, and cost-effective video traffic management.
  3. Accelerated 5G deployments will enhance demand for advanced video optimization tools supporting ultra-low latency streaming.
  4. AI-driven analytics and machine learning will improve predictive bandwidth allocation and real-time optimization efficiency.
  5. Enterprises will adopt advanced optimization to ensure smooth remote collaboration, conferencing, and video-based communication tools.
  6. Expanding OTT platforms will rely heavily on optimization to deliver consistent, superior user streaming experiences.
  7. Mobile gaming and eSports expansion will significantly increase demand for ultra-responsive, low-latency optimization technologies.
  8. Telecom operators will collaborate with vendors to deploy scalable video optimization solutions across diverse networks.
  9. Rising concerns around user data privacy will shape secure and compliant video optimization solutions.
  10. Emerging economies will boost growth as rising smartphone adoption fuels video consumption and digital transformation.

CHAPTER NO. 1 :   GENESIS OF THE MARKET       

1.1 Market Prelude – Introduction & Scope

1.2 The Big Picture – Objectives & Vision

1.3 Strategic Edge – Unique Value Proposition

1.4 Stakeholder Compass – Key Beneficiaries      

CHAPTER NO. 2 :   EXECUTIVE LENS

2.1 Pulse of the Industry – Market Snapshot

2.2 Growth Arc – Revenue Projections (USD Million)      

2.3. Premium Insights – Based on Primary Interviews 

CHAPTER NO. 3 :   MOBILE VIDEO OPTIMIZATION MARKET FORCES & INDUSTRY PULSE

3.1 Foundations of Change – Market Overview
3.2 Catalysts of Expansion – Key Market Drivers
3.2.1 Momentum Boosters – Growth Triggers
3.2.2 Innovation Fuel – Disruptive Technologies
3.3 Headwinds & Crosswinds – Market Restraints
3.3.1 Regulatory Tides – Compliance Challenges
3.3.2 Economic Frictions – Inflationary Pressures
3.4 Untapped Horizons – Growth Potential & Opportunities
3.5 Strategic Navigation – Industry Frameworks
3.5.1 Market Equilibrium – Porter’s Five Forces
3.5.2 Ecosystem Dynamics – Value Chain Analysis
3.5.3 Macro Forces – PESTEL Breakdown

3.6 Price Trend Analysis

    3.6.1 Regional Price Trend
3.6.2 Price Trend by product

CHAPTER NO. 4 :   KEY INVESTMENT EPICENTER           

4.1 Regional Goldmines – High-Growth Geographies

4.2 Product Frontiers – Lucrative Product Categories

4.3 Device Type Sweet Spots – Emerging Demand Segments         

CHAPTER NO. 5: REVENUE TRAJECTORY & WEALTH MAPPING

5.1 Momentum Metrics – Forecast & Growth Curves

5.2 Regional Revenue Footprint – Market Share Insights

5.3 Segmental Wealth Flow – Application & Device Type Revenue

CHAPTER NO. 6 :   TRADE & COMMERCE ANALYSIS      

6.1.      Import Analysis by Region   

6.1.1.   Global Mobile Video Optimization Market Import Revenue By Region

6.2.      Export Analysis by Region   

6.2.1.   Global Mobile Video Optimization Market Export Revenue By Region

CHAPTER NO. 7 :   COMPETITION ANALYSIS         

7.1.      Company Market Share Analysis      

7.1.1.   Global Mobile Video Optimization Market: Company Market Share

7.2.      Global Mobile Video Optimization Market Company Revenue Market Share

7.3.      Strategic Developments        

7.3.1.   Acquisitions & Mergers        

7.3.2.   New Product Launch

7.3.3.   Regional Expansion

7.4.      Competitive Dashboard

7.5.    Company Assessment Metrics, 2024

CHAPTER NO. 8 :   MOBILE VIDEO OPTIMIZATION MARKET – BY APPLICATION SEGMENT ANALYSIS 

8.1.      Mobile Video Optimization Market Overview by Application Segment     

8.1.1.   Mobile Video Optimization Market Revenue Share By Application

8.2.      Gaming

8.3.      Social Media

8.4.      Video Streaming

CHAPTER NO. 9 :   MOBILE VIDEO OPTIMIZATION MARKET – BY DEVICE TYPE SEGMENT ANALYSIS  

9.1.      Mobile Video Optimization Market Overview by Device Type Segment

9.1.1.   Mobile Video Optimization Market Revenue Share By Device Type

9.2.      Smartphones

9.3.      Tablets

CHAPTER NO. 10 : MOBILE VIDEO OPTIMIZATION MARKET – BY DEPLOYMENT SEGMENT ANALYSIS 

10.1.    Mobile Video Optimization Market Overview by Deployment Segment    

10.1.1. Mobile Video Optimization Market Revenue Share By Deployment

10.2.    Cloud

10.3.    On-premise

CHAPTER NO. 11 : MOBILE VIDEO OPTIMIZATION MARKET – BY VIDEO TYPES SEGMENT ANALYSIS

11.1.    Mobile Video Optimization Market Overview by Video Types Segment   

11.1.1. Mobile Video Optimization Market Revenue Share By Video Types

11.2.    Live (Event Based, Linear)

11.3.    VOD (AVOD, SVOD)

CHAPTER NO. 12 : MOBILE VIDEO OPTIMIZATION MARKET – BY END USERS SEGMENT ANALYSIS    

12.1.    Mobile Video Optimization Market Overview by End Users Segment

12.1.1. Mobile Video Optimization Market Revenue Share By End Users

12.2.    Consumer

12.3.    Enterprise (Large Enterprises, SMEs)

CHAPTER NO. 13 : MOBILE VIDEO OPTIMIZATION MARKET – REGIONAL ANALYSIS

13.1.    Mobile Video Optimization Market Overview by Region Segment

13.1.1. Global Mobile Video Optimization Market Revenue Share By Region

13.1.2. Regions          

13.1.3. Global Mobile Video Optimization Market Revenue By Region     

13.1.4. Application    

13.1.5. Global Mobile Video Optimization Market Revenue By Application         

13.1.6. Device Type  

13.1.7. Global Mobile Video Optimization Market Revenue By Device Type

13.1.8. Deployment   

13.1.9. Global Mobile Video Optimization Market Revenue By Deployment

13.1.10.           Video Types

13.1.12.           Global Mobile Video Optimization Market Revenue By Video Types

13.1.13.           End Users

13.1.14.           Global Mobile Video Optimization Market Revenue By End Users

CHAPTER NO. 14 : NORTH AMERICA MOBILE VIDEO OPTIMIZATION MARKET – COUNTRY ANALYSIS        

14.1.    North America Mobile Video Optimization Market Overview by Country Segment

14.1.1. North America Mobile Video Optimization Market Revenue Share By Region           

14.2.    North America           

14.2.1. North America Mobile Video Optimization Market Revenue By Country  

14.2.2. Application    

14.2.3. North America Mobile Video Optimization Market Revenue By Application            

14.2.4. Device Type  

14.2.5. North America Mobile Video Optimization Market Revenue By Device Type            

14.2.6. Deployment   

14.2.7. North America Mobile Video Optimization Market Revenue By Deployment            

14.2.8. Video Types  

14.2.9. North America Mobile Video Optimization Market Revenue By Video Types

14.2.10.           End Users      

14.2.11.           North America Mobile Video Optimization Market Revenue By End Users  

14.3.    U.S.    

14.4.    Canada           

14.5.    Mexico           

CHAPTER NO. 15 : EUROPE MOBILE VIDEO OPTIMIZATION MARKET – COUNTRY ANALYSIS      

15.1.    Europe Mobile Video Optimization Market Overview by Country Segment

15.1.1. Europe Mobile Video Optimization Market Revenue Share By Region

15.2.    Europe

15.2.1. Europe Mobile Video Optimization Market Revenue By Country   

15.2.2. Application    

15.2.3. Europe Mobile Video Optimization Market Revenue By Application         

15.2.4. Device Type  

15.2.5. Europe Mobile Video Optimization Market Revenue By Device Type

15.2.6. Deployment   

15.2.7. Europe Mobile Video Optimization Market Revenue By Deployment

15.2.8. Video Types  

15.2.9. Europe Mobile Video Optimization Market Revenue By Video Types

15.2.10.           End Users      

15.2.11.           Europe Mobile Video Optimization Market Revenue By End Users

15.3.    UK     

15.4.    France

15.5.    Germany        

15.6.    Italy    

15.7.    Spain  

15.8.    Russia

15.9.   Rest of Europe

CHAPTER NO. 16 : ASIA PACIFIC MOBILE VIDEO OPTIMIZATION MARKET – COUNTRY ANALYSIS        

16.1.    Asia Pacific Mobile Video Optimization Market Overview by Country Segment         

16.1.1. Asia Pacific Mobile Video Optimization Market Revenue Share By Region            

16.2.    Asia Pacific   

16.2.1. Asia Pacific Mobile Video Optimization Market Revenue By Country

16.2.2. Application    

16.2.3. Asia Pacific Mobile Video Optimization Market Revenue By Application

16.2.4. Device Type  

16.2.5. Asia Pacific Mobile Video Optimization Market Revenue By Device Type            

16.2.6. Deployment   

16.2.7. Asia Pacific Mobile Video Optimization Market Revenue By Deployment            

16.2.8. Video Types  

16.2.9. Asia Pacific Mobile Video Optimization Market Revenue By Video Types            

16.2.10.           End Users      

16.2.11.           Asia Pacific Mobile Video Optimization Market Revenue By End Users  

16.3.    China 

16.4.    Japan  

16.5.    South Korea   

16.6.    India   

16.7.    Australia        

16.8.    Southeast Asia

16.9.    Rest of Asia Pacific

CHAPTER NO. 17 : LATIN AMERICA MOBILE VIDEO OPTIMIZATION MARKET – COUNTRY ANALYSIS

17.1.    Latin America Mobile Video Optimization Market Overview by Country Segment

17.1.1. Latin America Mobile Video Optimization Market Revenue Share By Region            

17.2.    Latin America

17.2.1. Latin America Mobile Video Optimization Market Revenue By Country

17.2.2. Application    

17.2.3. Latin America Mobile Video Optimization Market Revenue By Application

17.2.4. Device Type  

17.2.5. Latin America Mobile Video Optimization Market Revenue By Device Type            

17.2.6. Deployment   

17.2.7. Latin America Mobile Video Optimization Market Revenue By Deployment            

17.2.8. Video Types  

17.2.9. Latin America Mobile Video Optimization Market Revenue By Video Types            

17.2.10.           End Users      

17.2.11.           Latin America Mobile Video Optimization Market Revenue By End Users  

17.3.    Brazil 

17.4.    Argentina       

17.5.    Rest of Latin America

CHAPTER NO. 18 : MIDDLE EAST MOBILE VIDEO OPTIMIZATION MARKET – COUNTRY ANALYSIS

18.1.    Middle East Mobile Video Optimization Market Overview by Country Segment

18.1.1. Middle East Mobile Video Optimization Market Revenue Share By Region            

18.2.    Middle East   

18.2.1. Middle East Mobile Video Optimization Market Revenue By Country

18.2.2. Application    

18.2.3. Middle East Mobile Video Optimization Market Revenue By Application

18.2.4. Device Type  

18.2.5. Middle East Mobile Video Optimization Market Revenue By Device Type

18.2.6. Deployment

18.2.7. Middle East Mobile Video Optimization Market Revenue By Deployment            

18.2.8. Video Types

18.2.9. Middle East Mobile Video Optimization Market Revenue By Video Types            

18.2.10.           End Users

18.2.11.           Middle East Mobile Video Optimization Market Revenue By End Users  

18.3.    GCC Countries          

18.4.    Israel

18.5.    Turkey

18.6.    Rest of Middle East   

CHAPTER NO. 19 : AFRICA MOBILE VIDEO OPTIMIZATION MARKET – COUNTRY ANALYSIS      

19.1.    Africa Mobile Video Optimization Market Overview by Country Segment

19.1.1. Africa Mobile Video Optimization Market Revenue Share By Region       

19.2.    Africa

19.2.1. Africa Mobile Video Optimization Market Revenue By Country    

19.2.2. Application    

19.2.3. Africa Mobile Video Optimization Market Revenue By Application          

19.2.4. Device Type  

19.2.5. Africa Mobile Video Optimization Market Revenue By Device Type

19.2.6. Deployment   

19.2.7. Africa Mobile Video Optimization Market Revenue By Deployment

19.2.8. Video Types  

19.2.9. Africa Mobile Video Optimization Market Revenue By Video Types

19.2.10.           End Users      

19.2.11.           Africa Mobile Video Optimization Market Revenue By End Users

19.3.    South Africa

19.4.    Egypt 

19.5.    Rest of Africa

CHAPTER NO. 20 : COMPANY PROFILES     

20.1.    Akamai Technologies, Inc.

20.1.1. Company Overview   

20.1.2. Product Portfolio       

20.1.3. Financial Overview   

20.1.4. Recent Developments

20.1.5. Growth Strategy        

20.1.6. SWOT Analysis        

20.2.    Fastly, Inc.

20.3.    Google LLC

20.4.    Microsoft Corporation

20.5.    Lumen Technologies, Inc.

20.6.    Limelight Networks, Inc.

20.7.    ChinaCache International Holdings Ltd.

20.8.    Ericsson AB

20.9.    ZTE Corporation

20.10.  Viavi Solutions Inc.

Request Free Sample

Ready to Transform Data into Decisions?

Request Your Sample Report and Start Your Journey of Informed Choices


Providing the strategic compass for industry titans.

cr-clients-logos

Frequently Asked Questions:

What is the projected growth of the Mobile Video Optimization Market?

The Mobile Video Optimization Market reached USD 1,021.2 million in 2024 and is projected to grow significantly, reaching USD 1,942.3 million by 2032.

What are the primary factors driving the growth of the Mobile Video Optimization Market?

Key drivers include the rising demand for high-quality video streaming, the growing use of mobile devices for video consumption, and the increasing popularity of video platforms like YouTube, Netflix, and TikTok.

How does 5G technology influence the Mobile Video Optimization Market?

The rollout of 5G technology is expected to significantly enhance the market by enabling faster data speeds and lower latency, improving video delivery and reducing buffering for a better user experience.

Which regions are leading the Mobile Video Optimization Market?

North America and Europe are the leading regions, driven by high smartphone penetration, advanced mobile networks, and a strong demand for seamless mobile video experiences.

How is the Mobile Video Optimization Market evolving in emerging regions?

In regions such as Asia Pacific, Latin America, and the Middle East & Africa, the market is expanding as mobile video consumption increases and internet infrastructure continues to improve, driving the adoption of mobile video optimization solutions.

About Author

Sushant Phapale

Sushant Phapale

ICT & Automation Expert

Sushant is an expert in ICT, automation, and electronics with a passion for innovation and market trends.

View Profile

Related Reports By Keyword

Mobile Device Management Market

Mobile Device Management Market size was valued at USD 3,050.0 million in 2018 to USD 6,490.6 million in 2024 and is anticipated to reach USD 36,465.1 million by 2032, at a CAGR of 24.2% during the forecast period.

Predictive Automobile Technology Market

The Predictive automobile technology market is projected to grow from USD 69.8 billion in 2024 to an estimated USD 136 billion by 2032, with a compound annual growth rate (CAGR) of 8.7% during the forecast period.

Mobile Phone Loudspeaker Market

The mobile phone loudspeaker market is projected to grow from USD 5,880 million in 2024 to USD 8,555.9 million by 2032, registering a CAGR of 4.8% during the forecast period.

Manual Lifting Mobile Light Tower Market

Manual Lifting Mobile Light Tower Market size was valued at USD 3972.6 million in 2024 and is anticipated to reach USD 5959.4 million by 2032, at a CAGR of 5.2% during the forecast period.

Mobile Hydraulic Equipment Market

The Mobile Hydraulic Equipment Market size was valued at USD 14534 million in 2024 and is anticipated to reach USD 22305.1 million by 2032, at a CAGR of 5.5% during the forecast period (2024-2032).

North America Rolling/Mobile Scaffolding Market

The North America Rolling/Mobile Scaffolding market size was valued at USD 271.75 million in 2018, increased to USD 421.52 million in 2024, and is anticipated to reach USD 778.65 million by 2032, at a CAGR of 7.4% during the forecast period.

Europe Rolling/Mobile Scaffolding Market

The Europe Rolling/Mobile Scaffolding market size was valued at USD 175.51 million in 2018 and grew to USD 261.41 million in 2024. It is anticipated to reach USD 437.14 million by 2032, expanding at a CAGR of 6.1% during the forecast period.

Rolling/Mobile Scaffolding Market

The Rolling/Mobile Scaffolding market size was valued at USD 942.44 million in 2018, increased to USD 1,485.22 million in 2024, and is anticipated to reach USD 2,732.02 million by 2032, at a CAGR of 7.37% during the forecast period.

Mobile Phone Packaging Market

The Mobile Phone Packaging Market is projected to grow from USD 9,696 million in 2024 to an estimated USD 15,676 million by 2032, with a compound annual growth rate (CAGR) of 6.19% from 2024 to 2032.

Purchase Options

The report comes as a view-only PDF document, optimized for individual clients. This version is recommended for personal digital use and does not allow printing. Use restricted to one purchaser only.
$4999

To meet the needs of modern corporate teams, our report comes in two formats: a printable PDF and a data-rich Excel sheet. This package is optimized for internal analysis. Unlimited users allowed within one corporate location (e.g., regional office).
$6999

The report will be delivered in printable PDF format along with the report’s data Excel sheet. This license offers 100 Free Analyst hours where the client can utilize Credence Research Inc. research team. Permitted for unlimited global use by all users within the purchasing corporation, such as all employees of a single company.
$12999

Credence Staff 3

WILLIAM, North America

Support Staff at Credence Research

KEITH PHILLIPS, Europe

Lee - CR Sales Staff

LEE VALLANCE, Asia Pacific

Kieran Jameson

KIERAN JAMESON, Australia

Report delivery within 24 to 48 hours

User Review

Thank you for the data! The numbers are exactly what we asked for and what we need to build our business case.

Materials Scientist
(privacy requested)

User Review

The report was an excellent overview of the Industrial Burners market. This report does a great job of breaking everything down into manageable chunks.

Imre Hof
Management Assistant, Bekaert

cr-clients-logos

Request Sample