
Market Overview:
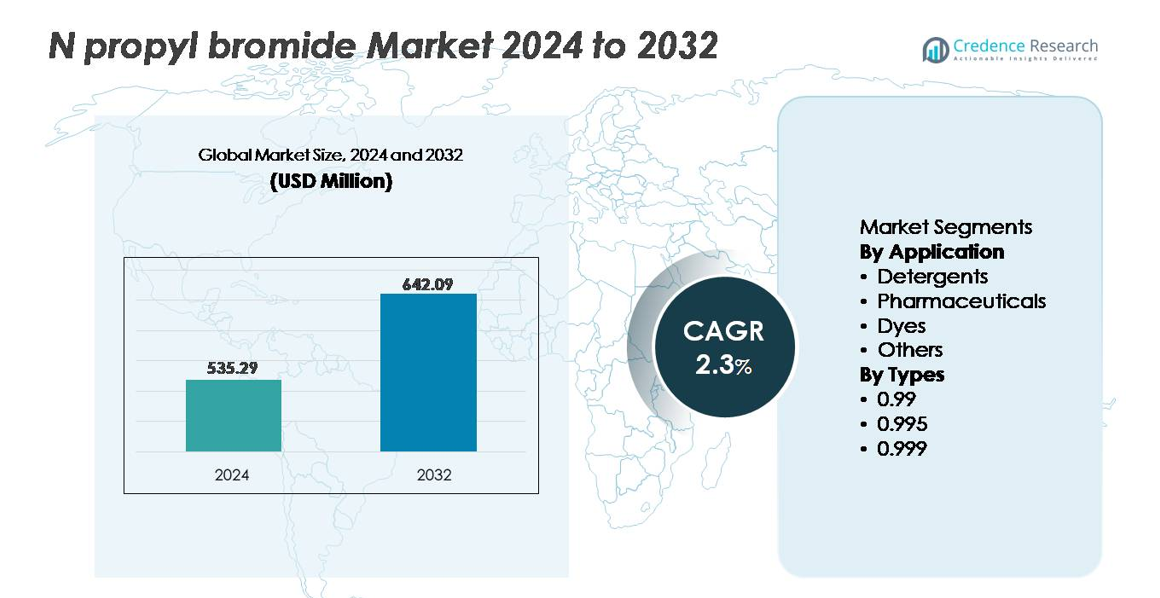
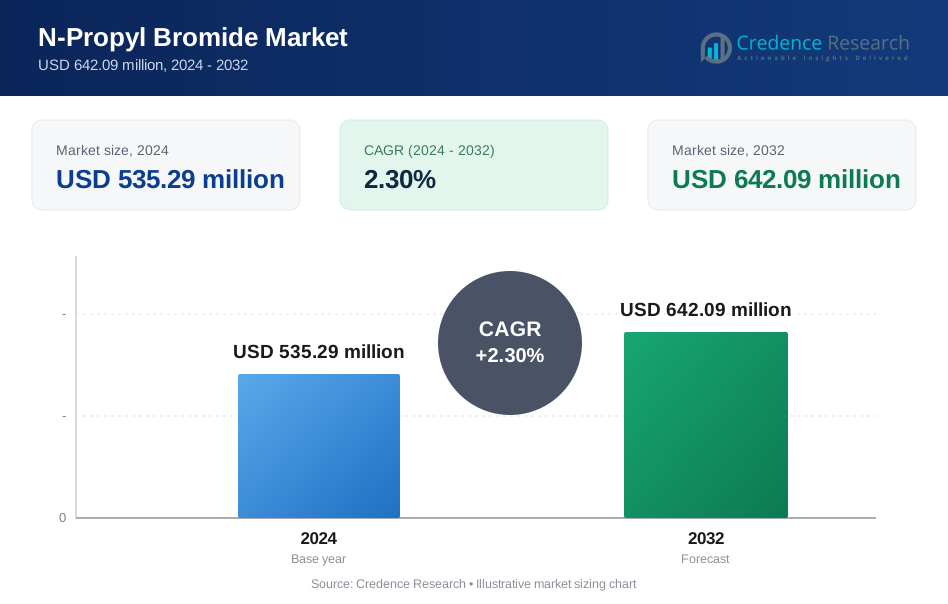
The N-Propyl Bromide market was valued at USD 535.29 million in 2024 and is projected to reach USD 642.09 million by 2032, advancing at a CAGR of 2.3% during the forecast period.
| REPORT ATTRIBUTE | DETAILS |
|---|---|
| Historical Period | 2020-2023 |
| Base Year | 2024 |
| Forecast Period | 2025-2032 |
| N-Propyl Bromide Market Size 2024 | USD 535.29 million |
| N-Propyl Bromide Market, CAGR | 2.3% |
| N-Propyl Bromide Market Size 2032 | USD 642.09 million |
The N-propyl bromide market is shaped by a diverse group of international and regional producers, including Tongcheng Medicine Technology, Shandong Moris Tech, Albemarle, Solaris Chemtech (SCIL), Shenrunfa, ICL, Longsheng Chemical, Lanxess, Shouguang Fukang Pharmaceutical, and Weifang Longwei Industrial. These companies compete through product purity differentiation, strategic distribution partnerships, and alignment with industrial cleaning and chemical synthesis requirements. Asia-Pacific leads the market with approximately 34% share, driven by its expanding pharmaceutical and electronics manufacturing ecosystem, followed by North America and Europe with strong adoption in precision cleaning, aerospace, and specialty chemical applications.
Market Insights:
- The N-propyl bromide market was valued at USD 535.29 million in 2024 and is projected to reach USD 642.09 million by 2032, registering a CAGR of 2.30% during the forecast period.
- Market growth is driven by increasing demand in industrial cleaning and degreasing applications, particularly from aerospace, automotive, and electronics manufacturing, where precision solvent performance supports stringent efficiency and quality requirements.
- Trends include a shift toward optimized solvent formulations, adoption of controlled-emission systems, and opportunities in developing manufacturing hubs that require consistent and scalable chemical intermediates.
- The competitive landscape features global and regional manufacturers focusing on purity grade differentiation, cost efficiency, and distribution alliances, while addressing sustainability expectations and regulatory compliance.
- Asia-Pacific accounts for nearly 34% market share, followed by North America at 32% and Europe at 27%, while the detergents segment holds the largest share among applications, supported by high usage in vapor degreasing and metal cleaning operations.
Market Segmentation Analysis:
By Application
The detergents segment represents the dominant application in the N-propyl bromide market, accounting for the largest share due to its widespread use as a solvent and cleaning agent in industrial degreasing and precision cleaning operations. Rising demand from metal cleaning, automotive maintenance, and aerospace component processing continues to reinforce segment growth. Pharmaceuticals emerge as the fastest-growing application as N-propyl bromide is increasingly adopted for intermediate synthesis. The dyes and other segments remain niche but benefit from expanding chemical manufacturing and developing formulations requiring high-purity brominated compounds.
- For instance, Lanxess Solutions US Inc. reports n-propyl bromide with a boiling point of ≈71°C, water solubility around 25 g per 100 g at 20°C, and density near 1.35 g/mL, enabling effective vapor-phase degreasing for machined components used in aerospace and automotive systems.
By Type
The 0.999 purity grade segment holds the dominant share in the N-propyl bromide market, driven by its suitability for high-specification applications in pharmaceuticals, electronics cleaning, and fine chemical processing. Its demand accelerates with growing regulatory scrutiny favoring higher purity solvents to ensure product consistency and reduced impurities. The 0.995 and 0.99 grades remain cost-effective choices in metal degreasing, industrial cleaning, and general chemical formulations, where ultrahigh purity is non-critical, enabling manufacturers to balance operational performance and procurement costs.
- For instance, Aarnee International documents its pharmaceutical-grade n-propyl bromide with GC purity ≥ 99.9%, moisture content ≤0.10%, and maximum iso-propyl bromide impurity ≤0.05%, ensuring controlled alkylation reactions for API intermediate synthesis and minimizing reaction byproduct formation.
Key Growth Drivers:
Expanding Demand in Industrial Cleaning and Degreasing Applications
The rise of precision cleaning and industrial degreasing requirements across automotive, aerospace, and electronics manufacturing remains a primary driver for N-propyl bromide. Its solvent properties, low boiling point, and compatibility with metal, composite, and electronic substrates support adoption where residue-free cleaning is essential. Growing production of aircraft components, microelectronic assemblies, and engine blocks strengthens usage in maintenance and fabrication cycles. Additionally, industries continue to replace legacy solvents to achieve higher operational efficiency, while the metalworking and machining sectors adopt N-propyl bromide to improve throughput and precision. The shift to compact and intricate component design increases the need for solvents capable of reaching microstructures without degrading surfaces. This demand aligns with N-propyl bromide’s effectiveness in vapor degreasing systems, reinforcing long-term market utilization as industrial cleaning becomes more complex and safety- and performance-driven.
- For instance, Reliance Specialty Products manufactures n-propyl-bromide (nPB) based solvents and vapor degreasing systems with design features that enhance solvent vapor containment, such as NESHAP-compliant freeboard ratios, to minimize emissions and maintain cleaning consistency for aerospace components. Their nPB product, EnTron-Aero, is approved by Boeing under the BAC 5408 specification.
Rising Pharmaceutical Intermediate Utilization
Growing pharmaceutical production and the increasing complexity of chemical synthesis processes support the rising use of N-propyl bromide as an intermediate and reactant in the formation of active pharmaceutical ingredients. Manufacturers prioritize solvent systems that enable consistent yield, stable reaction pathways, and controlled impurities, making N-propyl bromide a preferred option for specific halogenation and substitution steps. The expansion of generic drug production and active ingredient outsourcing to contract manufacturing organizations drives solvent procurement volumes. Demand also strengthens with diversified API pipelines targeting chronic illness management and specialty therapeutics. As pharmaceutical facilities implement quality-by-design and adopt advanced synthesis platforms, solvent standardization and reaction optimization bolster the continuity of N-propyl bromide usage. Although closely monitored under regulatory frameworks, its suitability in niche synthesis maintains its relevance, especially in formulations requiring precision halide chemistry under controlled reaction environments.
- For instance, LANXESS confirms its "non-stabilized grade" N-propyl bromide, formulated specifically for chemical synthesis, restricting iso-propyl bromide impurity levels to $\le$0.05% and maintaining GC purity above 99.5%, enabling controlled halogen-substitution reactions in API development without side-path isomerization events.
Growth in Chemical Synthesis and Specialty Formulation Manufacturing
N-propyl bromide continues to gain relevance in dyes, adhesives, resins, and specialty chemicals manufacturing due to its role as a feedstock and reaction solvent. Expansion in the coatings and performance materials sectors increases consumption where brominated intermediates are integral to achieving durability, adhesion, and heat-resistant characteristics. The dyes sector benefits from ongoing demand in textiles, printing technologies, and industrial coloration, requiring brominated compounds for formulation enhancements. Specialty chemical producers seek solvents with tailored volatility and reactivity characteristics to ensure consistent batch outcomes. As emerging markets develop chemical production capacity, local manufacturers adopt N-propyl bromide due to availability, familiar industrial performance, and process alignment with existing infrastructure. Despite shifting environmental standards, the chemical processing sector continues to rely on stable halogenated solvents for specific production pathways where alternatives may compromise performance or yield.
Key Trends & Opportunities:
Transition Toward Optimized Formulations and Controlled Emission Solvent Systems
A notable trend is the shift toward controlled emission technologies and closed-loop solvent systems driven by sustainability and workplace safety objectives. Equipment upgrades in solvent recovery, vapor containment, and filtration enable extended solvent lifecycle and reduce operational losses, improving cost efficiency. Manufacturers introduce improved formulations engineered for stability under high-temperature or precision cleaning environments, supporting adoption in electronics, optics, and metal processing sectors. Companies capitalize on opportunities to develop application-specific grades for pharmaceuticals, aerospace, or semiconductor production, where tightening quality assurance creates a demand for predictable, traceable solvent performance. Automation further enhances vapor degreasing operations, feeding long-term growth in advanced manufacturing supply chains seeking repeatable, defect-free outcomes.
- For instance, Reliance Specialty Products reports that its engineered n-propyl-bromide vapor degreasing platforms achieve solvent recovery efficiencies of up to 98% using integrated fractional distillation and refrigerated condensation stages, extending solvent lifecycle and significantly lowering emissions during aerospace maintenance cleaning cycles.
Emerging Opportunities in Developing Manufacturing Hubs
Expansion of chemical, electronics assembly, and precision metal manufacturing across Southeast Asia, Latin America, and parts of Eastern Europe presents significant opportunities for N-propyl bromide suppliers. These regions invest in fabrication and component finishing facilities serving global export markets, increasing solvent consumption in intermediary processes. Lower operational costs and expanding industrial corridors attract international producers, driving demand for reliable supply of processing chemicals. Local regulatory frameworks evolve more gradually compared to mature markets, allowing stakeholders to operate within compliance while building capacity. As SME manufacturers pursue solvent standardization, demand rises for consistent purity grades tailored to diverse applications, positioning N-propyl bromide as a viable near-term option across developing industrial ecosystems.
- For instance, LANXESS supplies stabilized n-propyl bromide engineered for industrial cleaning environments through its global distribution network, leveraging product specifications that include boiling point of 71°C, density about 1.35 g/mL, and water solubility ≈0.25 g per 100 g water, supporting adoption in facilities transitioning from aqueous to vapor-phase degreasing.
Key Challenges:
Evolving Environmental and Occupational Safety Regulations
Regulatory scrutiny related to air emissions, workplace exposure, and environmental persistence presents a major challenge to the long-term adoption of N-propyl bromide. Authorities continue to evaluate its inclusion under controlled substance lists, compelling end users to adopt mitigation technologies or reformulate processes. Compliance costs rise with mandated monitoring, ventilation upgrades, and exposure control programs. These shifts create uncertainty for downstream industries relying on predictable chemical availability. Any future reclassification or tightened usage restrictions could accelerate customers’ transition to alternative solvents, especially in pharmaceuticals and consumer product applications. Regulatory divergence across markets further complicates supply chains, requiring region-specific formulation strategies and risk management planning.
Substitution Risk from Alternative Solvents and Process Technologies
Industries increasingly explore alternative solvents and non-solvent cleaning technologies, posing a competitive challenge to N-propyl bromide. Water-based systems, modified alcohols, and engineered green solvents gain attention as companies seek reduction of hazardous chemical handling. Advanced vapor recovery designs and laser cleaning technologies reduce reliance on chemical agents entirely. End users evaluate substitution not only for compliance alignment but to enhance corporate sustainability commitments and ESG disclosures. As manufacturing sectors adopt digital quality control and robotics, solvent-dependent cleaning steps may be reduced or redesigned, potentially lowering demand. Suppliers must innovate to maintain relevance, focusing on process compatibility, cost-performance balance, and technology integration to address substitution pressures.
Regional Analysis:
North America
North America holds the largest share of the N-propyl bromide market at approximately 32%, driven by strong demand in industrial cleaning, vapor degreasing, and electronics component maintenance. The aerospace and defense manufacturing corridor across the United States remains a major consumption hub due to high precision cleaning requirements. Pharmaceuticals and specialty chemical synthesis further contribute to regional growth. Regulatory evaluations by environmental agencies influence product substitution and technology upgrades, encouraging adoption of controlled emission systems. Canada’s expanding metal fabrication and machining industries also drive demand, reinforcing North America’s position as a high-value, technology-integrated market for N-propyl bromide.
Europe
Europe represents about 27% of the global N-propyl bromide market, led by established manufacturing bases in Germany, Italy, and France. The region sees steady consumption in metal finishing, automotive components, coatings, and chemical synthesis. Environmental regulations encourage solvent recovery technologies, pushing end users toward vapor containment and lifecycle optimization systems. Demand from pharmaceutical intermediate production remains stable as regulatory consistency supports process continuity. Eastern Europe emerges as a cost-competitive manufacturing hub, increasing procurement of industrial solvents. While sustainability policies influence usage patterns, Europe retains a strong installed base that sustains recurring industrial solvent demand.
Asia-Pacific
Asia-Pacific accounts for approximately 34% market share, making it the fastest-growing regional market for N-propyl bromide. Expanding electronics assembly, automotive manufacturing, and export-oriented chemical production in China, India, South Korea, and ASEAN nations drive solvent usage in precision cleaning and synthesis applications. Rapid growth of contract manufacturing organizations and generic pharmaceutical production further elevates demand for high-purity grades. Lower adoption barriers and industrial expansion attract global suppliers to strengthen supply chains in the region. Despite evolving regulatory frameworks, cost advantages and large-volume manufacturing activity establish Asia-Pacific as a strategic growth engine for N-propyl bromide.
Latin America
Latin America represents nearly 4% of the global market, driven primarily by industrial cleaning, metal components processing, and emerging pharmaceutical packaging industries. Brazil and Mexico serve as key demand centers, supported by growing automotive component production and chemical processing capabilities. Regional industrialization initiatives and export manufacturing programs create opportunities for niche solvent applications. However, reliance on imported chemical intermediates and exposure to price fluctuations moderate growth. As production facilities modernize and incorporate better solvent handling technologies, N-propyl bromide consumption is expected to remain stable with localized growth pockets.
Middle East & Africa
The Middle East & Africa region holds around 3% market share, supported by developing industrial clusters and growing investments in oilfield chemicals, metal fabrication, and machinery maintenance. The UAE and Saudi Arabia lead demand due to their expanding industrial diversification strategies. Adoption remains concentrated within industrial solvents and specialty formulations. Infrastructure modernization and equipment refurbishment create additional market opportunities. However, regulatory alignment and dependence on external suppliers influence pricing and procurement stability. As industrial zones mature, controlled-use solvent applications are expected to gain traction, positioning the region for gradual market expansion.
Market Segmentations:
By Application
- Detergents
- Pharmaceuticals
- Dyes
- Others
By Types
- 0.99
- 0.995
- 0.999
By Geography
- North America
- U.S.
- Canada
- Mexico
- Europe
- Germany
- France
- U.K.
- Italy
- Spain
- Rest of Europe
- Asia Pacific
- China
- Japan
- India
- South Korea
- South-east Asia
- Rest of Asia Pacific
- Latin America
- Brazil
- Argentina
- Rest of Latin America
- Middle East & Africa
- GCC Countries
- South Africa
- Rest of the Middle East and Africa
Competitive Landscape:
The competitive landscape of the N-propyl bromide market is characterized by a mix of global chemical producers and regional manufacturers focusing on solvent production, pharmaceutical intermediates, and specialty chemical applications. Competition is driven by product purity grades, pricing strategies, and long-term supply agreements with industrial cleaning, electronics, and chemical processing companies. Manufacturers emphasize solvent recovery compatibility, formulation stability, and compliance with evolving environmental regulations to sustain customer retention. Expansion into emerging manufacturing hubs in Asia-Pacific and Latin America forms a key strategy to reduce logistics costs and strengthen distribution networks. Partnerships with technology integrators in vapor degreasing systems support differentiation through performance-focused solutions. Companies operating in this market compete not only on cost and purity but increasingly on sustainability practices, documentation transparency, and the ability to support process optimization in regulatory-strengthened industries.
Key Player Analysis:
- Tongcheng Medicine Technology
- Shandong Moris Tech
- Albemarle
- Solaris Chemtech (SCIL)
- Shenrunfa
- ICL
- Longsheng Chemical
- Lanxess
- Shouguang Fukang Pharmaceutical
- Weifang Longwei Industrial
Recent Developments:
- In April 2025, Tongcheng Medicine Technology was profiled as a key global supplier of N-propyl bromide in a professional market research publication on the N-propyl bromide market for 2025–2032, confirming its continued active role in high-purity NPB supply and export.
- In 2022, Weifang Longwei Industrial The company reportedly “increased production efficiency through adoption of new catalytic processes.
Report Coverage:
The research report offers an in-depth analysis based on Application, Type and Geography. It details leading market players, providing an overview of their business, product offerings, investments, revenue streams, and key applications. Additionally, the report includes insights into the competitive environment, SWOT analysis, current market trends, as well as the primary drivers and constraints. Furthermore, it discusses various factors that have driven market expansion in recent years. The report also explores market dynamics, regulatory scenarios, and technological advancements that are shaping the industry. It assesses the impact of external factors and global economic changes on market growth. Lastly, it provides strategic recommendations for new entrants and established companies to navigate the complexities of the market.
Future Outlook:
- Demand will continue to develop in precision cleaning applications across aerospace and electronics manufacturing.
- Pharmaceutical intermediate usage will remain a stable contributor as synthesis pathways retain halogenated reactants.
- Adoption of controlled-emission and solvent recovery technologies will extend lifecycle value for industrial users.
- Regulatory evaluation will influence formulation innovation and alternative solvent positioning.
- Asia-Pacific will maintain its role as the fastest-growing manufacturing hub for solvent-related applications.
- Manufacturers will differentiate through high-purity grades and consistency for sensitive processes.
- Substitution risk will accelerate research into optimized performance-to-safety solvent profiles.
- Closed-loop vapor degreasing systems will become more widely implemented in high-precision industries.
- Strategic supply chain localization will strengthen market access in emerging regions.
- Sustainability reporting and compliance transparency will become decisive factors in supplier selection.
Request a Free Sample
Fill in your details and we'll send you a free sample report.
- Sample data tables & charts
- Research methodology
Need a Custom Version of This Report?
Tailor the scope, geography, or segments to your exact requirements.
- Custom geography or segment scope
- Direct access to our analyst team
Frequently Asked Questions
What is the current market size for the N-propyl bromide market, and what is its projected size in 2032?
At what Compound Annual Growth Rate is the N-propyl bromide market expected to grow between 2024 and 2032?
Which N-propyl bromide segment held the largest share in 2024?
What are the primary factors fueling the growth of the N-propyl bromide market?
Who are the leading companies in the N-propyl bromide market?
Table of Content
Chapter 1. Report Introduction
- 1.1 Report Description & Purpose
- 1.1.1 Report Title & Market Definition
- 1.1.2 Unique Selling Propositions (USP) & Key Differentiators
- 1.1.3 Value Proposition for Stakeholders
- 1.2 Research Objectives
- 1.2.1 Market Sizing Objectives (Volume & Revenue)
- 1.2.2 Segmentation Objectives
- 1.2.3 Competitive Intelligence Objectives
- 1.2.4 Forecast & Scenario Objectives
- 1.3 Report Scope
- 1.3.1 N-Propyl Bromide Scope – Types & Subtypes Covered
- 1.3.2 Geographic Scope – Regions & Countries Covered
- 1.3.3 Historical Period, Base Year & Forecast Period (2024; forecast to 2032)
- 1.3.4 Inclusions & Exclusions
- 1.4 HS Code & Classification Framework
- 1.5 Currency, Units & Pricing Basis
- 1.6 Target Stakeholders
- 1.7 Limitations & Assumptions
Chapter 2. Executive Summary
- 2.1 Global N-Propyl Bromide Market Snapshot
- 2.1.1 Market Size – Historical (2024) & Forecast (2024-2032) (2024: USD 535.29 million → 2032: USD 642.09 million)
- 2.1.2 Volume & Revenue – Global Totals
- 2.1.3 Key Market Highlights – Top Five Facts
- 2.2 N-Propyl Bromide Market Segmentation Snapshot
- 2.2.1 Market Split by Region – 2024 vs. 2032
- 2.3 Competitive Snapshot
- 2.3.1 Top 10 Players by Revenue Share – 2024
- 2.3.2 Top 10 Players by Volume Share – 2024
- 2.3.3 Recent Strategic Developments (18-Month Summary)
- 2.4 Key Investment Highlights & Strategic Conclusions
Chapter 3. N-Propyl Bromide Market Dynamics & Industry Analysis
- 3.1 Market Overview & Context
- 3.1.1 N-Propyl Bromide Market Position in the Broader Automotive Value Chain
- 3.1.2 OEM vs. Replacement Market Dynamics
- 3.1.3 Market Maturity & Development Stage by Region
- 3.2 N-Propyl Bromide Market Drivers
- 3.3 N-Propyl Bromide Market Restraints & Challenges
- 3.4 N-Propyl Bromide Market Opportunities
- 3.5 Porter's Five Forces Analysis
- 3.5.1 Threat of New Entrants
- 3.5.2 Bargaining Power of Suppliers
- 3.5.3 Bargaining Power of Buyers
- 3.5.4 Threat of Substitutes
- 3.5.5 Competitive Rivalry – Intensity Assessment
- 3.6 N-Propyl Bromide Value Chain Analysis
- 3.6.1 Upstream – Raw Material/Input Suppliers
- 3.6.1.1 Raw Material/Input 1
- 3.6.1.2 Raw Material/Input 2
- 3.6.1.3 Raw Material/Input 3
- 3.6.2 Midstream – Production/Manufacturing/Service Delivery
- 3.6.2.1 Production/Process Overview
- 3.6.2.2 Key Facility Locations & Capacity by Manufacturer
- 3.6.3 Downstream – Distribution & End Consumer
- 3.6.3.1 Primary Channel – B2B/OEM
- 3.6.3.2 Secondary Channels – Dealer, Retail, Online, Direct
- 3.6.4 Value Chain Profitability Analysis
- 3.6.1 Upstream – Raw Material/Input Suppliers
- 3.7 PESTEL Analysis
- 3.7.1 Political Factors
- 3.7.2 Economic Factors
- 3.7.3 Social Factors
- 3.7.4 Technological Factors
- 3.7.5 Environmental Factors
- 3.7.6 Legal Factors
- 3.8 N-Propyl Bromide Supply Chain Analysis
- 3.8.1 Raw Material/Input Supply Risk Assessment
- 3.8.2 Manufacturing Concentration Risk (Geographic Exposure)
- 3.8.3 Trade Disruption Impact Analysis
- 3.9 Regulatory & Policy Landscape
Note: The regulatory and policy landscape section covers regulations based on their applicability to the market, N-Propyl Bromide category, geography, and scope of the study. Only regulatory frameworks with a material impact on operations, compliance, trade, sustainability, or market access are analyzed in detail.
Chapter 4. Key Investment Pockets & Opportunity Analysis
- 4.1 N-Propyl Bromide Market Attractiveness Analysis
- 4.1.1 By Region – Investment Attractiveness Matrix (Volume × CAGR)
- 4.2 Absolute Revenue Growth Opportunity
- 4.2.1 By Region – Absolute USD Growth Through 2032
- 4.3 Incremental Volume Opportunity
- 4.3.1 By Region – Incremental Volume Through 2032
- 4.3.2 Segment – Incremental Volume
- 4.4 Emerging Submarket Opportunity Deep Dive (Subject to Applicability)
- 4.5 Emerging Market Opportunity Scorecards
- 4.5.1 United States
- 4.5.2 Europe
- 4.5.3 Asia
- 4.5.4 Middle East & Africa
Note: Emerging Market Opportunity Scorecards will be included based on relevance and strategic importance. Regions listed are indicative and may vary depending on data availability and market dynamics.
Chapter 5. N-Propyl Bromide Import-Export Analysis & Trade Flows
- 5.1 Global Trade Overview
- 5.1.1 Global Export Value by Country (2024)
- 5.1.2 Global Export Volume by Country (2024)
- 5.1.3 Global Import Value by Country (2024)
- 5.1.4 Global Import Volume by Country (2024)
- 5.1.5 Net Trade Balance by Country (2024)
- 5.2 Export Analysis – Segment
- 5.2.1 Type 1 (HS Code)
- 5.2.2 Type 2 (HS Code)
- 5.2.3 Type 3 (HS Code)
- 5.2.4 Type 4 (HS Code)
- 5.2.5 Type 5 (HS Code)
- 5.3 Import Analysis – Segment
- 5.3.1 Type 1 (HS Code)
- 5.3.2 Type 2 (HS Code)
- 5.3.3 Type 3 (HS Code)
- 5.3.4 Type 4 (HS Code)
- 5.3.5 Type 5 (HS Code)
- 5.4 Average Unit Trade Prices
- 5.4.1 Average Export Price – Segment & Country
- 5.4.2 Average Import Price – Segment & Source Country
- 5.4.3 Price Trends (2024)
- 5.5 Key Trade Route Analysis
- 5.5.1 Trade Route 1
- 5.5.2 Trade Route 2
- 5.5.3 Trade Route 3
- 5.5.4 Trade Route 4
- 5.5.5 Trade Route 5
- 5.6 Trade Policy Impact Assessment
- 5.6.1 US Anti-Dumping & Section 301 Tariffs
- 5.6.2 EU Customs Union Impact
- 5.6.3 Major Free Trade Agreements
- 5.6.4 USMCA Rules of Origin
Note: Trade policy analysis will be included only where relevant to the N-Propyl Bromide market.
Chapter 6. Competitive Landscape & Company Benchmarking
- 6.1 N-Propyl Bromide Market Concentration & Structure
- 6.1.1 Herfindahl-Hirschman Index (HHI) – vs. 2024
- 6.1.2 Tier 1, Tier 2 & Tier 3 Market Structure
- 6.1.3 Global, Regional & Local Player Dynamics
- 6.2 N-Propyl Bromide Market Share Analysis – 2024
- 6.2.1 Global Revenue Share by Company
- 6.2.2 Global Volume Share by Company
- 6.2.3 Regional Revenue Share
- 6.2.4 Market Share Evolution ( vs. 2024)
- 6.2.5 OEM Segment Share by Company
- 6.2.6 Replacement Segment Share by Company
- 6.3 Production/Delivery Capacity & Facility Analysis
- 6.3.1 Global Installed Capacity
- 6.3.2 Capacity Utilization Rates
- 6.3.3 Production/Output Volume
- 6.3.4 Facility Locations & Capacity Map
- 6.3.5 Planned Capacity Additions
- 6.4 N-Propyl Bromide Competitive Benchmarking Matrix
- 6.4.1 Revenue, Volume, CAGR & Profitability Comparison
- 6.4.2 Channel Revenue Mix
- 6.4.3 Geographic Revenue Exposure
- 6.4.4 R&D Intensity
- 6.4.5 Sustainability Maturity
- 6.5 Strategic Developments in N-Propyl Bromide (Last 24 Months)
- 6.5.1 Mergers, Acquisitions & Divestments
- 6.5.2 New N-Propyl Bromide Launches
- 6.5.3 Facility Expansions
- 6.5.4 Strategic Alliances, Joint Ventures & Partnerships
- 6.5.5 Distribution Expansion & Market Entry
- 6.5.6 Sustainability & ESG Initiatives
- 6.6 Competitive Strategy Mapping
- 6.6.1 Leader, Challenger, Follower & Niche Classification
- 6.6.2 Pricing Strategy Comparison
- 6.6.3 Channel Strategy Matrix
Note: Strategic developments are included based on their materiality and the availability of reliable information.
Chapter 7. Global N-Propyl Bromide Market – By Distribution Channel
- 7.1 Segment Overview
- 7.1.1 Volume & Revenue Split by Channel (2024 & 2032)
- 7.1.2 Channel Mix Evolution (2024-2032)
Chapter 8. Regional Market Analysis – Global Overview
- 8.1 Global Regional Overview
- 8.1.1 Regional Volume Share
- 8.1.2 Regional Revenue Share
- 8.1.3 Regional Volume by Region
- 8.1.4 Regional Revenue by Region
- 8.1.5 Regional Forecast Through 2032
- 8.2 Cross-Regional Segment Analysis
- 8.2.1 By Distribution Channel
- 8.2.2 By Brand/Price Tier
Chapter 9. North America N-Propyl Bromide Market
- 9.1 United States
- 9.2 Canada
- 9.3 Mexico
Chapter 10. Europe N-Propyl Bromide Market
- 10.1 Germany
- 10.2 France
- 10.3 Italy
- 10.4 United Kingdom
- 10.5 Spain
- 10.6 Poland
- 10.7 Russia
- 10.8 Netherlands
- 10.9 Belgium
- 10.10 Sweden
- 10.11 Denmark
- 10.12 Norway
- 10.13 Rest of Europe
Chapter 11. Asia Pacific N-Propyl Bromide Market
- 11.1 China
- 11.2 India
- 11.3 Japan
- 11.4 South Korea
- 11.5 Thailand
- 11.6 Indonesia
- 11.7 Vietnam
- 11.8 Malaysia
- 11.9 Australia
- 11.10 Rest of Asia Pacific
Chapter 12. Latin America N-Propyl Bromide Market
- 12.1 Brazil
- 12.2 Argentina
- 12.3 Colombia
- 12.4 Chile
- 12.5 Rest of Latin America
Chapter 13. Middle East N-Propyl Bromide Market
- 13.1 Saudi Arabia
- 13.2 United Arab Emirates
- 13.3 Turkey
- 13.4 Israel
- 13.5 Iran
- 13.6 Rest of the Middle East
Chapter 14. Africa N-Propyl Bromide Market
- 14.1 South Africa
- 14.2 Egypt
- 14.3 Nigeria
- 14.4 Morocco
- 14.5 Rest of Africa
Chapter 15. N-Propyl Bromide Company Profiles
- 15.1 [Company 01]
- 15.1.1 Company Overview
- 15.1.2 Key Management Personnel
- 15.1.3 Products & Services Portfolio
- 15.1.4 Financial Performance
- 15.1.5 Key Market Focus & Geographic Presence
- 15.1.6 Recent Developments & Strategic Initiatives
Note: The company profile list is preliminary and may change based on research findings, market developments, data availability, and client requirements.
Chapter 16. Appendices
- Appendix A – List of Abbreviations & Acronyms
- Appendix B – Industry Classification Code Reference – Full Series
- Appendix C – Production & Capacity Data Tables
- Appendix D – End-Use & Demand Base Tables
- Appendix E – Consumption & Replacement Rate Assumptions
- Appendix F – ASP Reference Tables
- Appendix G – Manufacturing & Facility Database
- Appendix H – Import-Export Data Tables
- Appendix I – Regulatory Summary Tables
- Appendix J – Primary Research Participant List (Anonymized)
- Appendix K – Primary Research Questionnaire Framework
- Appendix L – Data Sources & Bibliography
- Appendix M – Market Size Divergence & Source Comparison
Chapter 17. Research Methodology
- 17.1 Research Framework & Philosophy
- 17.2 Secondary Research – Sources, Hierarchy & Data Extraction
- 17.3 Data Modeling – Bottom-Up & Top-Down Market Sizing
- 17.4 Primary Research – Stakeholder Framework, LOI & Sample Sizes
- 17.5 Forecast Methodology – Regression, Scenario & Sensitivity Analysis
- 17.6 Quality Control – Four-Layer Validation Framework
- 17.7 Limitations & Standard Assumptions
- 17.8 Disclaimer
