| REPORT ATTRIBUTE |
DETAILS |
| Historical Period |
2019-2022 |
| Base Year |
2023 |
| Forecast Period |
2024-2032 |
| Nanobots market Size 2024 |
USD 13,164.23 million |
| Nanobots market, CAGR |
15.68%. |
| Nanobots market Size 2032 |
USD 42,112.12 million |
Market Overview
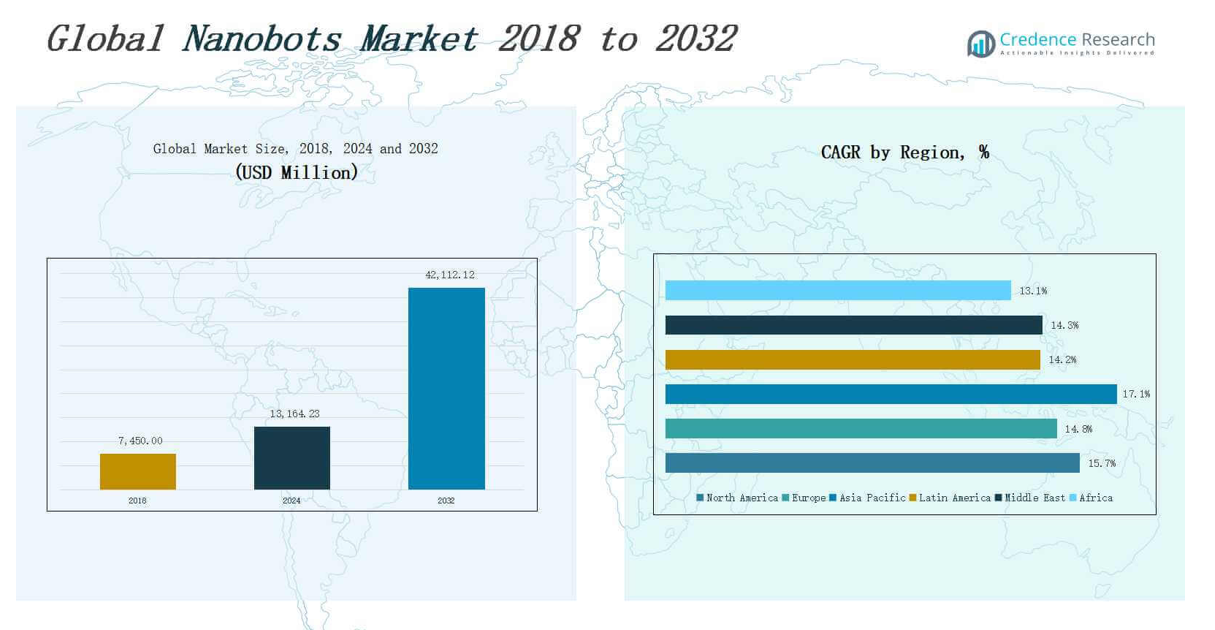
The Nanobots Market size was valued at USD 7,450.00 million in 2018 to USD 13,164.23 million in 2024 and is anticipated to reach USD 42,112.12 million by 2032, at a CAGR of 15.68 % during the forecast period.
The Nanobots Market is driven by advancements in nanotechnology, increasing demand for targeted drug delivery, and rising investments in precision medicine. Nanobots offer precise navigation at the cellular level, making them ideal for treating chronic diseases such as cancer, cardiovascular disorders, and neurological conditions. Their ability to perform minimally invasive procedures and reduce systemic side effects significantly enhances patient outcomes. Key trends include the integration of AI for real-time monitoring and control, and the development of biodegradable nanobots for safer in vivo applications. Research institutions and biotech firms are actively collaborating to accelerate clinical translation, supported by favorable regulatory frameworks and government funding. The growing use of nanobots in diagnostics, imaging, and gene therapy is expanding their role beyond therapeutics. Moreover, the miniaturization of components and ongoing innovations in materials science are enabling the production of more efficient, responsive, and biocompatible nanobots. Together, these factors are propelling the market’s rapid evolution and commercial adoption across healthcare and research domains.
The Nanobots Market exhibits strong geographical diversity, with North America leading due to advanced healthcare systems and high R&D spending, followed by Europe with its regulatory strength and innovation in medical robotics. Asia Pacific is the fastest-growing region, driven by rising investments in healthcare technology across China, Japan, India, and South Korea. Latin America shows steady growth led by Brazil and Mexico, while the Middle East gains momentum through strategic healthcare initiatives in the UAE and Saudi Arabia. Africa, though nascent, is expanding with support from international collaborations. Key players in the Nanobots Market include Oxford Instruments plc, Thermo Fisher Scientific, Bruker Corporation, Teledyne Technologies Incorporated, Agilent Technologies, Cavendish Capital Markets Limited, Nanonics Imaging Ltd., Angstrom Advanced Inc., and Kleindiek Nanotechnik GmbH, each focusing on innovation, miniaturization, and application expansion across diverse medical and non-medical domains.
Market Insights
- The Nanobots Market was valued at USD 13,164.23 million in 2024 and is projected to reach USD 42,112.12 million by 2032, growing at a CAGR of 15.68% due to rising demand for precision therapies and minimally invasive procedures.
- Rapid advancements in nanotechnology, materials science, and microelectronics are enabling the development of smaller, smarter, and more biocompatible nanobots with improved clinical performance.
- Integration of AI for real-time monitoring and smart navigation is enhancing the efficiency of nanobots in drug delivery, diagnostics, and gene therapy applications.
- Government and private sector investments are accelerating innovation, with startups and academic institutions forming strategic partnerships to drive commercialization and scalability.
- Regulatory complexities and high development costs remain key challenges, slowing product approvals and limiting market entry for small and mid-sized players.
- North America holds the largest market share, followed by Europe, while Asia Pacific emerges as the fastest-growing region due to rising healthcare investments in China, India, and Japan.
- Key players such as Oxford Instruments, Thermo Fisher Scientific, Bruker Corporation, and Agilent Technologies are focusing on innovation, miniaturization, and clinical integration across global markets.
Access crucial information at unmatched prices!
Request your sample report today & start making informed decisions powered by Credence Research Inc.!
Download Sample
Market Drivers
Rising Demand for Precision Medicine and Targeted Therapy
The Nanobots Market is gaining strong traction due to the growing demand for precision medicine, which requires highly accurate and site-specific treatment methods. Nanobots enable direct drug delivery to targeted cells, reducing side effects and improving treatment efficiency. This precision benefits patients with complex diseases like cancer and neurological disorders. The market benefits from an increasing preference for non-invasive procedures. Healthcare providers are adopting these technologies to improve patient outcomes. Precision therapy is redefining treatment standards globally.
- For instance, ARIZ Precision Medicine is developing PEGylated nanoparticles that deliver siRNA and chemotherapy agents directly to cancer cells, aiming to kill tumor-driving proteins without harming healthy tissue; their pipeline includes eight cancer indications currently in preclinical studies.
Rapid Advancements in Nanotechnology and Biomedical Engineering
Continuous innovation in nanotechnology and materials science is driving progress in the Nanobots Market. Researchers are developing smarter, smaller, and more biocompatible nanobots that can perform complex medical functions inside the human body. Integration with biosensors and real-time tracking systems boosts their efficiency. The convergence of disciplines such as robotics, biotechnology, and microelectronics enhances product capabilities. These improvements are encouraging new applications in diagnostics and therapeutic delivery. It is creating new growth avenues in clinical practice.
- For instance, Creative Biolabs is engineering biodegradable nanorobots for targeted drug delivery in cancer therapy, designed to minimize side effects by releasing medication only at tumor sites.
Increasing Investment from Public and Private Sectors
Strong financial backing from government agencies and private investors is fueling growth in the Nanobots Market. Public health initiatives are focusing on developing next-generation medical technologies that improve access and outcomes. Venture capital firms are actively funding biotech startups engaged in nanobot development. Collaborations between research institutions and commercial entities are accelerating product development cycles. These financial investments support innovation and scalability. It contributes significantly to the market’s commercialization potential and competitive landscape.
Growing Application in Chronic Disease Management and Diagnostics
The Nanobots Market is expanding due to rising incidences of chronic diseases such as cancer, diabetes, and cardiovascular disorders. Nanobots offer real-time monitoring, targeted drug release, and early disease detection. These capabilities make them highly valuable for long-term disease management. The shift toward proactive healthcare models further supports adoption. Medical professionals rely on nanobots for high-precision procedures and improved diagnostic accuracy. It is transforming chronic care strategies and supporting broader healthcare innovation.
Market Trends
Integration of Artificial Intelligence for Smart Navigation and Control
The Nanobots Market is witnessing a trend toward incorporating artificial intelligence (AI) to enhance autonomous navigation, real-time data interpretation, and precision targeting. AI algorithms help nanobots adapt to dynamic biological environments, improving responsiveness and operational efficiency. This integration supports real-time decision-making, enabling medical professionals to monitor therapeutic actions and outcomes more closely. The demand for intelligent nanobots is increasing across oncology, cardiology, and regenerative medicine. It helps reduce human intervention during procedures. AI-driven control systems are elevating nanobot performance standards.
- For instance, SenseTime in China is expanding its AI-vision algorithms into smart robotics, with research focused on embedding these systems in nanobot sensory payloads to enhance real-time navigation and object perception within biological tissues.
Miniaturization and Use of Biocompatible Materials
Researchers and developers in the Nanobots Market are focusing on miniaturization and the use of biocompatible materials to improve safety and effectiveness. Smaller, softer nanobots are capable of navigating intricate vascular systems and accessing hard-to-reach areas without damaging surrounding tissues. Advances in polymer science and molecular engineering are enabling highly flexible, biodegradable nanostructures. It helps minimize immune rejection and long-term side effects. This trend is critical for expanding clinical applications in sensitive environments like the brain and heart.
- For instance, nanoComposix provides customized PLGA nanoparticles for drug and gene delivery, with sizes typically between 100–300 nm; these particles are FDA- and EMA-approved for in vivo use and can be surface-modified for targeted delivery, minimizing immune response and side effects.
Expanding Applications Beyond Drug Delivery
The Nanobots Market is moving beyond drug delivery to include advanced applications such as in vivo diagnostics, gene therapy, and cellular imaging. Nanobots are now being designed to detect specific biomarkers, repair damaged cells, and assist in tissue regeneration. These capabilities are transforming their role into multifunctional medical tools. Research institutions are actively exploring these applications to address unmet clinical needs. It creates opportunities across multiple disciplines in healthcare. This diversification strengthens the market’s position in personalized medicine.
Growth in Collaborative Research and Strategic Partnerships
Collaborative efforts among academic institutions, biotech companies, and technology firms are shaping the development pipeline of the Nanobots Market. Strategic partnerships support the rapid prototyping, testing, and regulatory validation of new nanobot platforms. Companies are leveraging shared expertise and resources to overcome technological and manufacturing barriers. It allows faster entry into clinical trials and global markets. These alliances promote standardization and innovation simultaneously. The trend underscores the importance of interdisciplinary cooperation in driving market progress.
Market Challenges Analysis
Complex Regulatory Framework and Approval Delays
The Nanobots Market faces significant challenges related to regulatory approvals and compliance with international health standards. Regulatory agencies require extensive data on safety, efficacy, biocompatibility, and long-term impact, which prolongs the approval cycle. The lack of standardized protocols for testing nanobots further complicates product development. Developers must address multiple jurisdictional requirements, delaying commercialization and limiting early-stage adoption. It must navigate complex ethical and legal concerns tied to in vivo use. These hurdles slow innovation and market entry timelines.
High Development Costs and Technical Barriers
High research and development costs remain a major constraint for the Nanobots Market. Designing functional nanobots that can operate safely inside the human body requires advanced expertise in materials science, robotics, and biotechnology. Manufacturing these devices at scale with consistent quality adds further cost and complexity. Smaller companies face financial and technological limitations that restrict their ability to compete. It creates an environment where only a few players dominate. Limited access to skilled talent and infrastructure hampers widespread growth.
Market Opportunities
Rising Demand in Early Disease Detection and Personalized Medicine
The Nanobots Market presents strong opportunities in early disease detection and the expansion of personalized medicine. Nanobots can detect biomarkers at the molecular level, enabling diagnosis before symptoms appear. This capability supports preventive healthcare strategies and reduces treatment costs. Healthcare systems are increasingly investing in tools that improve diagnostic speed and accuracy. It aligns well with the shift toward individualized patient care. The market stands to benefit from this growing clinical focus on precision and early intervention.
Expansion into Non-Medical Applications and Emerging Markets
The Nanobots Market is poised to grow through its potential adoption in non-medical applications such as environmental monitoring, industrial process control, and military defense. These sectors are exploring nanobot technology for tasks like pollutant neutralization, structural inspections, and surveillance. Emerging economies in Asia-Pacific, Latin America, and the Middle East also offer untapped potential due to rising healthcare infrastructure and government initiatives in advanced technology. It can benefit from increased accessibility and localized manufacturing. These factors create long-term opportunities for global market expansion.
Market Segmentation Analysis:
By Type
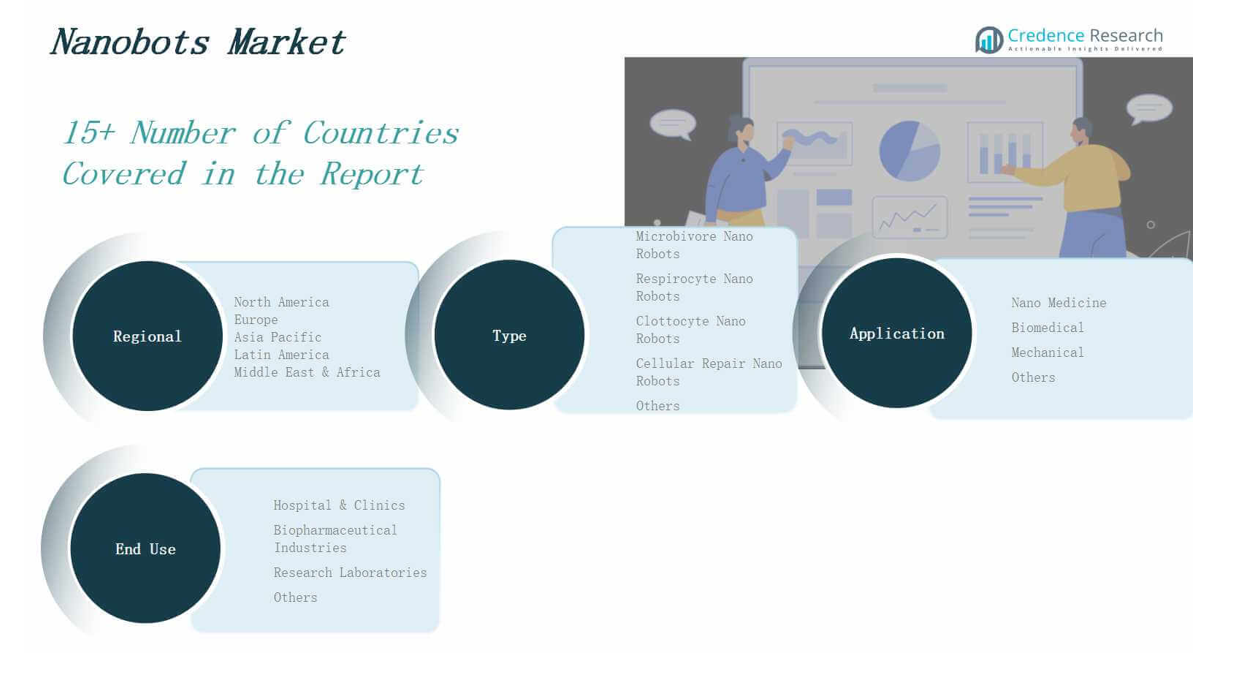
The Nanobots Market is segmented by type into Microbivore Nano Robots, Respirocyte Nano Robots, Clottocyte Nano Robots, Cellular Repair Nano Robots, and Others. Microbivore nano robots dominate due to their advanced pathogen elimination capabilities, particularly in infectious disease treatment. Respirocyte nano robots are gaining traction in oxygen delivery and cardiovascular applications. Clottocyte and cellular repair robots show potential in wound healing and regenerative medicine. It benefits from growing research into multifunctional nanodevices for complex biological functions.
By Application
Based on application, the Nanobots Market includes Nano Medicine, Biomedical, Mechanical, and Others. Nano medicine holds the largest share, driven by its use in drug delivery, diagnostics, and targeted therapy. Biomedical applications follow closely, with increasing deployment in gene editing, imaging, and tissue engineering. Mechanical applications are emerging in micro-manufacturing and precision systems. It is witnessing rapid adoption across healthcare and engineering due to its high efficiency and precision.
- For instance, Kleindiek Nanotechnik GmbH has introduced nanorobotic tools for manipulating and assembling microscale components in electronics manufacturing, enhancing precision and efficiency in production processes.
By End-use
The Nanobots Market by end-use covers Hospitals & Clinics, Biopharmaceutical Industries, Research Laboratories, and Others. Hospitals and clinics lead demand owing to the clinical integration of nanobots in surgical and diagnostic procedures. Biopharmaceutical industries use nanobots in drug testing, formulation, and targeted delivery trials. Research laboratories play a vital role in innovation and prototype development. It gains traction in diverse healthcare environments focused on advanced, minimally invasive technologies.
- For instance, AstraZeneca is developing lipid nanoparticles (LNPs) to deliver nucleotide-based therapeutics directly into cells, optimizing targeted drug release and improving patient outcomes in ongoing preclinical and clinical programs.
Segments:
Based on Type
- Microbivore Nano Robots
- Respirocyte Nano Robots
- Clottocyte Nano Robots
- Cellular Repair Nano Robots
- Others
Based on Application
- Nano Medicin
- Biomedica
- Mechanical
- Others
Based on End-use
- Hospitals & Clinics
- Biopharmaceutical Industries
- Research Laboratories
- Others
Based on Region
- North America
- Europe
- Germany
- France
- U.K.
- Italy
- Spain
- Rest of Europe
- Asia Pacific
- China
- Japan
- India
- South Korea
- South-east Asia
- Rest of Asia Pacific
- Latin America
- Brazil
- Argentina
- Rest of Latin America
- Middle East & Africa
- GCC Countries
- South Africa
- Rest of the Middle East and Africa
Regional Analysis
North America
The North America Nanobots Market size was valued at USD 2,999.37 million in 2018 to USD 5,241.92 million in 2024 and is anticipated to reach USD 16,748.07 million by 2032, at a CAGR of 15.7% during the forecast period. North America holds the largest market share, driven by strong healthcare infrastructure, early technology adoption, and substantial R&D investments. The United States dominates regional growth due to government funding, advanced academic institutions, and a robust startup ecosystem. It benefits from increasing demand for precision medicine and nanotechnology-supported therapies. Major players in the region are advancing clinical trials and commercializing nano-based tools. The market continues to expand with rising partnerships between biopharma companies and research labs.
Europe
The Europe Nanobots Market size was valued at USD 1,832.70 million in 2018 to USD 3,103.77 million in 2024 and is anticipated to reach USD 9,338.47 million by 2032, at a CAGR of 14.8% during the forecast period. Europe ranks second in market share due to strong regulatory frameworks, healthcare innovation, and a focus on medical robotics. Countries like Germany, France, and the UK lead in adopting nanobots for diagnostics and therapeutics. It benefits from government-backed research grants and a growing aging population that demands advanced treatments. The region also invests in collaborative projects under EU programs to promote nanotechnology. Market growth is supported by rising demand for minimally invasive procedures.
Asia Pacific
The Asia Pacific Nanobots Market size was valued at USD 1,825.25 million in 2018 to USD 3,368.01 million in 2024 and is anticipated to reach USD 11,888.29 million by 2032, at a CAGR of 17.1% during the forecast period. Asia Pacific is the fastest-growing region, supported by expanding healthcare infrastructure, rising government initiatives, and strong manufacturing capabilities. China, Japan, South Korea, and India are investing heavily in medical research and technological innovation. It benefits from a large patient pool and increasing demand for advanced diagnostic and therapeutic solutions. The region is emerging as a hub for cost-effective nanotechnology development. Startups and research institutions are forming strategic collaborations to accelerate commercialization.
Latin America
The Latin America Nanobots Market size was valued at USD 339.72 million in 2018 to USD 592.26 million in 2024 and is anticipated to reach USD 1,704.28 million by 2032, at a CAGR of 14.2% during the forecast period. Latin America holds a smaller market share but shows growing potential due to improved healthcare systems and increased public-private investments. Brazil and Mexico lead regional development with targeted research in cancer and chronic disease treatment. It is witnessing a gradual rise in nanotech-based diagnostic and treatment tools. Government efforts to modernize healthcare infrastructure are supporting market expansion. Educational institutions are building capabilities through international partnerships.
Middle East
The Middle East Nanobots Market size was valued at USD 292.04 million in 2018 to USD 484.36 million in 2024 and is anticipated to reach USD 1,402.57 million by 2032, at a CAGR of 14.3% during the forecast period. The Middle East market is expanding due to rising investments in futuristic healthcare technologies and national-level innovation programs. The UAE and Saudi Arabia are leading with strategic visions to integrate advanced medical solutions. It benefits from increasing awareness of early disease detection and high-end medical facilities. Governments are partnering with international biotech firms to bring cutting-edge research into the region. The growing focus on AI and robotics enhances regional market readiness.
Africa
The Africa Nanobots Market size was valued at USD 160.92 million in 2018 to USD 373.92 million in 2024 and is anticipated to reach USD 1,030.45 million by 2032, at a CAGR of 13.1% during the forecast period. Africa holds the smallest share of the Nanobots Market but demonstrates rising interest in healthcare innovation. South Africa and Egypt are key contributors, driven by academic research and international funding. It is gaining traction through non-profit partnerships and pilot programs focused on disease diagnostics. The region faces challenges in infrastructure but offers long-term growth potential. Expansion depends on improved access to medical technology and skilled workforce development.
Shape Your Report to Specific Countries or Regions & Enjoy 30% Off!
Key Player Analysis
- Oxford Instruments plc
- Thermo Fisher Scientific
- Bruker Corporation
- Teledyne Technologies Incorporated
- Agilent Technologies, Inc.
- Cavendish Capital Markets Limited
- Nanonics Imaging Ltd.
- Angstrom Advanced Inc.
- Kleindiek Nanotechnik GmbH
Competitive Analysis
The Nanobots Market features a competitive landscape driven by rapid technological advancements, strong R&D pipelines, and strategic collaborations. Leading players focus on developing multifunctional, biocompatible nanobots for targeted drug delivery, diagnostics, and surgical applications. Companies such as Oxford Instruments, Thermo Fisher Scientific, and Bruker Corporation dominate through robust portfolios and global reach. Emerging firms and academic spin-offs contribute innovation, particularly in specialized applications like cellular repair and micro-scale imaging. It sees active mergers, partnerships, and licensing agreements aimed at accelerating commercialization and expanding product pipelines. Competitive advantage stems from proprietary technologies, clinical validation, and regulatory approvals. Players compete on miniaturization precision, cost-effectiveness, and integration with AI and robotics. The market remains fragmented, with a mix of established firms and research-driven startups.
Recent Developments
- In June 2025, Oxford Instruments plc agreed to sell its NanoScience division to Quantum Design under a binding agreement, marking a strategic shift in its focus and reinforcing its capabilities in cryogenics and quantum technology.
- On May 20, 2025, Thermo Fisher Scientific partnered with Mirai Bio, securing a strategic collaboration that makes Thermo Fisher the preferred CDMO for Mirai’s genetic medicines platform, enhancing capabilities in targeted delivery and cGMP manufacturing.
- In March 2025, Bruker Corporation showcased its latest Hysitron TI Premier II nanomechanical testing system at the Nanobrücken 2025 conference in Halle, Germany, enhancing capabilities in nanoscale measurement and materials analysis.
- In 2025, DNA Nanobots, Inc. participated in BIO One-on-One Partnering™ at JPM Week, signaling active partnership and collaboration efforts in the biotech and pharma sector.
MarketConcentration & Characteristics
The Nanobots Market demonstrates a moderately concentrated structure, with a mix of established global players and emerging biotech firms driving innovation. Large companies like Thermo Fisher Scientific, Oxford Instruments, and Bruker Corporation hold significant market influence through robust R&D capabilities, strong distribution networks, and diversified portfolios. It maintains high entry barriers due to intensive capital requirements, complex regulatory pathways, and advanced technological expertise. Smaller players and research-driven startups contribute niche innovations, often operating through collaborations or licensing agreements. The market is characterized by rapid technological evolution, with a strong focus on miniaturization, biocompatibility, and smart functionalities such as AI integration and real-time control. Healthcare and diagnostics remain the dominant focus, although interest is growing in non-medical applications. Strategic alliances between academic institutions and private firms are accelerating product development and clinical validation. Intellectual property protection, regulatory compliance, and time-to-market are key factors shaping competition and sustainability in the Nanobots Market.
Report Coverage
The research report offers an in-depth analysis based on Type, Application, End-User and Region. It details leading market players, providing an overview of their business, product offerings, investments, revenue streams, and key applications. Additionally, the report includes insights into the competitive environment, SWOT analysis, current market trends, as well as the primary drivers and constraints. Furthermore, it discusses various factors that have driven market expansion in recent years. The report also explores market dynamics, regulatory scenarios, and technological advancements that are shaping the industry. It assesses the impact of external factors and global economic changes on market growth. Lastly, it provides strategic recommendations for new entrants and established companies to navigate the complexities of the market.
Future Outlook
- Demand for nanobots in targeted drug delivery will continue to rise with advancements in precision medicine.
- AI integration will enhance autonomous navigation and real-time decision-making in clinical applications.
- Biocompatible and biodegradable nanobots will gain preference in long-term therapeutic use.
- Research institutions and biotech firms will increase collaboration for faster clinical translation.
- Miniaturization and material innovation will improve nanobot efficiency and patient safety.
- Healthcare providers will adopt nanobots more widely for diagnostics and chronic disease management.
- Regulatory frameworks are expected to evolve to support commercialization of complex nanobot systems.
- Investment from both government and private sectors will drive large-scale production capabilities.
- Emerging economies will witness growing adoption driven by healthcare infrastructure development.
- Key players will expand their portfolios to include multifunctional nanobots for diverse applications.


