
Nanodiamonds Market Overview:
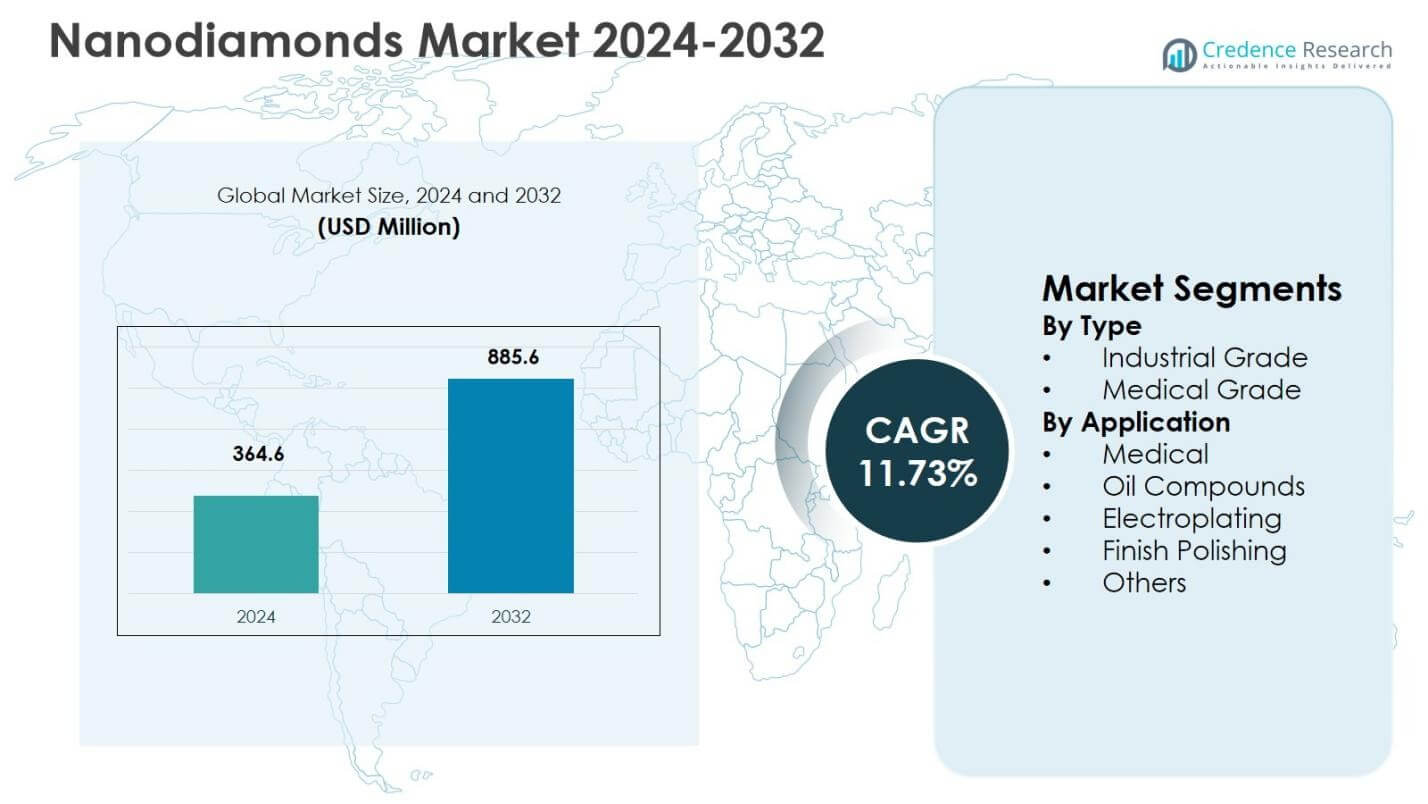
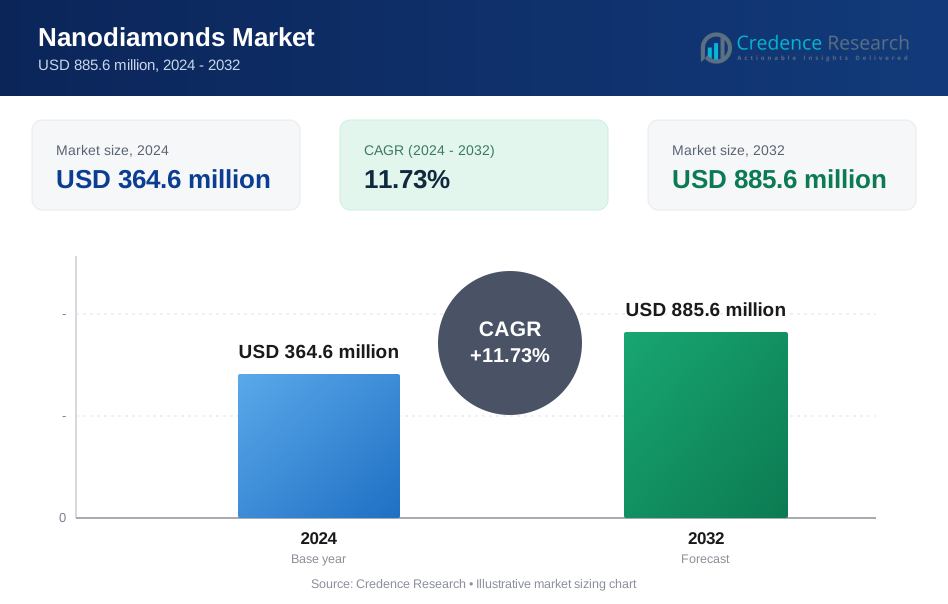
Nanodiamonds Market size was valued at USD 364.6 million in 2024 and is anticipated to reach USD 885.6 million by 2032, expanding at a CAGR of 11.73% during the forecast period.
| REPORT ATTRIBUTE | DETAILS |
|---|---|
| Historical Period | 2020-2023 |
| Base Year | 2024 |
| Forecast Period | 2025-2032 |
| Nanodiamonds Market Size 2024 | USD 364.6 million |
| Nanodiamonds Market, CAGR | 11.73% |
| Nanodiamonds Market Size 2032 | USD 885.6 million |
Nanodiamonds Market Insights
- Market growth is primarily driven by expanding biomedical usage, precision manufacturing demand, and increasing incorporation of nanodiamonds in lubricants, polishing, and electroplating, with industrial grade accounting for 68.4% segment share in 2024.
- Key market trends include advanced surface functionalization, rising use in electronics and semiconductors, and growing focus on medical-grade nanodiamonds, where the medical application segment held 34.7% share, followed by finish polishing with 9% share.
- Market restraints include high production and purification costs, complex detonation synthesis processes, and regulatory challenges in medical applications, which can limit scalability and slow commercialization.
- Regionally, Asia Pacific led with 34.7% market share in 2024, followed by North America at 31.8% and Europe at 26.4%, while Latin America and the Middle East & Africa jointly accounted for the remaining share due to emerging industrial adoption.
Nanodiamonds Market Segmentation Analysis:
By Type:
The Nanodiamonds Market by type is led by the industrial grade segment, which accounted for 68.4% market share in 2024, driven by its extensive use in precision polishing, lubricants, electroplating additives, and surface finishing applications. Industrial-grade nanodiamonds offer superior hardness, thermal stability, and cost efficiency, making them highly suitable for large-scale manufacturing and industrial processing. Meanwhile, the medical grade segment held 31.6% share, supported by rising adoption in drug delivery, bio-imaging, and tissue engineering, where high purity and biocompatibility are critical performance requirements.
- For instance, Ray Techniques Ltd. produces nanodiamonds averaging 4-5 nm in size for lubricants, where they act as nano-abrasives to reduce the coefficient of friction through uniform dispersion, enabling applications in lapping, running-in, and maintenance.
By Application:
By application, the medical segment dominated with a 34.7% market share in 2024, supported by growing use of nanodiamonds in targeted drug delivery, cancer therapeutics, and diagnostic imaging due to their non-toxicity and surface functionalization capabilities. Finish polishing followed with 27.9% share, driven by demand from electronics, optics, and semiconductor manufacturing. Electroplating accounted for 18.6%, benefiting from enhanced coating hardness and wear resistance, while oil compounds held 11.2% due to improved lubrication efficiency, and others contributed 7.6% through niche industrial uses.
- For instance, Advanced Abrasives' uDiamond Vivace additives for hard chrome plating embed 4-6 nm nanodiamonds, yielding coatings with superior hardness, wear resistance, and reduced friction.
Key Growth Drivers
Expanding Adoption in Biomedical and Healthcare Applications
The Nanodiamonds Market is witnessing strong growth due to increasing adoption in biomedical and healthcare applications, particularly in drug delivery, diagnostics, and tissue engineering. Nanodiamonds offer high biocompatibility, low cytotoxicity, and excellent surface functionalization, enabling efficient binding of therapeutic molecules and imaging agents. Their ability to enhance drug stability and targeted delivery is accelerating uptake in oncology and chronic disease treatment research. Rising investments in nanomedicine, growing clinical research activities, and expanding pharmaceutical R&D pipelines are further strengthening demand for medical-grade nanodiamonds across developed and emerging healthcare markets.
- For instance, researchers covalently linked 3-5 nm nanodiamonds with paclitaxel, reducing cell viability in A549 human lung carcinoma cells through mitotic arrest, apoptosis, and anti-tumorigenesis, while blocking tumor growth in xenograft SCID mice models.
Rising Demand from Precision Manufacturing and Surface Finishing
Growing demand from precision manufacturing industries is a key driver for the nanodiamonds market, especially in polishing, electroplating, and surface treatment applications. Nanodiamonds deliver superior hardness, abrasion resistance, and uniform particle size distribution, making them ideal for semiconductor wafers, optical components, and advanced electronics. The expansion of electronics manufacturing, increasing adoption of miniaturized components, and rising quality standards in industrial finishing processes are driving consistent demand for industrial-grade nanodiamonds. Their ability to improve surface smoothness while reducing processing time further enhances their value proposition.
- For instance, Hyperion Materials & Technologies offers Hyperion™ Diamond Powder, a patented synthetic diamond abrasive with etched surfaces for more cutting points, used in precision polishing of silicon carbide wafers and semiconductors to achieve finer surface finishes and efficient material removal.
Increasing Use in Advanced Lubricants and Oil Compounds
Nanodiamonds are gaining traction in lubricants and oil compounds due to their ability to reduce friction, enhance thermal conductivity, and improve wear resistance. The automotive, aerospace, and heavy machinery sectors are increasingly incorporating nanodiamond-based additives to improve equipment efficiency and extend component lifespan. Growing emphasis on energy efficiency, reduced maintenance costs, and improved operational performance is accelerating adoption. Additionally, rising industrial automation and expanding manufacturing activities globally are supporting sustained demand for nanodiamond-enhanced lubrication solutions across multiple end-use industries.
Key Trends & Opportunities
Advancements in Surface Functionalization and Customization
Continuous advancements in surface functionalization technologies are creating new growth opportunities in the nanodiamonds market. Improved chemical modification techniques allow nanodiamonds to be tailored for specific applications, including targeted drug delivery, biosensing, and catalytic systems. This customization enhances compatibility with biological systems and industrial matrices, expanding their application scope. Increasing collaboration between material science companies, research institutions, and healthcare organizations is accelerating innovation. These developments are opening opportunities for high-value applications and premium-grade nanodiamond products with differentiated performance characteristics.
- For instance, Carbodeon’s uDiamond nanodiamonds feature specific surface functionalization to enhance dispersibility and interaction in biosensors.
Expanding Role in Electronics and Energy Storage Technologies
Nanodiamonds are increasingly being explored for use in advanced electronics and energy storage systems, including supercapacitors, batteries, and thermal management solutions. Their exceptional thermal conductivity, electrical insulation properties, and nanoscale stability make them attractive for next-generation electronic components. Growing investments in electric vehicles, renewable energy systems, and high-performance computing are creating long-term opportunities. As manufacturers seek materials that enhance efficiency and durability, nanodiamonds are expected to gain wider acceptance in emerging energy and electronics applications.
- For instance, Carbodeon developed functionalized nanodiamonds that boost thermal conductivity in polyamide 66 compounds by 25% when replacing 0.1 wt.% of boron nitride filler, without impacting electrical insulation.
Key Challenges
High Production Costs and Complex Manufacturing Processes
One of the major challenges in the nanodiamonds market is the high cost associated with production and purification processes. Techniques such as detonation synthesis require advanced infrastructure, stringent safety measures, and complex post-processing to achieve consistent quality. These factors increase production costs and limit price competitiveness, particularly for medical-grade nanodiamonds. Smaller manufacturers face challenges in scaling operations, while end users may hesitate due to higher material costs compared to conventional alternatives, restraining broader market penetration.
Regulatory and Standardization Constraints
The lack of uniform regulatory frameworks and standardized quality benchmarks poses a significant challenge for the nanodiamonds market, especially in medical and pharmaceutical applications. Regulatory approvals for nanomaterials are often time-consuming and vary across regions, creating uncertainty for manufacturers and end users. Inconsistent standards for particle size, purity, and surface chemistry can impact product acceptance and commercialization timelines. Addressing these regulatory complexities requires extensive testing, documentation, and compliance efforts, which may slow innovation and delay market expansion.
Regional Analysis
North America
North America accounted for 31.8% market share in 2024, supported by strong demand from biomedical research, advanced manufacturing, and high-performance electronics. The region benefits from robust R&D infrastructure, early adoption of nanomaterials, and strong presence of pharmaceutical and medical device companies utilizing nanodiamonds for drug delivery and diagnostics. The United States leads regional demand due to high healthcare spending, expanding nanomedicine research, and growing use of nanodiamonds in precision polishing and electroplating. Continuous investments in material science innovation and favorable research funding further strengthen regional market growth.
Europe
Europe held 26.4% market share in 2024, driven by rising adoption of nanodiamonds across healthcare, industrial manufacturing, and automotive applications. Countries such as Germany, France, and the United Kingdom are leading contributors due to strong industrial bases and increasing focus on advanced materials for surface finishing and lubrication. Growth is further supported by collaborative research initiatives between universities and industry players, along with expanding use of nanodiamonds in medical imaging and drug delivery. Strict quality standards and emphasis on high-performance materials continue to promote demand across diverse end-use sectors.
Asia Pacific
Asia Pacific dominated the Nanodiamonds Market with a 34.7% market share in 2024, supported by rapid industrialization, expanding electronics manufacturing, and growing healthcare investments. China, Japan, and South Korea are key contributors, driven by large-scale production capacities, cost-efficient manufacturing, and strong demand for industrial-grade nanodiamonds. The region also benefits from rising pharmaceutical research activities and increasing use of nanodiamonds in precision polishing, electroplating, and lubricants. Government support for advanced materials and expanding semiconductor manufacturing further reinforce Asia Pacific’s leadership position.
Latin America
Latin America accounted for 4.2% market share in 2024, driven by gradual growth in industrial manufacturing and automotive applications. Countries such as Brazil and Mexico are witnessing increased adoption of nanodiamonds in surface finishing, lubricants, and electroplating, supported by expanding industrial output. The region’s healthcare sector is also showing emerging interest in nanodiamond-based biomedical research. While market penetration remains limited compared to developed regions, improving industrial capabilities, foreign investments, and growing awareness of advanced nanomaterials are expected to support steady regional demand.
Middle East & Africa
The Middle East & Africa region captured 2.9% market share in 2024, supported by growing industrial diversification and infrastructure development. Demand is primarily driven by applications in oil compounds, advanced lubricants, and surface treatment, particularly in Gulf countries. Increasing investments in healthcare infrastructure and research capabilities are gradually opening opportunities for medical-grade nanodiamonds. Although adoption remains at an early stage, rising focus on high-performance materials, industrial modernization, and partnerships with global nanomaterial suppliers are expected to enhance regional market presence over the forecast period.
Nanodiamonds Market Segmentations:
By Type
- Industrial Grade
- Medical Grade
By Application
- Medical
- Oil Compounds
- Electroplating
- Finish Polishing
- Others
By Geography
- North America
- U.S.
- Canada
- Mexico
- Europe
- Germany
- France
- U.K.
- Italy
- Spain
- Rest of Europe
- Asia Pacific
- China
- Japan
- India
- South Korea
- South-east Asia
- Rest of Asia Pacific
- Latin America
- Brazil
- Argentina
- Rest of Latin America
- Middle East & Africa
- GCC Countries
- South Africa
- Rest of the Middle East and Africa
Competitive Landscape
Competitive landscape in the Nanodiamonds Market is characterized by the presence of key players such as Ray Techniques Ltd, Element Six, Carbodeon, Adámas Nanotechnologies, Microdiamant, SINTEF, Henan Yuxing Sino-crystal Micron Diamond, DA NanoMaterials, XFNANO Materials, and Nanograde. The market remains moderately consolidated, with leading companies focusing on capacity expansion, product purity enhancement, and application-specific customization to strengthen their positions. Players with strong detonation synthesis and surface functionalization capabilities maintain a competitive edge, particularly in medical-grade and high-performance industrial applications. Strategic collaborations with research institutes, pharmaceutical companies, and electronics manufacturers are widely adopted to accelerate innovation and commercialization. Asian manufacturers leverage cost-efficient production and scale advantages, while European and North American players emphasize high-purity, value-added solutions. Continuous investment in R&D, quality certifications, and downstream application development remains central to sustaining competitiveness and long-term market growth.
Key Player Analysis
- XFNANO Materials
- Element Six
- Nanograde
- Ray Techniques Ltd
- DA NanoMaterials
- Carbodeon
- Microdiamant
- SINTEF
- Adámas Nanotechnologies
- Henan Yuxing Sino-crystal Micron Diamond
Recent Developments
- In March 2025, Adámas Nanotechnologies released a new one-of-a-kind product: micron-sized diamond particles with blue fluorescence, extending the fluorescence palette for nanodiamond materials.
- In October 2025, IOCB Prague, in collaboration with MegaDiamond, unveiled a breakthrough PTQ method for producing quantum-grade nanodiamonds with NV centers, enabling industrial-scale output in minutes rather than weeks.
Report Coverage
The research report offers an in-depth analysis based on Type, Application and Geography. It details leading market players, providing an overview of their business, product offerings, investments, revenue streams, and key applications. Additionally, the report includes insights into the competitive environment, SWOT analysis, current market trends, as well as the primary drivers and constraints. Furthermore, it discusses various factors that have driven market expansion in recent years. The report also explores market dynamics, regulatory scenarios, and technological advancements that are shaping the industry. It assesses the impact of external factors and global economic changes on market growth. Lastly, it provides strategic recommendations for new entrants and established companies to navigate the complexities of the market.
Future Outlook
- Demand for nanodiamonds will increase steadily due to expanding use in biomedical and drug delivery applications.
- Industrial-grade nanodiamonds will continue to dominate consumption, supported by growth in precision polishing and surface finishing.
- Medical-grade nanodiamonds will witness faster adoption as clinical research and nanomedicine development expand globally.
- Advancements in surface functionalization will enable broader application-specific customization across industries.
- Electronics and semiconductor manufacturing will drive higher demand for ultra-fine polishing and thermal management solutions.
- Adoption of nanodiamonds in advanced lubricants will rise with growing focus on equipment efficiency and durability.
- Asia Pacific will strengthen its leadership through large-scale production and expanding end-use industries.
- Strategic partnerships between material suppliers and research institutions will accelerate innovation cycles.
- Quality standardization and regulatory clarity will improve commercialization in healthcare-related applications.
- Technological advancements in synthesis and purification will enhance scalability and cost efficiency over time.
Request a Free Sample
Fill in your details and we'll send you a free sample report.
- Sample data tables & charts
- Research methodology
Need a Custom Version of This Report?
Tailor the scope, geography, or segments to your exact requirements.
- Custom geography or segment scope
- Direct access to our analyst team
Frequently Asked Questions
What is the current market size for the Nanodiamonds Market, and what is its projected size in 2032?
At what Compound Annual Growth Rate is the Nanodiamonds Market projected to grow between 2024 and 2032?
Which Nanodiamonds Market segment held the largest share in 2024?
What are the primary factors fueling the growth of the Nanodiamonds Market?
Who are the leading companies in the Nanodiamonds Market?
Which region commanded the largest share of the Nanodiamonds Market in 2024?
Table of Content
Chapter 1. Report Introduction
- 1.1 Report Description & Purpose
- 1.1.1 Report Title & Market Definition
- 1.1.2 Unique Selling Propositions (USP) & Key Differentiators
- 1.1.3 Value Proposition for Stakeholders
- 1.2 Research Objectives
- 1.2.1 Market Sizing Objectives (Volume & Revenue)
- 1.2.2 Segmentation Objectives
- 1.2.3 Competitive Intelligence Objectives
- 1.2.4 Forecast & Scenario Objectives
- 1.3 Report Scope
- 1.3.1 Nanodiamonds Scope – Types & Subtypes Covered
- 1.3.2 Geographic Scope – Regions & Countries Covered
- 1.3.3 Historical Period, Base Year & Forecast Period (2024; forecast to 2032)
- 1.3.4 Inclusions & Exclusions
- 1.4 HS Code & Classification Framework
- 1.5 Currency, Units & Pricing Basis
- 1.6 Target Stakeholders
- 1.7 Limitations & Assumptions
Chapter 2. Executive Summary
- 2.1 Global Nanodiamonds Market Snapshot
- 2.1.1 Market Size – Historical (2024) & Forecast (2024-2032) (2024: USD 364.6 million → 2032: USD 885.6 million)
- 2.1.2 Volume & Revenue – Global Totals
- 2.1.3 Key Market Highlights – Top Five Facts
- 2.2 Nanodiamonds Market Segmentation Snapshot
- 2.2.1 Market Split by Region – 2024 vs. 2032
- 2.3 Competitive Snapshot
- 2.3.1 Top 10 Players by Revenue Share – 2024
- 2.3.2 Top 10 Players by Volume Share – 2024
- 2.3.3 Recent Strategic Developments (18-Month Summary)
- 2.4 Key Investment Highlights & Strategic Conclusions
Chapter 3. Nanodiamonds Market Dynamics & Industry Analysis
- 3.1 Market Overview & Context
- 3.1.1 Nanodiamonds Market Position in the Broader Automotive Value Chain
- 3.1.2 OEM vs. Replacement Market Dynamics
- 3.1.3 Market Maturity & Development Stage by Region
- 3.2 Nanodiamonds Market Drivers
- 3.3 Nanodiamonds Market Restraints & Challenges
- 3.4 Nanodiamonds Market Opportunities
- 3.5 Porter's Five Forces Analysis
- 3.5.1 Threat of New Entrants
- 3.5.2 Bargaining Power of Suppliers
- 3.5.3 Bargaining Power of Buyers
- 3.5.4 Threat of Substitutes
- 3.5.5 Competitive Rivalry – Intensity Assessment
- 3.6 Nanodiamonds Value Chain Analysis
- 3.6.1 Upstream – Raw Material/Input Suppliers
- 3.6.1.1 Raw Material/Input 1
- 3.6.1.2 Raw Material/Input 2
- 3.6.1.3 Raw Material/Input 3
- 3.6.2 Midstream – Production/Manufacturing/Service Delivery
- 3.6.2.1 Production/Process Overview
- 3.6.2.2 Key Facility Locations & Capacity by Manufacturer
- 3.6.3 Downstream – Distribution & End Consumer
- 3.6.3.1 Primary Channel – B2B/OEM
- 3.6.3.2 Secondary Channels – Dealer, Retail, Online, Direct
- 3.6.4 Value Chain Profitability Analysis
- 3.6.1 Upstream – Raw Material/Input Suppliers
- 3.7 PESTEL Analysis
- 3.7.1 Political Factors
- 3.7.2 Economic Factors
- 3.7.3 Social Factors
- 3.7.4 Technological Factors
- 3.7.5 Environmental Factors
- 3.7.6 Legal Factors
- 3.8 Nanodiamonds Supply Chain Analysis
- 3.8.1 Raw Material/Input Supply Risk Assessment
- 3.8.2 Manufacturing Concentration Risk (Geographic Exposure)
- 3.8.3 Trade Disruption Impact Analysis
- 3.9 Regulatory & Policy Landscape
Note: The regulatory and policy landscape section covers regulations based on their applicability to the market, Nanodiamonds category, geography, and scope of the study. Only regulatory frameworks with a material impact on operations, compliance, trade, sustainability, or market access are analyzed in detail.
Chapter 4. Key Investment Pockets & Opportunity Analysis
- 4.1 Nanodiamonds Market Attractiveness Analysis
- 4.1.1 By Region – Investment Attractiveness Matrix (Volume × CAGR)
- 4.2 Absolute Revenue Growth Opportunity
- 4.2.1 By Region – Absolute USD Growth Through 2032
- 4.3 Incremental Volume Opportunity
- 4.3.1 By Region – Incremental Volume Through 2032
- 4.3.2 Segment – Incremental Volume
- 4.4 Emerging Submarket Opportunity Deep Dive (Subject to Applicability)
- 4.5 Emerging Market Opportunity Scorecards
- 4.5.1 United States
- 4.5.2 Europe
- 4.5.3 Asia
- 4.5.4 Middle East & Africa
Note: Emerging Market Opportunity Scorecards will be included based on relevance and strategic importance. Regions listed are indicative and may vary depending on data availability and market dynamics.
Chapter 5. Nanodiamonds Import-Export Analysis & Trade Flows
- 5.1 Global Trade Overview
- 5.1.1 Global Export Value by Country (2024)
- 5.1.2 Global Export Volume by Country (2024)
- 5.1.3 Global Import Value by Country (2024)
- 5.1.4 Global Import Volume by Country (2024)
- 5.1.5 Net Trade Balance by Country (2024)
- 5.2 Export Analysis – Segment
- 5.2.1 Type 1 (HS Code)
- 5.2.2 Type 2 (HS Code)
- 5.2.3 Type 3 (HS Code)
- 5.2.4 Type 4 (HS Code)
- 5.2.5 Type 5 (HS Code)
- 5.3 Import Analysis – Segment
- 5.3.1 Type 1 (HS Code)
- 5.3.2 Type 2 (HS Code)
- 5.3.3 Type 3 (HS Code)
- 5.3.4 Type 4 (HS Code)
- 5.3.5 Type 5 (HS Code)
- 5.4 Average Unit Trade Prices
- 5.4.1 Average Export Price – Segment & Country
- 5.4.2 Average Import Price – Segment & Source Country
- 5.4.3 Price Trends (2024)
- 5.5 Key Trade Route Analysis
- 5.5.1 Trade Route 1
- 5.5.2 Trade Route 2
- 5.5.3 Trade Route 3
- 5.5.4 Trade Route 4
- 5.5.5 Trade Route 5
- 5.6 Trade Policy Impact Assessment
- 5.6.1 US Anti-Dumping & Section 301 Tariffs
- 5.6.2 EU Customs Union Impact
- 5.6.3 Major Free Trade Agreements
- 5.6.4 USMCA Rules of Origin
Note: Trade policy analysis will be included only where relevant to the Nanodiamonds market.
Chapter 6. Competitive Landscape & Company Benchmarking
- 6.1 Nanodiamonds Market Concentration & Structure
- 6.1.1 Herfindahl-Hirschman Index (HHI) – vs. 2024
- 6.1.2 Tier 1, Tier 2 & Tier 3 Market Structure
- 6.1.3 Global, Regional & Local Player Dynamics
- 6.2 Nanodiamonds Market Share Analysis – 2024
- 6.2.1 Global Revenue Share by Company
- 6.2.2 Global Volume Share by Company
- 6.2.3 Regional Revenue Share
- 6.2.4 Market Share Evolution ( vs. 2024)
- 6.2.5 OEM Segment Share by Company
- 6.2.6 Replacement Segment Share by Company
- 6.3 Production/Delivery Capacity & Facility Analysis
- 6.3.1 Global Installed Capacity
- 6.3.2 Capacity Utilization Rates
- 6.3.3 Production/Output Volume
- 6.3.4 Facility Locations & Capacity Map
- 6.3.5 Planned Capacity Additions
- 6.4 Nanodiamonds Competitive Benchmarking Matrix
- 6.4.1 Revenue, Volume, CAGR & Profitability Comparison
- 6.4.2 Channel Revenue Mix
- 6.4.3 Geographic Revenue Exposure
- 6.4.4 R&D Intensity
- 6.4.5 Sustainability Maturity
- 6.5 Strategic Developments in Nanodiamonds (Last 24 Months)
- 6.5.1 Mergers, Acquisitions & Divestments
- 6.5.2 New Nanodiamonds Launches
- 6.5.3 Facility Expansions
- 6.5.4 Strategic Alliances, Joint Ventures & Partnerships
- 6.5.5 Distribution Expansion & Market Entry
- 6.5.6 Sustainability & ESG Initiatives
- 6.6 Competitive Strategy Mapping
- 6.6.1 Leader, Challenger, Follower & Niche Classification
- 6.6.2 Pricing Strategy Comparison
- 6.6.3 Channel Strategy Matrix
Note: Strategic developments are included based on their materiality and the availability of reliable information.
Chapter 7. Global Nanodiamonds Market – By Distribution Channel
- 7.1 Segment Overview
- 7.1.1 Volume & Revenue Split by Channel (2024 & 2032)
- 7.1.2 Channel Mix Evolution (2024-2032)
Chapter 8. Regional Market Analysis – Global Overview
- 8.1 Global Regional Overview
- 8.1.1 Regional Volume Share
- 8.1.2 Regional Revenue Share
- 8.1.3 Regional Volume by Region
- 8.1.4 Regional Revenue by Region
- 8.1.5 Regional Forecast Through 2032
- 8.2 Cross-Regional Segment Analysis
- 8.2.1 By Distribution Channel
- 8.2.2 By Brand/Price Tier
Chapter 9. North America Nanodiamonds Market
- 9.1 United States
- 9.2 Canada
- 9.3 Mexico
Chapter 10. Europe Nanodiamonds Market
- 10.1 Germany
- 10.2 France
- 10.3 Italy
- 10.4 United Kingdom
- 10.5 Spain
- 10.6 Poland
- 10.7 Russia
- 10.8 Netherlands
- 10.9 Belgium
- 10.10 Sweden
- 10.11 Denmark
- 10.12 Norway
- 10.13 Rest of Europe
Chapter 11. Asia Pacific Nanodiamonds Market
- 11.1 China
- 11.2 India
- 11.3 Japan
- 11.4 South Korea
- 11.5 Thailand
- 11.6 Indonesia
- 11.7 Vietnam
- 11.8 Malaysia
- 11.9 Australia
- 11.10 Rest of Asia Pacific
Chapter 12. Latin America Nanodiamonds Market
- 12.1 Brazil
- 12.2 Argentina
- 12.3 Colombia
- 12.4 Chile
- 12.5 Rest of Latin America
Chapter 13. Middle East Nanodiamonds Market
- 13.1 Saudi Arabia
- 13.2 United Arab Emirates
- 13.3 Turkey
- 13.4 Israel
- 13.5 Iran
- 13.6 Rest of the Middle East
Chapter 14. Africa Nanodiamonds Market
- 14.1 South Africa
- 14.2 Egypt
- 14.3 Nigeria
- 14.4 Morocco
- 14.5 Rest of Africa
Chapter 15. Nanodiamonds Company Profiles
- 15.1 [Company 01]
- 15.1.1 Company Overview
- 15.1.2 Key Management Personnel
- 15.1.3 Products & Services Portfolio
- 15.1.4 Financial Performance
- 15.1.5 Key Market Focus & Geographic Presence
- 15.1.6 Recent Developments & Strategic Initiatives
Note: The company profile list is preliminary and may change based on research findings, market developments, data availability, and client requirements.
Chapter 16. Appendices
- Appendix A – List of Abbreviations & Acronyms
- Appendix B – Industry Classification Code Reference – Full Series
- Appendix C – Production & Capacity Data Tables
- Appendix D – End-Use & Demand Base Tables
- Appendix E – Consumption & Replacement Rate Assumptions
- Appendix F – ASP Reference Tables
- Appendix G – Manufacturing & Facility Database
- Appendix H – Import-Export Data Tables
- Appendix I – Regulatory Summary Tables
- Appendix J – Primary Research Participant List (Anonymized)
- Appendix K – Primary Research Questionnaire Framework
- Appendix L – Data Sources & Bibliography
- Appendix M – Market Size Divergence & Source Comparison
Chapter 17. Research Methodology
- 17.1 Research Framework & Philosophy
- 17.2 Secondary Research – Sources, Hierarchy & Data Extraction
- 17.3 Data Modeling – Bottom-Up & Top-Down Market Sizing
- 17.4 Primary Research – Stakeholder Framework, LOI & Sample Sizes
- 17.5 Forecast Methodology – Regression, Scenario & Sensitivity Analysis
- 17.6 Quality Control – Four-Layer Validation Framework
- 17.7 Limitations & Standard Assumptions
- 17.8 Disclaimer
