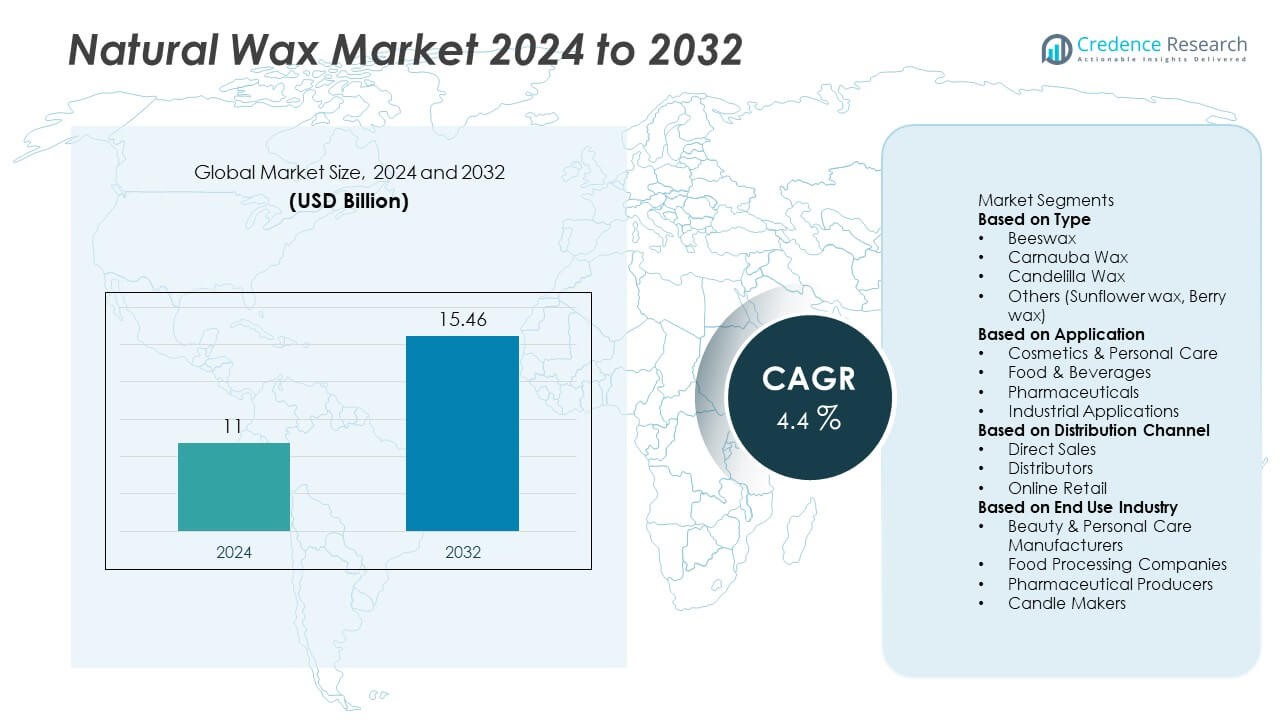
Home » Chemicals » Natural Wax Market

Natural Wax Market By Type of Natural Wax (Beeswax, Carnauba Wax, Soy Wax, Candelilla Wax, Jojoba Wax, Palm Wax, Bayberry Wax) By Application (Cosmetics and Personal Care, Pharmaceuticals, Food and Beverage, Candles, Polishes and Coatings, Adhesives and Sealants, Textiles and Paper, Traditional and Cultural Uses) -Growth, Future Prospects & Competitive Analysis, 2022 – 2030

Price: $4999

Published: | Report ID: 22973 | Report Format : PDF

Market Insights

  • The global demand for natural wax was valued at USD 1125.5 million in 2022 and is expected to reach USD 1793.87 million in 2030, growing at a CAGR of 6.00% between 2023 and 2030.
  • Beeswax is the leading segment of the natural wax type. Carnauba wax, on the other hand, is expected to grow at a strong CAGR.
  • The leading application segments are cosmetics and personal care.
  • The CAGR for consumer goods is expected to be the highest during the projection period.
  • North America dominated the natural wax market.
  • Europe is predicted to be the second-largest region in the natural wax market.
  • In the market for natural wax, Asia Pacific is anticipated to grow at the fastest rate.
  • Natural waxes support the circular economy, and there is a market for artisanal goods made with them. The market is growing because of these causes.
  • Natural waxes are utilized in wellness applications, customized product formulations are made possible, and non-GMO product formulations use them. These are the main opportunities presented by the global market.

Executive Summary

Market Definition

The natural wax market describes the global market for waxes sourced naturally, most commonly from plants, animals, or minerals. Because these waxes are sustainable and environmentally benign, they find a position in a wide range of commercial, industrial, and consumer applications. Natural waxes are renewable and biodegradable and are frequently seen as more environmentally benign than synthetic or petroleum-based waxes.

Market Overview

The market for natural wax has been expanding steadily in recent years, and between 2023 and 2030, it is anticipated to rise at a CAGR of 6.00%. The market was estimated to be worth USD 1125.5 million in 2022, and it is anticipated to be worth USD 1793.87 million in 2030.

The demand for carnauba wax (a type of natural wax) is mostly driven by the growing appeal of natural products. Carnauba wax has excellent emulsification and oil-binding properties, which are why the pharmaceutical industry uses it extensively for pill coating. As the food and beverage industry grows, carnauba wax, which has outstanding emulsifying properties and a binding capacity for oils, becomes increasingly popular. Because of its higher melting point and glossy properties, producers of cosmetics like lip balms, lipsticks, and mascara are growing more and fonder of it.

Thus, many uses are propelling the need for carnauba wax to grow. It is also frequently used as polish wax in the automotive industry because of its hardness and ability to change viscosity. Carnauba wax is seeing increased sales due to its many uses, surpassing beeswax. Everything that lies ahead for the carnauba wax industry will depend on the demand for natural cosmetics.

Globally, turnover in the cosmetics sector rises by about 9% annually. Natural plant extracts have become increasingly popular as cosmetic ingredients, introducing a new class of products that include biologically active ingredients with therapeutic qualities that meet aesthetic and health needs. These are the factors that support the growth of the natural wax industry.

Design Element 2

Access crucial information at unmatched prices!

Request your free sample report today & start making informed decisions powered by Credence Research!

Download Free Sample
CTA Design Element 3

Segmentation by Type of Natural Wax

  • By type of natural wax, beeswax is the market leader. Candles made of beeswax are well known for their natural, warm, and bright light. They are frequently used as decorative candles in homes and for religious occasions.
  • During the projected period, the carnauba wax category is anticipated to exhibit a sizable CAGR. Carnauba wax’s capacity to create a high-gloss surface and its resilience to wear and moisture are two of its primary qualities. This makes it appealing for a range of uses.
  • Other types of natural waxes, such as soy wax, candelilla wax, jojoba wax, palm wax, and bayberry wax, also contribute to the demand for natural wax.

Segmentation by Application

  • The main application categories are cosmetics and personal care. Technology developments in the beauty and personal care industries have produced goods with better performance, durability, and formulas to satisfy changing consumer demands.
  • The candles category will likely register a significant CAGR during the forecasting period. Because natural waxes burn cleanly and are environmentally beneficial, they are frequently utilized in candle making. One common option for manufacturing candles is soy wax. It is renewable and biodegradable, and it is made from soybean oil. Soy candles produce little to no soot and burn evenly, gently, and cleanly. They are very good at holding scents.
  • Other applications, such as pharmaceuticals, food and beverage, polishes and coatings, adhesives and sealants, textiles and paper, and traditional and cultural uses, also contribute to the demand for natural wax.

Segmentation by End-Use Industry

  • The category for consumer goods is anticipated to experience the highest CAGR during the projection period. Natural waxes, whether sourced from plants or animals, are prized for their adaptability and capacity to fulfill various purposes in consumer goods, thereby satisfying the increasing demand for environmentally friendly and sustainable products. They enhance the general caliber and environmental consciousness of the goods they use.
  • Other end-use industries, such as manufacturing, pharmaceutical and healthcare, automotive, food and beverage, textiles, and paper, also contribute to the demand for natural wax.

Segmentation by Region

  • The natural wax market was led by North America. Regulations and certifications in certain North American regions encourage using natural and organic components in consumer goods. This promotes the use of natural waxes in products that have the potential to be sold as being clean and eco-friendly.
  • Europe is estimated to rank second in market size for natural wax.
  • Asia Pacific will witness the most rapid growth in the natural wax market.
  • The rest of the world, including Latin America, the Middle East, and Africa, meets the rest of the natural wax demand.

Natural waxes help reduce waste and prolong the shelf life of fruits and vegetables, contributing to the global market’s expansion. Consumer demand for carnauba wax will rise by about 25% in the coming years. Cosmetics manufacturers can benefit greatly from Asia’s almost 3 billion potential customers, particularly in countries like China, Japan, India, and Australia.

North America will probably rule the natural wax market during the forecasting period. This can be attributed to several personal care and cosmetics businesses. Throughout the forecast period, the demand for natural wax will likely increase due to the substantial product development from the growing popularity of cosmetics.

The Asia Pacific area is projected to show the fastest growth throughout the forecast time frame. In the upcoming years, it is anticipated that the demand for natural waxes will rise significantly in emerging countries in the Asia Pacific area, including China and India. Numerous causes, such as expanding disposable incomes, more urbanization, and growing knowledge of the advantages of natural products, are responsible for this.

Governments in the Asia-Pacific area are progressively assisting the natural wax sector using tax exemptions and other financial incentives. As a result, natural wax manufacturing costs are decreasing, and they are becoming more competitive with waxes derived from petroleum.

In the Asia Pacific area, natural wax product sales are expanding quickly online. This is caused by various elements, including the ease of online purchasing, the large selection of goods offered, and the affordable costs of online merchants.

Key Highlights of the Report

The global natural wax market is segmented by type of natural wax, application, end-use industry, and region. As far as the type of natural wax is concerned, beeswax is the market spearhead. Cosmetics and personal care are the top application segment. During the forecast period, the consumer goods category is expected to grow at the highest CAGR. North America is driving the natural wax market growth.

People are spending more money on upscale goods as their disposable income rises. Soy wax (a type of natural wax) is one such product because of its velvety texture and extended durability, and it is used in skincare and cosmetics. It is a premium product because soya wax is so easy to combine with natural scents like olive oil, lavender, and hay grass. This allows customers to enjoy the pleasant scent of the added ingredients with less soot, which relaxes and elevates them during aromatherapy or bath times. Because of its soft and creamy texture, soy wax is widely used in cosmetics, giving it more market opportunity.

However, according to forecasts, North America will hold the largest share of the market for natural wax globally. Because natural waxes are easy to use and biodegradable, they are increasingly used in 3D printing as mold-making and support materials. Natural wax applications now have more options due to the quick development of 3D printing technology in the North American region. Additionally, the Asia-Pacific (APAC) region is assumed to have the sharpest growth in the market. Asia Pacific consumers’ inclinations are increasing in favor of natural and organic goods.

Which Key Factors Are Driving The Global Natural Wax Market?

The leading drivers of the natural wax market are traceability in the natural wax supply chain, adding value and natural waxes contributing to the development of biodegradable packaging.

What Are The Key Challenges In The Global Market For Natural Wax?

The issues impeding the market’s growth are competition from synthetic waxes, quality variability, environmental challenges, and ethical and sustainability concerns.

What Market Opportunities Exist For Natural Wax Globally?

The market for natural wax offers a chance to support moral and environmentally friendly beekeeping methods and natural waxes can be used in crop protection and agricultural products. These are the market opportunities that exist for natural wax globally.

Market Drivers

Several factors influence the market for natural wax globally. The main factors influencing the market for Natural Wax globally are as follows:

Growing Demand for Sustainable Products

Natural waxes, like soy, beeswax, and palm oil, are biodegradable and made from renewable resources. This lessens the negative environmental effects of natural wax products and is consistent with sustainability ideals. Naturally derived waxes are less environmentally harmful than those derived from petroleum. Natural waxes are a more environmentally friendly option because their extraction and manufacture frequently have fewer detrimental effects on the environment. Natural, eco-friendly, and environmentally safe items are becoming increasingly popular among consumers. Natural wax products are seen as more sustainable and are preferred by customers who care about the environment.

Market Restraints

Several challenges could prevent the expansion of the global market for natural wax. Among them are the following:

Price Volatility

Due to price variations, companies and manufacturers who use natural waxes frequently need more certainty regarding their production costs. It may be easier to plan and budget successfully when there are few uncertainties. When the cost of natural waxes surpasses that of synthetic counterparts, they may lose their competitive edge. This may drive producers to choose synthetic waxes that are more affordable and stable. Profit margins for companies in the natural wax industry may be impacted by price fluctuation. Businesses that see price increases may pass on the cost to customers or accept smaller margins, which could result in reduced sales.

Opportunities

The global market for natural wax presents significant potential opportunities. The following is an example of these:

Rising Popularity of Home Fragrance Products

The natural wax market is growing due to the growing demand for home fragrance goods. Because of their many advantages, natural waxes like beeswax and soy wax are becoming increasingly common in home scent goods. The application of essential oils to enhance mood, lessen tension, and encourage relaxation is known as aromatherapy. Essential oil-based home fragrance products are gaining popularity as customers seek to enhance their overall quality of life. Customers are searching for home fragrance goods that represent their tastes and styles. In response to this demand, producers are expanding their product offerings to include various scents, styles, and packaging.

Competitive Landscape

Key Players

The global market for natural wax is very competitive, with many powerful players. Some of the leading market participants and their corresponding market shares are listed below:

  • BASF SE
  • Altana AG
  • Sasol Ltd
  • Lubrizol Corporation
  • ExxonMobil Corporation
  • Wacker Chemie AG
  • Others

These companies make mergers and acquisitions, expanding their distribution network and developing new products a priority to remain competitive in the market.

The leading competitors in the global market for Natural Wax are constantly looking for ways to get an advantage by releasing new items and advancements.

In March 2022, AWAX s.p.a., a global company with expertise in creating, manufacturing, and marketing wax products, acquired Sasol’s German subsidiary Sasol Wax GmbH from Sasol.

In August 2020, For the marketing, distribution, and logistics of Sasol’s chemicals and wax products in the European market, the firm and DKSH Management Ltd. (Switzerland) agreed to a distribution agreement.

Summary of Key Findings

  • The industry continues to grow due to the improved extraction methods that enhance natural wax production, and natural waxes are often used in recyclable products.
  • The market is segmented by type of natural wax, application, end-use industry, and region.
  • Beeswax is one of the most popular natural wax types in the market.
  • The most ubiquitous application fragments are cosmetics and personal care.
  • Regarding CAGR, the consumer goods industry is expected to grow fastest during the forecast period.
  • North America is leading market development; the market is highly competitive with key players including BASF SE, Altana AG, Sasol Ltd, Lubrizol Corporation, ExxonMobil Corporation, Wacker Chemie AG, and others.

Shape Your Report to Specific Countries or Regions & Enjoy 30% Off!

Future Outlook

  • Optimistic viewpoint for the global natural wax market with noteworthy growth potential in the North American region.
  • One of the primary factors propelling the growth of the market for natural wax is the rising demand for organic products.
  • The variability of wax composition may act as a key constraint to the market’s growth in the near future.
  • Foremost companies must concentrate on product innovation, expanding their market reach, and maintaining competitive pricing to stay ahead.

Segmentation

  • By Type of Natural Wax
    • Beeswax
    • Carnauba Wax
    • Soy Wax
    • Candelilla Wax
    • Jojoba Wax
    • Palm Wax
    • Bayberry Wax
  • By Application
    • Cosmetics and Personal Care
    • Pharmaceuticals
    • Food and Beverage
    • Candles
    • Polishes and Coatings
    • Adhesives and Sealants
    • Textiles and Paper
    • Traditional and Cultural Uses
  • By End-Use Industry
    • Manufacturing
    • Consumer Goods
    • Pharmaceutical and Healthcare
    • Automotive
    • Food and Beverage
    • Textiles and Paper
  • By Region
    • North America
      • The U.S.
      • Canada
      • Mexico
    • Europe
      • Germany
      • France
      • The U.K.
      • Italy
      • Spain
      • Rest of Europe
    • Asia Pacific
      • China
      • Japan
      • India
      • South Korea
      • South-east Asia
      • Rest of Asia Pacific
    • Latin America
      • Brazil
      • Argentina
      • Rest of Latin America
    • Middle East & Africa
      • GCC Countries
      • South Africa
      • Rest of the Middle East and Africa

Adjacent Markets

There are several related markets in the natural wax industry with significant potential for revenue growth. The major markets adjacent to the natural wax market –

1. Preface

1.1. Report Description

1.1.1. Purpose of the Report

1.1.2. Target Audience

1.1.3. USP and Key Offerings

1.2. Research Scope

1.3. Market Introduction


2. Executive Summary

2.1. Market Snapshot: Global Natural Wax Market

2.1.1. Global Natural Wax Market, By Type of Natural Wax

2.1.2. Global Natural Wax Market, By Application

2.1.3. Global Natural Wax Market, By End-Use Industry

2.1.4. Global Natural Wax Market, By Region

2.2. Insights from Primary Respondents


3. Market Dynamics & Factors Analysis

3.1. Introduction

3.1.1. Global Natural Wax Market Value, 2017-2030, (US$ Mn)

3.1.2. Y-o-Y Growth Trend Analysis

3.2. Market Dynamics

3.2.1. Natural Wax Market Drivers

3.2.2. Natural Wax Market Restraints

3.2.3. Natural Wax Market Opportunities

3.2.4. Major Natural Wax Industry Challenges

3.3. Growth and Development Patterns

3.4. Investment Feasibility Analysis

3.5. Market Opportunity Analysis

3.5.1. Type of Natural Wax

3.5.2. Application

3.5.3. End-Use Industry

3.5.4. Geography


4. Market Competitive Landscape Analysis

4.1. Company Market Share Analysis, 2022

4.1.1. Global Natural Wax Market: Company Market Share, Value 2022

4.1.2. Global Natural Wax Market: Top 6 Company Market Share, Value 2022

4.1.3. Global Natural Wax Market: Top 3 Company Market Share, Value 2022

4.2.   Global Natural Wax Market: Company Revenue Share Analysis, 2022

4.3.  Company Assessment Metrics, 2022

4.3.1. Stars

4.3.2. Emerging Leaders

4.3.3. Pervasive Players

4.3.4. Participants

4.4. Startups/ SMEs Assessment Metrics, 2022

4.4.1. Progressive Companies

4.4.2. Responsive Companies

4.4.3. Dynamic Companies

4.4.4. Starting Blocks

4.5. Strategic Development

4.5.1. Acquisition and Mergers

4.5.2. New Product Launch

4.5.3. Regional Expansion

4.5.4. Partnerships

4.6. Key Player Product Matrix

4.7. Potential for New Players in the Global Natural Wax Market


5. Premium Insights

5.1. STAR (Situation, Task, Action, Results) Analysis

5.2. Porter’s Five Forces Analysis

5.2.1. Threat of New Entrants

5.2.2. Bargaining Power of Buyers/Consumers

5.2.3. Bargaining Power of Suppliers

5.2.4. Threat of Substitute Types

5.2.5. Intensity of Competitive Rivalry

5.3. PESTEL Analysis

5.3.1. Political Factors

5.3.2. Economic Factors

5.3.3. Social Factors

5.3.4. Technological Factors

5.3.5. Environmental Factors

5.3.6. Legal Factors

5.4. Key Market Trends

5.4.1. Demand Side Trends

5.4.2. Supply Side Trends

5.5. Value Chain Analysis

5.6. Technology Analysis

5.6.1. Research and development in the global market

5.6.2. Patent Analysis

5.6.3. Emerging technologies and their potential disruption to the market

5.7. Consumer Behaviour Analysis

5.7.1. Consumer Preferences and Expectations

5.7.2. Factors Influencing Consumer Buying Decisions

5.7.2.1. North America

5.7.2.2. Europe

5.7.2.3. Asia Pacific

5.7.2.4. Latin America

5.7.2.5. Middle East and Africa

5.7.3. Consumer Pain Points

5.8. Analysis and Recommendations

5.9. Adjacent Market Analysis


6. Market Positioning of Key Players, 2022

6.1. Company market share of key players, 2022

6.2. Competitive Benchmarking

6.3. Market Positioning of Key Vendors

6.4. Geographical Presence Analysis

6.5. Major Strategies Adopted by Key Players

6.5.1. Key Strategies Analysis

6.5.2. Mergers and Acquisitions

6.5.3. Partnerships

6.5.4. Product Launch

6.5.5. Geographical Expansion

6.5.6. Others


7. Impact Analysis of COVID 19 and Russia – Ukraine War on Natural Wax Market

7.1. Ukraine-Russia War Impact

7.1.1. Uncertainty and Economic Instability

7.1.2. Supply chain disruptions

7.1.3. Regional market shifts

7.1.4. Shift in government priorities

7.2. COVID-19 Impact Analysis

7.2.1. Supply Chain Disruptions

7.2.2. Demand Fluctuations

7.2.3. Shift in Product Mix

7.2.4. Reduced Industrial Activity

7.2.5. Regional Impact Analysis

7.2.5.1. North America

7.2.5.2. Europe

7.2.5.3. Asia Pacific

7.2.5.4. Latin America

7.2.5.5. Middle East and Africa


8. Global Natural Wax Market, By Type of Natural Wax

8.1. Global Natural Wax Market Overview, by Type of Natural Wax

8.1.1. Global Natural Wax Market Revenue Share, By Type of Natural Wax, 2022 Vs 2030 (in %)

8.2. Beeswax

8.2.1. Global Natural Wax Market, By Beeswax, By Region, 2017-2030 (US$ Mn)

8.2.2. Market Dynamics for Beeswax

8.2.2.1. Drivers

8.2.2.2. Restraints

8.2.2.3. Opportunities

8.2.2.4. Trends

8.3. Carnauba Wax

8.3.1. Global Natural Wax Market, By Carnauba Wax, By Region, 2017-2030 (US$ Mn)

8.3.2. Market Dynamics for Carnauba Wax

8.3.2.1. Drivers

8.3.2.2. Restraints

8.3.2.3. Opportunities

8.3.2.4. Trends

8.4. Soy Wax

8.4.1. Global Natural Wax Market, By Soy Wax, By Region, 2017-2030 (US$ Mn)

8.4.2. Market Dynamics for Soy Wax

8.4.2.1. Drivers

8.4.2.2. Restraints

8.4.2.3. Opportunities

8.4.2.4. Trends

8.5. Candelilla Wax

8.5.1. Global Natural Wax Market, By Candelilla Wax, By Region, 2017-2030 (US$ Mn)

8.5.2. Market Dynamics for Candelilla Wax

8.5.2.1. Drivers

8.5.2.2. Restraints

8.5.2.3. Opportunities

8.5.2.4. Trends

8.6. Jojoba Wax

8.6.1. Global Natural Wax Market, By Jojoba Wax, By Region, 2017-2030 (US$ Mn)

8.6.2. Market Dynamics for Jojoba Wax

8.6.2.1. Drivers

8.6.2.2. Restraints

8.6.2.3. Opportunities

8.6.2.4. Trends

8.7. Palm Wax

8.7.1. Global Natural Wax Market, By Palm Wax, By Region, 2017-2030 (US$ Mn)

8.7.2. Market Dynamics for Palm Wax

8.7.2.1. Drivers

8.7.2.2. Restraints

8.7.2.3. Opportunities

8.7.2.4. Trends

8.8. Bayberry Wax

8.8.1. Global Natural Wax Market, By Bayberry Wax, By Region, 2017-2030 (US$ Mn)

8.8.2. Market Dynamics for Bayberry Wax

8.8.2.1. Drivers

8.8.2.2. Restraints

8.8.2.3. Opportunities

8.8.2.4. Trends


9. Global Natural Wax Market, By Application

9.1. Global Natural Wax Market Overview, by Application

9.1.1. Global Natural Wax Market Revenue Share, By Application, 2022 Vs 2030 (in %)

9.2. Cosmetics and Personal Care

9.2.1. Global Natural Wax Market, By Cosmetics and Personal Care, By Region, 2017-2030 (US$ Mn)

9.2.2. Market Dynamics for Cosmetics and Personal Care

9.2.2.1. Drivers

9.2.2.2. Restraints

9.2.2.3. Opportunities

9.2.2.4. Trends

9.3. Pharmaceuticals

9.3.1. Global Natural Wax Market, By Pharmaceuticals, By Region, 2017-2030 (US$ Mn)

9.3.2. Market Dynamics for Pharmaceuticals

9.3.2.1. Drivers

9.3.2.2. Restraints

9.3.2.3. Opportunities

9.3.2.4. Trends

9.4. Food and Beverage

9.4.1. Global Natural Wax Market, By Food and Beverage, By Region, 2017-2030 (US$ Mn)

9.4.2. Market Dynamics for Food and Beverage

9.4.2.1. Drivers

9.4.2.2. Restraints

9.4.2.3. Opportunities

9.4.2.4. Trends

9.5. Candles

9.5.1. Global Natural Wax Market, By Candles, By Region, 2017-2030 (US$ Mn)

9.5.2. Market Dynamics for Candles

9.5.2.1. Drivers

9.5.2.2. Restraints

9.5.2.3. Opportunities

9.5.2.4. Trends

9.6. Polishes and Coatings

9.6.1. Global Natural Wax Market, By Polishes and Coatings, By Region, 2017-2030 (US$ Mn)

9.6.2. Market Dynamics for Polishes and Coatings

9.6.2.1. Drivers

9.6.2.2. Restraints

9.6.2.3. Opportunities

9.6.2.4. Trends

9.7. Adhesives and Sealants

9.7.1. Global Natural Wax Market, By Adhesives and Sealants, By Region, 2017-2030 (US$ Mn)

9.7.2. Market Dynamics for Adhesives and Sealants

9.7.2.1. Drivers

9.7.2.2. Restraints

9.7.2.3. Opportunities

9.7.2.4. Trends

9.8. Textiles and Paper

9.8.1. Global Natural Wax Market, By Textiles and Paper, By Region, 2017-2030 (US$ Mn)

9.8.2. Market Dynamics for Textiles and Paper

9.8.2.1. Drivers

9.8.2.2. Restraints

9.8.2.3. Opportunities

9.8.2.4. Trends

9.9. Traditional and Cultural Uses

9.9.1. Global Natural Wax Market, By Traditional and Cultural Uses, By Region, 2017-2030 (US$ Mn)

9.9.2. Market Dynamics for Traditional and Cultural Uses

9.9.2.1. Drivers

9.9.2.2. Restraints

9.9.2.3. Opportunities

9.9.2.4. Trends


10. Global Natural Wax Market, By End-Use Industry

10.1. Global Natural Wax Market Overview, by End-Use Industry

10.1.1. Global Natural Wax Market Revenue Share, By End-Use Industry, 2022 Vs 2030 (in %)

10.2. Manufacturing

10.2.1. Global Natural Wax Market, By Manufacturing, By Region, 2017-2030 (US$ Mn)

10.2.2. Market Dynamics for Manufacturing

10.2.2.1. Drivers

10.2.2.2. Restraints

10.2.2.3. Opportunities

10.2.2.4. Trends

10.3. Consumer Goods

10.3.1. Global Natural Wax Market, By Consumer Goods, By Region, 2017-2030 (US$ Mn)

10.3.2. Market Dynamics for Consumer Goods

10.3.2.1. Drivers

10.3.2.2. Restraints

10.3.2.3. Opportunities

10.3.2.4. Trends

10.4. Pharmaceutical and Healthcare

10.4.1. Global Natural Wax Market, By Pharmaceutical and Healthcare, By Region, 2017-2030 (US$ Mn)

10.4.2. Market Dynamics for Pharmaceutical and Healthcare

10.4.2.1. Drivers

10.4.2.2. Restraints

10.4.2.3. Opportunities

10.4.2.4. Trends

10.5. Automotive

10.5.1. Global Natural Wax Market, By Automotive, By Region, 2017-2030 (US$ Mn)

10.5.2. Market Dynamics for Automotive

10.5.2.1. Drivers

10.5.2.2. Restraints

10.5.2.3. Opportunities

10.5.2.4. Trends

10.6. Food and Beverage

10.6.1. Global Natural Wax Market, By Food and Beverage, By Region, 2017-2030 (US$ Mn)

10.6.2. Market Dynamics for Food and Beverage

10.6.2.1. Drivers

10.6.2.2. Restraints

10.6.2.3. Opportunities

10.6.2.4. Trends

10.7. Textiles and Paper

10.7.1. Global Natural Wax Market, By Textiles and Paper, By Region, 2017-2030 (US$ Mn)

10.7.2. Market Dynamics for Textiles and Paper

10.7.2.1. Drivers

10.7.2.2. Restraints

10.7.2.3. Opportunities

10.7.2.4. Trends


11. Global Natural Wax Market, By Region

11.1. Global Natural Wax Market Overview, by Region

11.1.1. Global Natural Wax Market, By Region, 2022 vs 2030 (in%)

11.2. Type of Natural Wax

11.2.1. Global Natural Wax Market, By Type of Natural Wax, 2017-2030 (US$ Mn)

11.3. Application

11.3.1. Global Natural Wax Market, By Application, 2017-2030 (US$ Mn)

11.4. End-Use Industry

11.4.1. Global Natural Wax Market, By End-Use Industry, 2017-2030 (US$ Mn)


12. North America Natural Wax Market Analysis

12.1. Overview

12.1.1. Market Dynamics for North America

12.1.1.1. Drivers

12.1.1.2. Restraints

12.1.1.3. Opportunities

12.1.1.4. Trends

12.2. North America Natural Wax Market, by Type of Natural Wax, 2017-2030(US$ Mn)

12.2.1. Overview

12.2.2. SRC Analysis

12.3. North America Natural Wax Market, by Application, 2017-2030(US$ Mn)

12.3.1. Overview

12.3.2. SRC Analysis

12.4. North America Natural Wax Market, by End-Use Industry, 2017-2030(US$ Mn)

12.4.1. Overview

12.4.2. SRC Analysis

12.5. North America Natural Wax Market, by Country, 2017-2030 (US$ Mn)

12.5.1. North America Natural Wax Market, by Country, 2022 Vs 2030 (in%)

12.5.2. U.S.

12.5.3. Canada

12.5.4. Mexico


13. Europe Natural Wax Market Analysis

13.1. Overview

13.1.1. Market Dynamics for Europe

13.1.1.1. Drivers

13.1.1.2. Restraints

13.1.1.3. Opportunities

13.1.1.4. Trends

13.2. Europe Natural Wax Market, by Type of Natural Wax, 2017-2030(US$ Mn)

13.2.1. Overview

13.2.2. SRC Analysis

13.3. Europe Natural Wax Market, by Application, 2017-2030(US$ Mn)

13.3.1. Overview

13.3.2. SRC Analysis

13.4. Europe Natural Wax Market, by End-Use Industry, 2017-2030(US$ Mn)

13.4.1. Overview

13.4.2. SRC Analysis

13.5. Europe Natural Wax Market, by Country, 2017-2030 (US$ Mn)

13.5.1. Europe Natural Wax Market, by Country, 2022 Vs 2030 (in%)

13.5.2. UK

13.5.3. France

13.5.4. Germany

13.5.5. Italy

13.5.6. Spain

13.5.7. Benelux

13.5.8. Russia

13.5.9. Rest of Europe


14. Asia Pacific Natural Wax Market Analysis

14.1. Overview

14.1.1. Market Dynamics for Asia Pacific

14.1.1.1. Drivers

14.1.1.2. Restraints

14.1.1.3. Opportunities

14.1.1.4. Trends

14.2. Asia Pacific Natural Wax Market, by Type of Natural Wax, 2017-2030(US$ Mn)

14.2.1. Overview

14.2.2. SRC Analysis

14.3. Asia Pacific Natural Wax Market, by Application, 2017-2030(US$ Mn)

14.3.1. Overview

14.3.2. SRC Analysis

14.4. Asia Pacific Natural Wax Market, by End-Use Industry, 2017-2030(US$ Mn)

14.4.1. Overview

14.4.2. SRC Analysis

14.5. Asia Pacific Natural Wax Market, by Country, 2017-2030 (US$ Mn)

14.5.1. Asia Pacific Natural Wax Market, by Country, 2022 Vs 2030 (in%)

14.5.2. China

14.5.3. Japan

14.5.4. India

14.5.5. South Korea

14.5.6. South East Asia

14.5.7. Rest of Asia Pacific


15. Latin America Natural Wax Market Analysis

15.1. Overview

15.1.1. Market Dynamics for Latin America

15.1.1.1. Drivers

15.1.1.2. Restraints

15.1.1.3. Opportunities

15.1.1.4. Trends

15.2. Latin America Natural Wax Market, by Type of Natural Wax, 2017-2030(US$ Mn)

15.2.1. Overview

15.2.2. SRC Analysis

15.3. Latin America Natural Wax Market, by Application, 2017-2030(US$ Mn)

15.3.1. Overview

15.3.2. SRC Analysis

15.4. Latin America Natural Wax Market, by End-Use Industry, 2017-2030(US$ Mn)

15.4.1. Overview

15.4.2. SRC Analysis

15.5. Latin America Natural Wax Market, by Country, 2017-2030 (US$ Mn)

15.5.1. Latin America Natural Wax Market, by Country, 2022 Vs 2030 (in%)

15.5.2. Brazil

15.5.3. Argentina

15.5.4. Rest of Latin America


16. Middle East Natural Wax Market Analysis

16.1. Overview

16.1.1. Market Dynamics for Middle East

16.1.1.1. Drivers

16.1.1.2. Restraints

16.1.1.3. Opportunities

16.1.1.4. Trends

16.2. Middle East Natural Wax Market, by Type of Natural Wax, 2017-2030(US$ Mn)

16.2.1. Overview

16.2.2. SRC Analysis

16.3. Middle East Natural Wax Market, by Application, 2017-2030(US$ Mn)

16.3.1. Overview

16.3.2. SRC Analysis

16.4. Middle East Natural Wax Market, by End-Use Industry, 2017-2030(US$ Mn)

16.4.1. Overview

16.4.2. SRC Analysis

16.5. Middle East Natural Wax Market, by Country, 2017-2030 (US$ Mn)

16.5.1. Middle East Natural Wax Market, by Country, 2022 Vs 2030 (in%)

16.5.2. UAE

16.5.3. Saudi Arabia

16.5.4. Rest of Middle East


17. Africa Natural Wax Market Analysis

17.1. Overview

17.1.1. Market Dynamics for Africa

17.1.1.1. Drivers

17.1.1.2. Restraints

17.1.1.3. Opportunities

17.1.1.4. Trends

17.2. Africa Natural Wax Market, by Type of Natural Wax, 2017-2030(US$ Mn)

17.2.1. Overview

17.2.2. SRC Analysis

17.3. Africa Natural Wax Market, by Application, 2017-2030(US$ Mn)

17.3.1. Overview

17.3.2. SRC Analysis

17.4. Africa Natural Wax Market, by End-Use Industry, 2017-2030(US$ Mn)

17.4.1. Overview

17.4.2. SRC Analysis

17.5. Africa Natural Wax Market, by Country, 2017-2030 (US$ Mn)

17.5.1. Africa Natural Wax Market, by Country, 2022 Vs 2030 (in%)

17.5.2. South Africa

17.5.3. Egypt

17.5.4. Rest of Africa


18. Company Profiles

18.1. BASF SE

18.1.1. Company Overview

18.1.2. Products/Services Portfolio

18.1.3. Geographical Presence

18.1.4. SWOT Analysis

18.1.5. Financial Summary

18.1.5.1. Market Revenue and Net Profit (2019-2022)

18.1.5.2. Business Segment Revenue Analysis

18.1.5.3. Geographical Revenue Analysis

18.2. Altana AG

18.3. Sasol Ltd

18.4. Lubrizol Corporation

18.5. ExxonMobil Corporation

18.6. Wacker Chemie AG

18.7. Others


19. Research Methodology

19.1. Research Methodology

19.2. Phase I – Secondary Research

19.3. Phase II – Data Modelling

19.3.1. Company Share Analysis Model

19.3.2. Revenue Based Modelling

19.4. Phase III – Primary Research

19.5. Research Limitations

19.5.1. Assumptions

List of Figures

FIG. 1 Global Natural Wax Market: Research Methodology

FIG. 2 Market Size Estimation – Top Down & Bottom up Approach

FIG. 3 Global Natural Wax Market Segmentation

FIG. 4 Global Natural Wax Market, by Type of Natural Wax, 2022 (US$ Mn)

FIG. 5 Global Natural Wax Market, by Application, 2022 (US$ Mn)

FIG. 6 Global Natural Wax Market, by End-Use Industry, 2022 (US$ Mn)

FIG. 7 Global Natural Wax Market, by Geography, 2022 (US$ Mn)

FIG. 8 Attractive Investment Proposition, by Type of Natural Wax, 2022

FIG. 9 Attractive Investment Proposition, by Application, 2022

FIG. 10 Attractive Investment Proposition, by End-Use Industry, 2022

FIG. 11 Attractive Investment Proposition, by Geography, 2022

FIG. 12 Global Market Share Analysis of Key Natural Wax Market Manufacturers, 2022

FIG. 13 Global Market Positioning of Key Natural Wax Market Manufacturers, 2022

FIG. 14 Global Natural Wax Market Value Contribution, By Type of Natural Wax, 2022 & 2030 (Value %)

FIG. 15 Global Natural Wax Market, by Beeswax, Value, 2017-2030 (US$ Mn)

FIG. 16 Global Natural Wax Market, by Carnauba Wax, Value, 2017-2030 (US$ Mn)

FIG. 17 Global Natural Wax Market, by Soy Wax, Value, 2017-2030 (US$ Mn)

FIG. 18 Global Natural Wax Market, by Candelilla Wax, Value, 2017-2030 (US$ Mn)

FIG. 19 Global Natural Wax Market, by Jojoba Wax, Value, 2017-2030 (US$ Mn)

FIG. 20 Global Natural Wax Market, by Palm Wax, Value, 2017-2030 (US$ Mn)

FIG. 21 Global Natural Wax Market, by Bayberry Wax, Value, 2017-2030 (US$ Mn)

FIG. 22 Global Natural Wax Market Value Contribution, By Application, 2022 & 2030 (Value %)

FIG. 23 Global Natural Wax Market, by Cosmetics and Personal Care, Value, 2017-2030 (US$ Mn)

FIG. 24 Global Natural Wax Market, by Pharmaceuticals, Value, 2017-2030 (US$ Mn)

FIG. 25 Global Natural Wax Market, by Food and Beverage, Value, 2017-2030 (US$ Mn)

FIG. 26 Global Natural Wax Market, by Candles, Value, 2017-2030 (US$ Mn)

FIG. 27 Global Natural Wax Market, by Polishes and Coatings, Value, 2017-2030 (US$ Mn)

FIG. 28 Global Natural Wax Market, by Adhesives and Sealants, Value, 2017-2030 (US$ Mn)

FIG. 29 Global Natural Wax Market, by Textiles and Paper, Value, 2017-2030 (US$ Mn)

FIG. 30 Global Natural Wax Market, by Traditional and Cultural Uses, Value, 2017-2030 (US$ Mn)

FIG. 31 Global Natural Wax Market Value Contribution, By End-Use Industry, 2022 & 2030 (Value %)

FIG. 32 Global Natural Wax Market, by Manufacturing, Value, 2017-2030 (US$ Mn)

FIG. 33 Global Natural Wax Market, by Consumer Goods, Value, 2017-2030 (US$ Mn)

FIG. 34 Global Natural Wax Market, by Pharmaceutical and Healthcare, Value, 2017-2030 (US$ Mn)

FIG. 35 Global Natural Wax Market, by Automotive, Value, 2017-2030 (US$ Mn)

FIG. 36 Global Natural Wax Market, by Food and Beverage, Value, 2017-2030 (US$ Mn)

FIG. 37 Global Natural Wax Market, by Textiles and Paper, Value, 2017-2030 (US$ Mn)

FIG. 38 North America Natural Wax Market, 2017-2030 (US$ Mn)

FIG. 39 U.S. Natural Wax Market, 2017-2030 (US$ Mn)

FIG. 40 Canada Natural Wax Market, 2017-2030 (US$ Mn)

FIG. 41 Mexico Natural Wax Market, 2017-2030 (US$ Mn)

FIG. 42 Europe Natural Wax Market, 2017-2030 (US$ Mn)

FIG. 43 Germany Natural Wax Market, 2017-2030 (US$ Mn)

FIG. 44 France Natural Wax Market, 2017-2030 (US$ Mn)

FIG. 45 U.K. Natural Wax Market, 2017-2030 (US$ Mn)

FIG. 46 Italy Natural Wax Market, 2017-2030 (US$ Mn)

FIG. 47 Spain Natural Wax Market, 2017-2030 (US$ Mn)

FIG. 48 Benelux Natural Wax Market, 2017-2030 (US$ Mn)

FIG. 49 Russia Natural Wax Market, 2017-2030 (US$ Mn)

FIG. 50 Rest of Europe Natural Wax Market, 2017-2030 (US$ Mn)

FIG. 51 Asia Pacific Natural Wax Market, 2017-2030 (US$ Mn)

FIG. 52 China Natural Wax Market, 2017-2030 (US$ Mn)

FIG. 53 Japan Natural Wax Market, 2017-2030 (US$ Mn)

FIG. 54 India Natural Wax Market, 2017-2030 (US$ Mn)

FIG. 55 South Korea Natural Wax Market, 2017-2030 (US$ Mn)

FIG. 56 South-East Asia Natural Wax Market, 2017-2030 (US$ Mn)

FIG. 57 Rest of Asia Pacific Natural Wax Market, 2017-2030 (US$ Mn)

FIG. 58 Latin America Natural Wax Market, 2017-2030 (US$ Mn)

FIG. 59 Brazil Natural Wax Market, 2017-2030 (US$ Mn)

FIG. 60 Argentina Natural Wax Market, 2017-2030 (US$ Mn)

FIG. 61 Rest of Latin America Natural Wax Market, 2017-2030 (US$ Mn)

FIG. 62 Middle East Natural Wax Market, 2017-2030 (US$ Mn)

FIG. 63 UAE Natural Wax Market, 2017-2030 (US$ Mn)

FIG. 64 Saudi Arabia Natural Wax Market, 2017-2030 (US$ Mn)

FIG. 65 Rest of Middle East Natural Wax Market, 2017-2030 (US$ Mn)

FIG. 66 Africa Natural Wax Market, 2017-2030 (US$ Mn)

FIG. 67 South Africa Natural Wax Market, 2017-2030 (US$ Mn)

FIG. 68 Egypt Natural Wax Market, 2017-2030 (US$ Mn)

FIG. 69 Rest of Africa Natural Wax Market, 2017-2030 (US$ Mn)


List of Tables

TABLE 1 Market Snapshot: Global Natural Wax Market

TABLE 2 Global Natural Wax Market: Market Drivers Impact Analysis

TABLE 3 Global Natural Wax Market: Market Restraints Impact Analysis

TABLE 4 Global Natural Wax Market, by Competitive Benchmarking, 2022

TABLE 5 Global Natural Wax Market, by Geographical Presence Analysis, 2022

TABLE 6 Global Natural Wax Market, by Key Strategies Analysis, 2022

TABLE 7 Global Natural Wax Market, by Beeswax, By Region, 2017-2022 (US$ Mn)

TABLE 8 Global Natural Wax Market, by Beeswax, By Region, 2023-2030 (US$ Mn)

TABLE 9 Global Natural Wax Market, by Carnauba Wax, By Region, 2017-2022 (US$ Mn)

TABLE 10 Global Natural Wax Market, by Carnauba Wax, By Region, 2023-2030 (US$ Mn)

TABLE 11 Global Natural Wax Market, by Soy Wax, By Region, 2017-2022 (US$ Mn)

TABLE 12 Global Natural Wax Market, by Soy Wax, By Region, 2023-2030 (US$ Mn)

TABLE 13 Global Natural Wax Market, by Candelilla Wax, By Region, 2017-2022 (US$ Mn)

TABLE 14 Global Natural Wax Market, by Candelilla Wax, By Region, 2023-2030 (US$ Mn)

TABLE 15 Global Natural Wax Market, by Jojoba Wax, By Region, 2017-2022 (US$ Mn)

TABLE 16 Global Natural Wax Market, by Jojoba Wax, By Region, 2023-2030 (US$ Mn)

TABLE 17 Global Natural Wax Market, by Palm Wax, By Region, 2017-2022 (US$ Mn)

TABLE 18 Global Natural Wax Market, by Palm Wax, By Region, 2023-2030 (US$ Mn)

TABLE 19 Global Natural Wax Market, by Bayberry Wax, By Region, 2017-2022 (US$ Mn)

TABLE 20 Global Natural Wax Market, by Bayberry Wax, By Region, 2023-2030 (US$ Mn)

TABLE 21 Global Natural Wax Market, by Cosmetics and Personal Care, By Region, 2017-2022 (US$ Mn)

TABLE 22 Global Natural Wax Market, by Cosmetics and Personal Care, By Region, 2023-2030 (US$ Mn)

TABLE 23 Global Natural Wax Market, by Pharmaceuticals, By Region, 2017-2022 (US$ Mn)

TABLE 24 Global Natural Wax Market, by Pharmaceuticals, By Region, 2023-2030 (US$ Mn)

TABLE 25 Global Natural Wax Market, by Food and Beverage, By Region, 2017-2022 (US$ Mn)

TABLE 26 Global Natural Wax Market, by Food and Beverage, By Region, 2023-2030 (US$ Mn)

TABLE 27 Global Natural Wax Market, by Candles, By Region, 2017-2022 (US$ Mn)

TABLE 28 Global Natural Wax Market, by Candles, By Region, 2023-2030 (US$ Mn)

TABLE 29 Global Natural Wax Market, by Polishes and Coatings, By Region, 2017-2022 (US$ Mn)

TABLE 30 Global Natural Wax Market, by Polishes and Coatings, By Region, 2023-2030 (US$ Mn)

TABLE 31 Global Natural Wax Market, by Adhesives and Sealants, By Region, 2017-2022 (US$ Mn)

TABLE 32 Global Natural Wax Market, by Adhesives and Sealants, By Region, 2023-2030 (US$ Mn)

TABLE 33 Global Natural Wax Market, by Textiles and Paper, By Region, 2017-2022 (US$ Mn)

TABLE 34 Global Natural Wax Market, by Textiles and Paper, By Region, 2023-2030 (US$ Mn)

TABLE 35 Global Natural Wax Market, by Traditional and Cultural Uses, By Region, 2017-2022 (US$ Mn)

TABLE 36 Global Natural Wax Market, by Traditional and Cultural Uses, By Region, 2023-2030 (US$ Mn)

TABLE 37 Global Natural Wax Market, by Manufacturing, By Region, 2017-2022 (US$ Mn)

TABLE 38 Global Natural Wax Market, by Manufacturing, By Region, 2023-2030 (US$ Mn)

TABLE 39 Global Natural Wax Market, by Consumer Goods, By Region, 2017-2022 (US$ Mn)

TABLE 40 Global Natural Wax Market, by Consumer Goods, By Region, 2023-2030 (US$ Mn)

TABLE 41 Global Natural Wax Market, by Pharmaceutical and Healthcare, By Region, 2017-2022 (US$ Mn)

TABLE 42 Global Natural Wax Market, by Pharmaceutical and Healthcare, By Region, 2023-2030 (US$ Mn)

TABLE 43 Global Natural Wax Market, by Automotive, By Region, 2017-2022 (US$ Mn)

TABLE 44 Global Natural Wax Market, by Automotive, By Region, 2023-2030 (US$ Mn)

TABLE 45 Global Natural Wax Market, by Food and Beverage, By Region, 2017-2022 (US$ Mn)

TABLE 46 Global Natural Wax Market, by Food and Beverage, By Region, 2023-2030 (US$ Mn)

TABLE 47 Global Natural Wax Market, by Textiles and Paper, By Region, 2017-2022 (US$ Mn)

TABLE 48 Global Natural Wax Market, by Textiles and Paper, By Region, 2023-2030 (US$ Mn)

TABLE 49 Global Natural Wax Market, by Type of Natural Wax, 2017-2022 (US$ Mn)

TABLE 50 Global Natural Wax Market, by Type of Natural Wax, 2023-2030 (US$ Mn)

TABLE 51 Global Natural Wax Market, by Application, 2017-2022 (US$ Mn)

TABLE 52 Global Natural Wax Market, by Application, 2023-2030 (US$ Mn)

TABLE 53 Global Natural Wax Market, by End-Use Industry, 2017-2022 (US$ Mn)

TABLE 54 Global Natural Wax Market, by End-Use Industry, 2023-2030 (US$ Mn)

TABLE 55 Global Natural Wax Market, by Region, 2017-2022 (US$ Mn)

TABLE 56 Global Natural Wax Market, by Region, 2023-2030 (US$ Mn)

TABLE 57 North America Natural Wax Market, by Type of Natural Wax, 2017-2022 (US$ Mn)

TABLE 58 North America Natural Wax Market, by Type of Natural Wax, 2023-2030 (US$ Mn)

TABLE 59 North America Natural Wax Market, by Application, 2017-2022 (US$ Mn)

TABLE 60 North America Natural Wax Market, by Application, 2023-2030 (US$ Mn)

TABLE 61 North America Natural Wax Market, by End-Use Industry, 2017-2022 (US$ Mn)

TABLE 62 North America Natural Wax Market, by End-Use Industry, 2023-2030 (US$ Mn)

TABLE 63 North America Natural Wax Market, by Country, 2017-2022 (US$ Mn)

TABLE 64 North America Natural Wax Market, by Country, 2023-2030 (US$ Mn)

TABLE 65 United States Natural Wax Market, by Type of Natural Wax, 2017-2022 (US$ Mn)

TABLE 66 United States Natural Wax Market, by Type of Natural Wax, 2023-2030 (US$ Mn)

TABLE 67 United States Natural Wax Market, by Application, 2017-2022 (US$ Mn)

TABLE 68 United States Natural Wax Market, by Application, 2023-2030 (US$ Mn)

TABLE 69 United States Natural Wax Market, by End-Use Industry, 2017-2022 (US$ Mn)

TABLE 70 United States Natural Wax Market, by End-Use Industry, 2023-2030 (US$ Mn)

TABLE 71 Canada Natural Wax Market, by Type of Natural Wax, 2017-2022 (US$ Mn)

TABLE 72 Canada Natural Wax Market, by Type of Natural Wax, 2023-2030 (US$ Mn)

TABLE 73 Canada Natural Wax Market, by Application, 2017-2022 (US$ Mn)

TABLE 74 Canada Natural Wax Market, by Application, 2023-2030 (US$ Mn)

TABLE 75 Canada Natural Wax Market, by End-Use Industry, 2017-2022 (US$ Mn)

TABLE 76 Canada Natural Wax Market, by End-Use Industry, 2023-2030 (US$ Mn)

TABLE 77 Mexico Natural Wax Market, by Type of Natural Wax, 2017-2022 (US$ Mn)

TABLE 78 Mexico Natural Wax Market, by Type of Natural Wax, 2023-2030 (US$ Mn)

TABLE 79 Mexico Natural Wax Market, by Application, 2017-2022 (US$ Mn)

TABLE 80 Mexico Natural Wax Market, by Application, 2023-2030 (US$ Mn)

TABLE 81 Mexico Natural Wax Market, by End-Use Industry, 2017-2022 (US$ Mn)

TABLE 82 Mexico Natural Wax Market, by End-Use Industry, 2023-2030 (US$ Mn)

TABLE 83 Europe Natural Wax Market, by Type of Natural Wax, 2017-2022 (US$ Mn)

TABLE 84 Europe Natural Wax Market, by Type of Natural Wax, 2023-2030 (US$ Mn)

TABLE 85 Europe Natural Wax Market, by Application, 2017-2022 (US$ Mn)

TABLE 86 Europe Natural Wax Market, by Application, 2023-2030 (US$ Mn)

TABLE 87 Europe Natural Wax Market, by End-Use Industry, 2017-2022 (US$ Mn)

TABLE 88 Europe Natural Wax Market, by End-Use Industry, 2023-2030 (US$ Mn)

TABLE 89 Europe Natural Wax Market, by Country, 2017-2022 (US$ Mn)

TABLE 90 Europe Natural Wax Market, by Country, 2023-2030 (US$ Mn)

TABLE 91 Germany Natural Wax Market, by Type of Natural Wax, 2017-2022 (US$ Mn)

TABLE 92 Germany Natural Wax Market, by Type of Natural Wax, 2023-2030 (US$ Mn)

TABLE 93 Germany Natural Wax Market, by Application, 2017-2022 (US$ Mn)

TABLE 94 Germany Natural Wax Market, by Application, 2023-2030 (US$ Mn)

TABLE 95 Germany Natural Wax Market, by End-Use Industry, 2017-2022 (US$ Mn)

TABLE 96 Germany Natural Wax Market, by End-Use Industry, 2023-2030 (US$ Mn)

TABLE 97 France Natural Wax Market, by Type of Natural Wax, 2017-2022 (US$ Mn)

TABLE 98 France Natural Wax Market, by Type of Natural Wax, 2023-2030 (US$ Mn)

TABLE 99 France Natural Wax Market, by Application, 2017-2022 (US$ Mn)

TABLE 100 France Natural Wax Market, by Application, 2023-2030 (US$ Mn)

TABLE 101 France Natural Wax Market, by End-Use Industry, 2017-2022 (US$ Mn)

TABLE 102 France Natural Wax Market, by End-Use Industry, 2023-2030 (US$ Mn)

TABLE 103 United Kingdom Natural Wax Market, by Type of Natural Wax, 2017-2022 (US$ Mn)

TABLE 104 United Kingdom Natural Wax Market, by Type of Natural Wax, 2023-2030 (US$ Mn)

TABLE 105 United Kingdom Natural Wax Market, by Application, 2017-2022 (US$ Mn)

TABLE 106 United Kingdom Natural Wax Market, by Application, 2023-2030 (US$ Mn)

TABLE 107 United Kingdom Natural Wax Market, by End-Use Industry, 2017-2022 (US$ Mn)

TABLE 108 United Kingdom Natural Wax Market, by End-Use Industry, 2023-2030 (US$ Mn)

TABLE 109 Italy Natural Wax Market, by Type of Natural Wax, 2017-2022 (US$ Mn)

TABLE 110 Italy Natural Wax Market, by Type of Natural Wax, 2023-2030 (US$ Mn)

TABLE 111 Italy Natural Wax Market, by Application, 2017-2022 (US$ Mn)

TABLE 112 Italy Natural Wax Market, by Application, 2023-2030 (US$ Mn)

TABLE 113 Italy Natural Wax Market, by End-Use Industry, 2017-2022 (US$ Mn)

TABLE 114 Italy Natural Wax Market, by End-Use Industry, 2023-2030 (US$ Mn)

TABLE 115 Spain Natural Wax Market, by Type of Natural Wax, 2017-2022 (US$ Mn)

TABLE 116 Spain Natural Wax Market, by Type of Natural Wax, 2023-2030 (US$ Mn)

TABLE 117 Spain Natural Wax Market, by Application, 2017-2022 (US$ Mn)

TABLE 118 Spain Natural Wax Market, by Application, 2023-2030 (US$ Mn)

TABLE 119 Spain Natural Wax Market, by End-Use Industry, 2017-2022 (US$ Mn)

TABLE 120 Spain Natural Wax Market, by End-Use Industry, 2023-2030 (US$ Mn)

TABLE 121 Benelux Natural Wax Market, by Type of Natural Wax, 2017-2022 (US$ Mn)

TABLE 122 Benelux Natural Wax Market, by Type of Natural Wax, 2023-2030 (US$ Mn)

TABLE 123 Benelux Natural Wax Market, by Application, 2017-2022 (US$ Mn)

TABLE 124 Benelux Natural Wax Market, by Application, 2023-2030 (US$ Mn)

TABLE 125 Benelux Natural Wax Market, by End-Use Industry, 2017-2022 (US$ Mn)

TABLE 126 Benelux Natural Wax Market, by End-Use Industry, 2023-2030 (US$ Mn)

TABLE 127 Russia Natural Wax Market, by Type of Natural Wax, 2017-2022 (US$ Mn)

TABLE 128 Russia Natural Wax Market, by Type of Natural Wax, 2023-2030 (US$ Mn)

TABLE 129 Russia Natural Wax Market, by Application, 2017-2022 (US$ Mn)

TABLE 130 Russia Natural Wax Market, by Application, 2023-2030 (US$ Mn)

TABLE 131 Russia Natural Wax Market, by End-Use Industry, 2017-2022 (US$ Mn)

TABLE 132 Russia Natural Wax Market, by End-Use Industry, 2023-2030 (US$ Mn)

TABLE 133 Rest of Europe Natural Wax Market, by Type of Natural Wax, 2017-2022 (US$ Mn)

TABLE 134 Rest of Europe Natural Wax Market, by Type of Natural Wax, 2023-2030 (US$ Mn)

TABLE 135 Rest of Europe Natural Wax Market, by Application, 2017-2022 (US$ Mn)

TABLE 136 Rest of Europe Natural Wax Market, by Application, 2023-2030 (US$ Mn)

TABLE 137 Rest of Europe Natural Wax Market, by End-Use Industry, 2017-2022 (US$ Mn)

TABLE 138 Rest of Europe Natural Wax Market, by End-Use Industry, 2023-2030 (US$ Mn)

TABLE 139 Asia Pacific Natural Wax Market, by Type of Natural Wax, 2017-2022 (US$ Mn)

TABLE 140 Asia Pacific Natural Wax Market, by Type of Natural Wax, 2023-2030 (US$ Mn)

TABLE 141 Asia Pacific Natural Wax Market, by Application, 2017-2022 (US$ Mn)

TABLE 142 Asia Pacific Natural Wax Market, by Application, 2023-2030 (US$ Mn)

TABLE 143 Asia Pacific Natural Wax Market, by End-Use Industry, 2017-2022 (US$ Mn)

TABLE 144 Asia Pacific Natural Wax Market, by End-Use Industry, 2023-2030 (US$ Mn)

TABLE 145 China Natural Wax Market, by Type of Natural Wax, 2017-2022 (US$ Mn)

TABLE 146 China Natural Wax Market, by Type of Natural Wax, 2023-2030 (US$ Mn)

TABLE 147 China Natural Wax Market, by Application, 2017-2022 (US$ Mn)

TABLE 148 China Natural Wax Market, by Application, 2023-2030 (US$ Mn)

TABLE 149 China Natural Wax Market, by End-Use Industry, 2017-2022 (US$ Mn)

TABLE 150 China Natural Wax Market, by End-Use Industry, 2023-2030 (US$ Mn)

TABLE 151 Japan Natural Wax Market, by Type of Natural Wax, 2017-2022 (US$ Mn)

TABLE 152 Japan Natural Wax Market, by Type of Natural Wax, 2023-2030 (US$ Mn)

TABLE 153 Japan Natural Wax Market, by Application, 2017-2022 (US$ Mn)

TABLE 154 Japan Natural Wax Market, by Application, 2023-2030 (US$ Mn)

TABLE 155 Japan Natural Wax Market, by End-Use Industry, 2017-2022 (US$ Mn)

TABLE 156 Japan Natural Wax Market, by End-Use Industry, 2023-2030 (US$ Mn)

TABLE 157 India Natural Wax Market, by Type of Natural Wax, 2017-2022 (US$ Mn)

TABLE 158 India Natural Wax Market, by Type of Natural Wax, 2023-2030 (US$ Mn)

TABLE 159 India Natural Wax Market, by Application, 2017-2022 (US$ Mn)

TABLE 160 India Natural Wax Market, by Application, 2023-2030 (US$ Mn)

TABLE 161 India Natural Wax Market, by End-Use Industry, 2017-2022 (US$ Mn)

TABLE 162 India Natural Wax Market, by End-Use Industry, 2023-2030 (US$ Mn)

TABLE 163 South Korea Natural Wax Market, by Type of Natural Wax, 2017-2022 (US$ Mn)

TABLE 164 South Korea Natural Wax Market, by Type of Natural Wax, 2023-2030 (US$ Mn)

TABLE 165 South Korea Natural Wax Market, by Application, 2017-2022 (US$ Mn)

TABLE 166 South Korea Natural Wax Market, by Application, 2023-2030 (US$ Mn)

TABLE 167 South Korea Natural Wax Market, by End-Use Industry, 2017-2022 (US$ Mn)

TABLE 168 South Korea Natural Wax Market, by End-Use Industry, 2023-2030 (US$ Mn)

TABLE 169 South-East Asia Natural Wax Market, by Type of Natural Wax, 2017-2022 (US$ Mn)

TABLE 170 South-East Asia Natural Wax Market, by Type of Natural Wax, 2023-2030 (US$ Mn)

TABLE 171 South-East Asia Natural Wax Market, by Application, 2017-2022 (US$ Mn)

TABLE 172 South-East Asia Natural Wax Market, by Application, 2023-2030 (US$ Mn)

TABLE 173 South-East Asia Natural Wax Market, by End-Use Industry, 2017-2022 (US$ Mn)

TABLE 174 South-East Asia Natural Wax Market, by End-Use Industry, 2023-2030 (US$ Mn)

TABLE 175 Rest of Asia Pacific Natural Wax Market, by Type of Natural Wax, 2017-2022 (US$ Mn)

TABLE 176 Rest of Asia Pacific Natural Wax Market, by Type of Natural Wax, 2023-2030 (US$ Mn)

TABLE 177 Rest of Asia Pacific Natural Wax Market, by Application, 2017-2022 (US$ Mn)

TABLE 178 Rest of Asia Pacific Natural Wax Market, by Application, 2023-2030 (US$ Mn)

TABLE 179 Rest of Asia Pacific Natural Wax Market, by End-Use Industry, 2017-2022 (US$ Mn)

TABLE 180 Rest of Asia Pacific Natural Wax Market, by End-Use Industry, 2023-2030 (US$ Mn)

TABLE 181 Latin America Natural Wax Market, by Type of Natural Wax, 2017-2022 (US$ Mn)

TABLE 182 Latin America Natural Wax Market, by Type of Natural Wax, 2023-2030 (US$ Mn)

TABLE 183 Latin America Natural Wax Market, by Application, 2017-2022 (US$ Mn)

TABLE 184 Latin America Natural Wax Market, by Application, 2023-2030 (US$ Mn)

TABLE 185 Latin America Natural Wax Market, by End-Use Industry, 2017-2022 (US$ Mn)

TABLE 186 Latin America Natural Wax Market, by End-Use Industry, 2023-2030 (US$ Mn)

TABLE 187 Brazil Natural Wax Market, by Type of Natural Wax, 2017-2022 (US$ Mn)

TABLE 188 Brazil Natural Wax Market, by Type of Natural Wax, 2023-2030 (US$ Mn)

TABLE 189 Brazil Natural Wax Market, by Application, 2017-2022 (US$ Mn)

TABLE 190 Brazil Natural Wax Market, by Application, 2023-2030 (US$ Mn)

TABLE 191 Brazil Natural Wax Market, by End-Use Industry, 2017-2022 (US$ Mn)

TABLE 192 Brazil Natural Wax Market, by End-Use Industry, 2023-2030 (US$ Mn)

TABLE 193 Argentina Natural Wax Market, by Type of Natural Wax, 2017-2022 (US$ Mn)

TABLE 194 Argentina Natural Wax Market, by Type of Natural Wax, 2023-2030 (US$ Mn)

TABLE 195 Argentina Natural Wax Market, by Application, 2017-2022 (US$ Mn)

TABLE 196 Argentina Natural Wax Market, by Application, 2023-2030 (US$ Mn)

TABLE 197 Argentina Natural Wax Market, by End-Use Industry, 2017-2022 (US$ Mn)

TABLE 198 Argentina Natural Wax Market, by End-Use Industry, 2023-2030 (US$ Mn)

TABLE 199 Rest of Latin America Natural Wax Market, by Type of Natural Wax, 2017-2022 (US$ Mn)

TABLE 200 Rest of Latin America Natural Wax Market, by Type of Natural Wax, 2023-2030 (US$ Mn)

TABLE 201 Rest of Latin America Natural Wax Market, by Application, 2017-2022 (US$ Mn)

TABLE 202 Rest of Latin America Natural Wax Market, by Application, 2023-2030 (US$ Mn)

TABLE 203 Rest of Latin America Natural Wax Market, by End-Use Industry, 2017-2022 (US$ Mn)

TABLE 204 Rest of Latin America Natural Wax Market, by End-Use Industry, 2023-2030 (US$ Mn)

TABLE 205 Middle East Natural Wax Market, by Type of Natural Wax, 2017-2022 (US$ Mn)

TABLE 206 Middle East Natural Wax Market, by Type of Natural Wax, 2023-2030 (US$ Mn)

TABLE 207 Middle East Natural Wax Market, by Application, 2017-2022 (US$ Mn)

TABLE 208 Middle East Natural Wax Market, by Application, 2023-2030 (US$ Mn)

TABLE 209 Middle East Natural Wax Market, by End-Use Industry, 2017-2022 (US$ Mn)

TABLE 210 Middle East Natural Wax Market, by End-Use Industry, 2023-2030 (US$ Mn)

TABLE 211 UAE Natural Wax Market, by Type of Natural Wax, 2017-2022 (US$ Mn)

TABLE 212 UAE Natural Wax Market, by Type of Natural Wax, 2023-2030 (US$ Mn)

TABLE 213 UAE Natural Wax Market, by Application, 2017-2022 (US$ Mn)

TABLE 214 UAE Natural Wax Market, by Application, 2023-2030 (US$ Mn)

TABLE 215 UAE Natural Wax Market, by End-Use Industry, 2017-2022 (US$ Mn)

TABLE 216 UAE Natural Wax Market, by End-Use Industry, 2023-2030 (US$ Mn)

TABLE 217 Saudi Arabia Natural Wax Market, by Type of Natural Wax, 2017-2022 (US$ Mn)

TABLE 218 Saudi Arabia Natural Wax Market, by Type of Natural Wax, 2023-2030 (US$ Mn)

TABLE 219 Saudi Arabia Natural Wax Market, by Application, 2017-2022 (US$ Mn)

TABLE 220 Saudi Arabia Natural Wax Market, by Application, 2023-2030 (US$ Mn)

TABLE 221 Saudi Arabia Natural Wax Market, by End-Use Industry, 2017-2022 (US$ Mn)

TABLE 222 Saudi Arabia Natural Wax Market, by End-Use Industry, 2023-2030 (US$ Mn)

TABLE 223 Rest of Middle East Natural Wax Market, by Type of Natural Wax, 2017-2022 (US$ Mn)

TABLE 224 Rest of Middle East Natural Wax Market, by Type of Natural Wax, 2023-2030 (US$ Mn)

TABLE 225 Rest of Middle East Natural Wax Market, by Application, 2017-2022 (US$ Mn)

TABLE 226 Rest of Middle East Natural Wax Market, by Application, 2023-2030 (US$ Mn)

TABLE 227 Rest of Middle East Natural Wax Market, by End-Use Industry, 2017-2022 (US$ Mn)

TABLE 228 Rest of Middle East Natural Wax Market, by End-Use Industry, 2023-2030 (US$ Mn)

TABLE 229 Africa Natural Wax Market, by Type of Natural Wax, 2017-2022 (US$ Mn)

TABLE 230 Africa Natural Wax Market, by Type of Natural Wax, 2023-2030 (US$ Mn)

TABLE 231 Africa Natural Wax Market, by Application, 2017-2022 (US$ Mn)

TABLE 232 Africa Natural Wax Market, by Application, 2023-2030 (US$ Mn)

TABLE 233 Africa Natural Wax Market, by End-Use Industry, 2017-2022 (US$ Mn)

TABLE 234 Africa Natural Wax Market, by End-Use Industry, 2023-2030 (US$ Mn)

TABLE 235 South Africa Natural Wax Market, by Type of Natural Wax, 2017-2022 (US$ Mn)

TABLE 236 South Africa Natural Wax Market, by Type of Natural Wax, 2023-2030 (US$ Mn)

TABLE 237 South Africa Natural Wax Market, by Application, 2017-2022 (US$ Mn)

TABLE 238 South Africa Natural Wax Market, by Application, 2023-2030 (US$ Mn)

TABLE 239 South Africa Natural Wax Market, by End-Use Industry, 2017-2022 (US$ Mn)

TABLE 240 South Africa Natural Wax Market, by End-Use Industry, 2023-2030 (US$ Mn)

TABLE 241 Egypt Natural Wax Market, by Type of Natural Wax, 2017-2022 (US$ Mn)

TABLE 242 Egypt Natural Wax Market, by Type of Natural Wax, 2023-2030 (US$ Mn)

TABLE 243 Egypt Natural Wax Market, by Application, 2017-2022 (US$ Mn)

TABLE 244 Egypt Natural Wax Market, by Application, 2023-2030 (US$ Mn)

TABLE 245 Egypt Natural Wax Market, by End-Use Industry, 2017-2022 (US$ Mn)

TABLE 246 Egypt Natural Wax Market, by End-Use Industry, 2023-2030 (US$ Mn)

TABLE 247 Rest of Africa Natural Wax Market, by Type of Natural Wax, 2017-2022 (US$ Mn)

TABLE 248 Rest of Africa Natural Wax Market, by Type of Natural Wax, 2023-2030 (US$ Mn)

TABLE 249 Rest of Africa Natural Wax Market, by Application, 2017-2022 (US$ Mn)

TABLE 250 Rest of Africa Natural Wax Market, by Application, 2023-2030 (US$ Mn)

TABLE 251 Rest of Africa Natural Wax Market, by End-Use Industry, 2017-2022 (US$ Mn)

TABLE 252 Rest of Africa Natural Wax Market, by End-Use Industry, 2023-2030 (US$ Mn)

Frequently Asked Questions

How big is the global market for natural wax right now?

In 2022, the market for natural wax was estimated to be worth USD 1125.5 million.

What is the natural wax market’s anticipated growth rate from 2023 to 2030?

The market for natural wax is anticipated to increase at a CAGR of 6.00% from 2023 to 2030, reaching USD 1793.87 million in 2030.

In terms of the type of natural wax, which market category is in the lead?

The most widely used kind of natural wax is beeswax.

Which segment is leading the market in terms of application?

Cosmetics and personal care, by application, are the notable segment.

Which end-use industry segment is estimated to have the highest CAGR throughout the forecast period?

The consumer goods category is anticipated to exhibit the highest CAGR during the projection period.

In which region is the market for natural wax expanding?

The natural wax market was ruled by North America.

Who are the key participants in the market for natural wax globally?

The top players include BASF SE, Altana AG, Sasol Ltd, Lubrizol Corporation, ExxonMobil Corporation, Wacker Chemie AG, and others.

What are the main market factors driving the natural wax sector?

Green chemistry initiatives, a trend toward clean labels, and the development of new wax types. These are the main factors influencing the development of the global market.

What main market challenges prevent the natural wax sector from growing?

Competition from alternative materials, allergen concerns, high melting points, and seasonal fluctuations are the main market challenges that prevent the natural wax sector from developing.

What are the main market opportunities for the natural wax sector?

Natural waxes give textiles practical and water-repellent qualities that appeal to environmentally concerned consumers. The clean beauty movement has also opened markets for skincare and cosmetics products containing natural wax. These are the primary market prospects for the natural wax industry.

Powder Coating Market

Published:
Report ID: 10783

Masterbatch Market

Published:
Report ID: 37059

Polycrystalline CVD Diamond Market

Published:
Report ID: 37009

Middle East and Africa Masterbatch Market

Published:
Report ID: 36966

Ferrous Slag Market

Published:
Report ID: 6261

Surfactants Market

Published:
Report ID: 10221

Graphite Market

Published:
Report ID: 6554

Saudi Arabia Plastic Products Market

Published:
Report ID: 36905

Copper Oxychloride Market

Published:
Report ID: 12415

India Oilfield Services Market

Published:
Report ID: 36781

Collagen Market

Published:
Report ID: 36725

Isostearic Acid Market

Published:
Report ID: 7580

Purchase Options

$2999
Delivery Format: Excel.
$4999
Designed for the individual purchaser.
$6999
Users located at a single corporate site or regional office.
$7999
Allowed for unlimited sharing globally within one company.
Smallform of Sample request

Have a question?

User Profile

Don’t settle for less – trust Mitul to help you find the best solution.

Report delivery within 24 to 48 hours

– Other Info –

What people say?-

User Review

I am very impressed with the information in this report. The author clearly did their research when they came up with this product and it has already given me a lot of ideas.

Jana Schmidt
CEDAR CX Technologies

– Connect with us –

Phone

+91 6232 49 3207


support

24/7 Research Support


sales@credenceresearch.com

– Research Methodology –

Going beyond the basics: advanced techniques in research methodology

– Trusted By –

Pepshi, LG, Nestle
Motorola, Honeywell, Johnson and johnson
LG Chem, SIEMENS, Pfizer
Unilever, Samsonite, QIAGEN