
Market Overview:
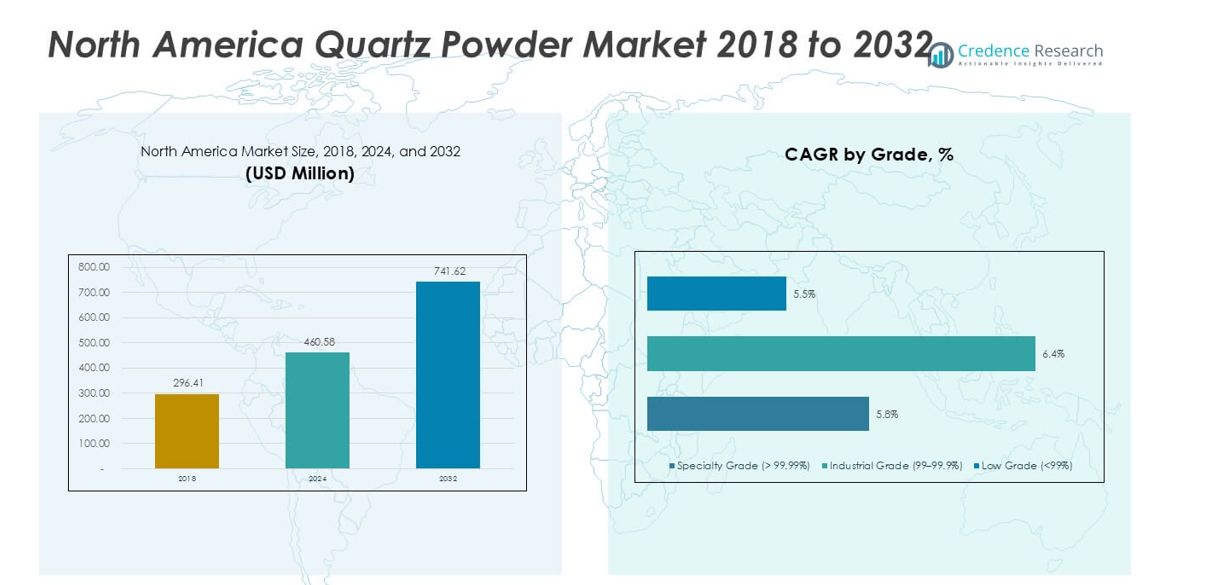
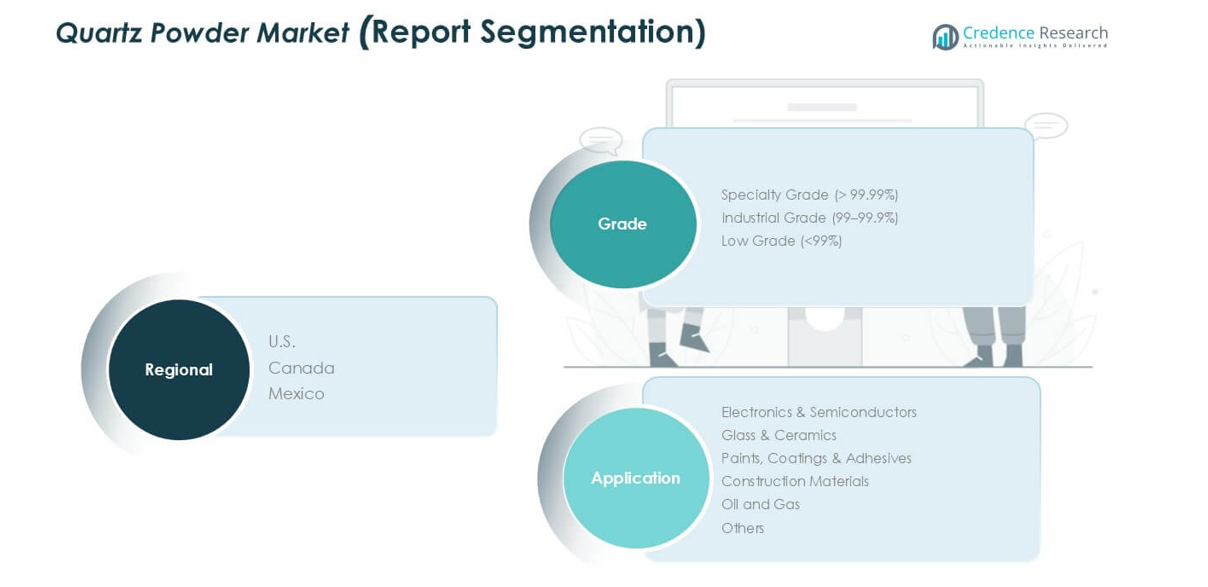
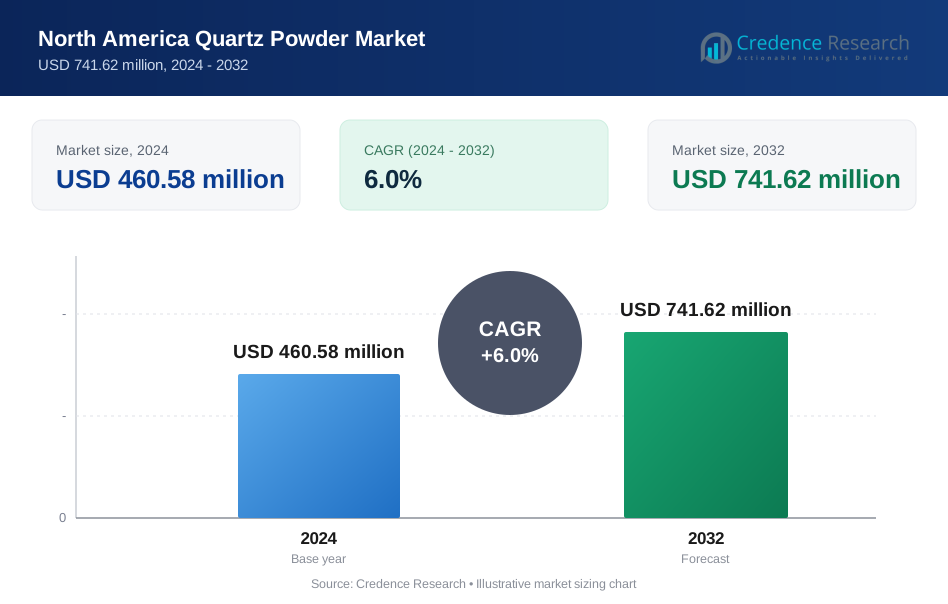
North America Quartz Powder market size was valued at USD 296.41 million in 2018 and increased to USD 460.58 million in 2024. It is anticipated to reach USD 741.62 million by 2032, growing at a CAGR of 6.0% during the forecast period.
| REPORT ATTRIBUTE | DETAILS |
|---|---|
| Historical Period | 2020-2023 |
| Base Year | 2024 |
| Forecast Period | 2025-2032 |
| North America Quartz Powder Market Size 2024 | USD 460.58 million |
| North America Quartz Powder Market, CAGR | 6.0% |
| North America Quartz Powder Market Size 2032 | USD 741.62 million |
The North America quartz powder market is dominated by major players such as Sibelco, Dow, Imerys S.A., Quarzwerke Group, and Tanvi Mines & Minerals. These companies lead through advanced purification processes, strategic partnerships, and strong distribution networks across the U.S., Canada, and Mexico. Sibelco and Imerys hold significant market positions due to their extensive product portfolios catering to electronics, solar, and glass industries. The United States remains the leading regional market with a 71% share in 2024, supported by its strong semiconductor and renewable energy sectors. Canada and Mexico follow with 19% and 10% shares respectively, reflecting growing industrial and construction activity.
Market Insights
- The North America quartz powder market was valued at USD 460.58 million in 2024 and is projected to reach USD 741.62 million by 2032, expanding at a 6.0% CAGR during the forecast period.
- Strong demand from the electronics and semiconductor industry drives market growth, supported by the rising adoption of renewable energy and photovoltaic applications.
- A key trend is the increasing shift toward ultra-high purity grades to meet the performance standards of advanced electronics and solar technologies.
- The market remains moderately consolidated, with Sibelco, Dow, Imerys S.A., and Quarzwerke Group leading through technological innovation and localized supply chain strategies.
- Regional analysis: The United States dominated with a 71% share in 2024, followed by Canada (19%) and Mexico (10%), while specialty-grade quartz accounted for the largest segment share of 52%, driven by semiconductor and solar applications.
Market Segmentation Analysis:
By Grade
The specialty grade segment dominated the North America quartz powder market in 2024 with a 52% share. Its high purity level above 99.99% makes it essential for electronics, semiconductors, and photovoltaic applications. Demand is fueled by rapid advancements in chip fabrication and solar cell production, particularly in the U.S. Specialty-grade quartz ensures minimal contamination and superior thermal stability, critical for precision manufacturing. Industrial grade follows, driven by glassmaking and ceramics industries that require consistent quality at moderate purity levels for cost-efficient large-scale production.
- For instance, Unimin Corporation, a Covia subsidiary, produces high-purity quartz exceeding 99.999% SiO₂ for semiconductor crucibles used in U.S. fabs.
By Application
The electronics and semiconductors segment held the largest share of 39% in 2024. Rising semiconductor fabrication and microelectronics demand across the U.S. and Canada support strong consumption of ultra-pure quartz powder. Its dielectric strength and thermal resistance make it ideal for silicon wafer processing and optical fiber manufacturing. The glass and ceramics segment also grows steadily, supported by architectural glass and advanced ceramics in construction. Meanwhile, paints, coatings, and adhesives show steady adoption, supported by quartz’s ability to enhance surface hardness and chemical resistance.
- For instance, Corning Incorporated uses ultra-pure silica (fused silica) in optical fiber preforms, a process the company invented. It is a global leader in the optical communications industry, producing billions of kilometers of fiber for high-speed communication networks.
Key Growth Drivers
Rising Semiconductor and Electronics Manufacturing
The growing semiconductor and electronics sector in North America is a primary driver for quartz powder demand. High-purity quartz is essential in wafer fabrication, photomasks, and crucibles used in chip production. The U.S. government’s semiconductor support programs, such as the CHIPS and Science Act, are increasing domestic production capacity. Advanced applications in 5G, AI, and data centers further expand usage in high-performance chips. Manufacturers prefer specialty-grade quartz for its superior thermal stability and low impurity content, ensuring consistent performance. This trend strengthens the region’s position as a hub for precision electronic materials.
- For instance, Intel's Arizona fab expansion utilizes high-purity quartz crucibles (99.999% ???2 or higher) for growing silicon crystals. This manufacturing infrastructure supports the production of chips using advanced nodes, including Intel 18A, for next-generation products like the Panther Lake processors.
Expanding Solar Energy Infrastructure
The rapid growth of solar energy installations across North America drives higher consumption of ultra-pure quartz powder. It is vital for producing photovoltaic cells, silicon wafers, and glass panels. The U.S. and Canada are heavily investing in renewable energy projects to meet carbon reduction targets. Quartz powder supports the production of high-efficiency solar cells with better light transmission and thermal durability. Increasing investments in utility-scale solar farms and residential rooftop installations create long-term demand. This shift toward clean energy solutions positions quartz suppliers strategically within the renewable energy value chain.
- For instance, Wacker's Charleston, Tennessee facility has an annual polysilicon production capacity of over 20,000 metric tons.
Growth in Advanced Glass and Ceramic Applications
Rising demand for advanced glass and ceramic materials in construction, automotive, and consumer electronics is fueling quartz powder usage. Its superior hardness, chemical stability, and optical clarity make it ideal for engineered glass and technical ceramics. The construction of smart buildings and the use of energy-efficient architectural glass have accelerated adoption. Automotive manufacturers are also using high-strength glass for sensors and displays in connected vehicles. The expanding electronics ceramics sector, including piezoelectric components, further enhances market prospects. The versatility of quartz across industrial and consumer applications supports steady regional growth.
Key Trend & Opportunity
Increasing Focus on Ultra-High Purity Grades
Manufacturers are shifting toward ultra-high purity quartz grades to meet the stringent requirements of electronics and solar industries. This trend reflects growing investment in refining processes that minimize trace metal contamination. Companies are adopting advanced purification technologies, including chemical leaching and plasma treatment, to achieve purity levels exceeding 99.999%. The demand from semiconductor fabs and solar cell makers is reinforcing long-term contracts with quartz suppliers. Additionally, North American companies are expanding local production to reduce dependency on imported high-purity quartz from Asia. This shift creates opportunities for technological innovation and regional supply chain stability.
- For instance, American Elements manufactures silicon-dioxide powder with a purity of 99.999% (5N) for use in solar, electronics and optical applications.
Growing Use in Emerging 5G and Optoelectronic Technologies
The rise of 5G networks and optoelectronic components is unlocking new opportunities for quartz powder. Its dielectric strength and thermal endurance make it ideal for fiber optics, sensors, and advanced communication equipment. The rollout of 5G infrastructure across the U.S. and Canada requires materials that ensure performance reliability under high-frequency transmission. Optoelectronic device manufacturing is also expanding, using quartz in laser systems and precision lenses. As data demand grows exponentially, quartz’s role in enabling high-speed connectivity and optical communication technologies continues to strengthen, supporting innovation-driven market expansion.
Key Challenges
High Production Costs for Specialty Grades
Producing specialty-grade quartz powder involves complex purification and refining processes that significantly increase operational costs. Maintaining ultra-high purity requires advanced filtration, chemical treatment, and contamination control, driving up capital expenditure. Fluctuating prices of raw quartz and energy-intensive processing also impact profit margins. Smaller manufacturers struggle to compete with established players who have integrated supply chains and advanced purification technologies. Moreover, strict quality standards in semiconductor and solar applications demand consistent output, leaving limited flexibility for cost reduction. These challenges create barriers to entry for new participants and limit price competitiveness across the market.
Supply Chain Constraints and Raw Material Dependency
The North American quartz powder market faces challenges due to limited domestic sources of high-purity quartz. Much of the raw material is imported, primarily from regions with established mining operations like Norway and Brazil. Disruptions in global logistics, trade restrictions, or geopolitical tensions can affect raw material availability and pricing. Dependence on external suppliers also impacts lead times and quality control. Local producers are investing in new mining and processing facilities to enhance self-sufficiency, but the development cycle is long and capital-intensive. These constraints pose a persistent risk to stable quartz supply for industrial applications.
Regional Analysis
United States
The United States held the largest share of 71% in the North America quartz powder market in 2024. The country’s dominance stems from its strong semiconductor, electronics, and solar energy manufacturing base. Expanding fabrication plants and government incentives under the CHIPS Act are driving high-purity quartz demand. Rapid technological adoption in renewable energy, optoelectronics, and advanced glass production further boosts market growth. Leading companies continue to invest in refining and processing capacities to ensure consistent quality and local supply reliability, solidifying the U.S. as the key growth engine of the regional quartz powder market.
Canada
Canada accounted for about 19% of the regional quartz powder market in 2024. Growth is driven by increasing use in construction materials, glass manufacturing, and renewable energy projects. The expansion of solar panel installations across provinces such as Ontario and Alberta is elevating demand for high-purity quartz in photovoltaic applications. Additionally, investments in advanced ceramics and coatings are supporting material diversification. Canada’s abundance of natural quartz reserves offers opportunities for localized processing, reducing dependence on imports. Continued infrastructure development and rising clean energy initiatives will sustain moderate market expansion through 2032.
Mexico
Mexico represented around 10% of the North America quartz powder market in 2024. The market is growing due to rising industrial manufacturing, automotive production, and construction activities. Increasing foreign investment in electronics assembly and solar energy projects is enhancing quartz powder consumption, particularly in glass and semiconductor components. The country’s proximity to U.S. production hubs supports efficient cross-border trade and supply chain integration. Government-backed infrastructure and renewable energy projects further promote the use of quartz in advanced materials. Ongoing industrialization and technology transfer from global manufacturers are expected to strengthen Mexico’s market share over time.
Market Segmentations:
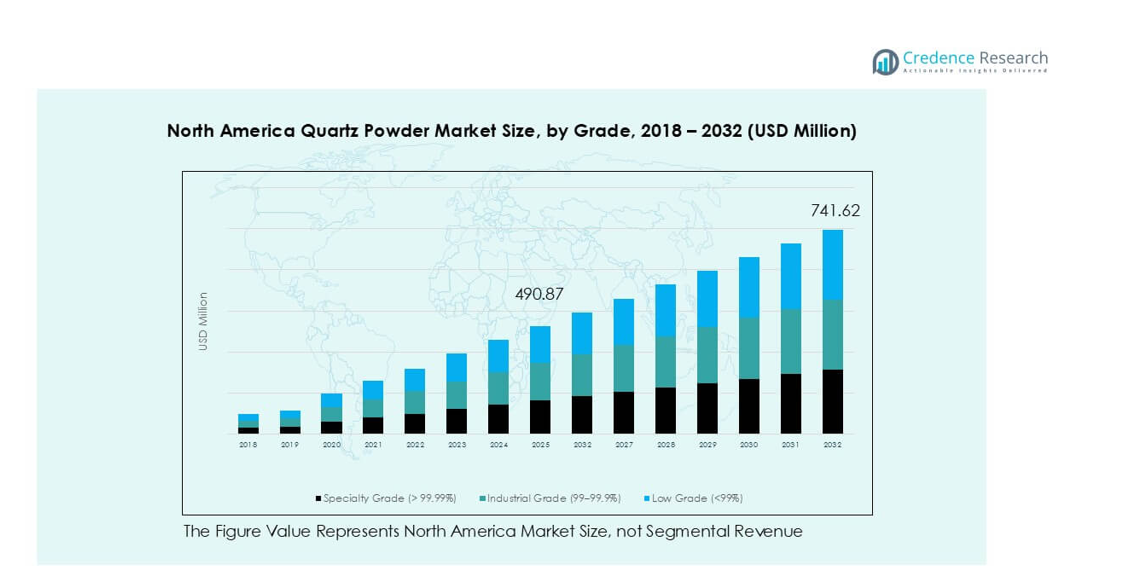
By Grade
- Specialty Grade (> 99.99%)
- Industrial Grade (99–99.9%)
- Low Grade (<99%)
By Application
- Electronics & Semiconductors
- Glass & Ceramics
- Paints, Coatings & Adhesives
- Construction Materials
- Oil and Gas
- Others
By Geography
- United States
- Canada
- Mexico
Competitive Landscape
The North America quartz powder market is moderately consolidated, with key players focusing on product purity, process optimization, and regional supply expansion. Leading companies such as Sibelco, Dow, Imerys S.A., and Quarzwerke Group dominate through advanced refining technologies and integrated mining-to-processing operations. These players emphasize high-purity grades suited for electronics, semiconductors, and solar applications. Local firms, including Tanvi Mines & Minerals and Eon Enterprises, strengthen their presence through strategic partnerships and distribution networks. Continuous investments in automation, purification efficiency, and sustainability initiatives are reshaping competition. The market also witnesses collaborations between quartz suppliers and semiconductor manufacturers to ensure long-term raw material security. Growing demand for locally sourced specialty-grade quartz and expansion in renewable energy infrastructure continue to drive competitive differentiation.
Key Player Analysis
- Tanvi Mines & Minerals
- Eon Enterprises
- Dow
- Sibelco
- The Sharad Group
- Speciality Geochem
- Quarzwerke Group
- Imerys S.A.
- PAL Quartz
- HTMC Group
- Other Key Players
Recent Developments
- In August 2024, Caesarstone introduced The Time Collection, which included ten new items, seven of which were new Porcelain colors and three Mineral Surfaces. These Mineral Surfaces represent a big step forward in surface design and are a testament to Caesarstone's latest innovation. Using its vast expertise and advanced technology, the company has developed surfaces that combine minerals like Feldspar and Quartz with recycled content to create surfaces that are better performing and better for the environment.
- In January 2023, Caesarstone Ltd. declared the launch of its line of multi-material surfaces, which includes porcelain and natural stone in addition to outdoor quartz.
- In December 2022, Kyocera Corporation announced its purpose to invest 1.3 trillion yen ($9.78 billion), or through March 2026, in novel chip component manufacturing and the evolution of other sectors of its capabilities.
Report Coverage
The research report offers an in-depth analysis based on Grade, Application and Geography. It details leading market players, providing an overview of their business, product offerings, investments, revenue streams, and key applications. Additionally, the report includes insights into the competitive environment, SWOT analysis, current market trends, as well as the primary drivers and constraints. Furthermore, it discusses various factors that have driven market expansion in recent years. The report also explores market dynamics, regulatory scenarios, and technological advancements that are shaping the industry. It assesses the impact of external factors and global economic changes on market growth. Lastly, it provides strategic recommendations for new entrants and established companies to navigate the complexities of the market.
Future Outlook
- Demand for high-purity quartz will rise with expanding semiconductor and electronics manufacturing.
- Solar energy projects will continue to boost consumption of quartz for photovoltaic applications.
- Local mining and processing capacity will grow to reduce import dependency.
- Technological advances in purification will improve product consistency and yield.
- Construction and advanced glass industries will drive steady regional demand.
- Strategic collaborations between quartz producers and chip manufacturers will increase.
- Sustainability and energy-efficient production processes will gain greater focus.
- Expansion of 5G and optical fiber networks will enhance quartz usage.
- Canada and Mexico will witness gradual market share gains through industrial development.
- Ongoing innovation in material engineering will support long-term market stability.
Request a Free Sample
Fill in your details and we'll send you a free sample report.
- Sample data tables & charts
- Research methodology
Need a Custom Version of This Report?
Tailor the scope, geography, or segments to your exact requirements.
- Custom geography or segment scope
- Direct access to our analyst team
Frequently Asked Questions
What is the current market size for the North America Quartz Powder market, and what is its projected size in 2032?
At what Compound Annual Growth Rate is the North America Quartz Powder market projected to grow between 2025 and 2032?
Which North America Quartz Powder market segment held the largest share in 2024?
What are the primary factors fueling the growth of the North America Quartz Powder market?
Who are the leading companies in the North America Quartz Powder market?
Which region commanded the largest share of the North America Quartz Powder market in 2024?
Table of Content
Chapter 1. Report Introduction
- 1.1 Report Description & Purpose
- 1.1.1 Report Title & Market Definition
- 1.1.2 Unique Selling Propositions (USP) & Key Differentiators
- 1.1.3 Value Proposition for Stakeholders
- 1.2 Research Objectives
- 1.2.1 Market Sizing Objectives (Volume & Revenue) (Volume Where Applicable)
- 1.2.2 Segmentation Objectives
- 1.2.3 Competitive Intelligence Objectives
- 1.2.4 Forecast & Scenario Objectives
- 1.3 Report Scope
- 1.3.1 North America Quartz Powder Scope – Segments & Subsegments Covered
- 1.3.2 Geographic Scope – Regions & Countries Covered
- 1.3.3 Historical Period, Base Year & Forecast Period (2024; forecast to 2032)
- 1.3.4 Inclusions & Exclusions
- 1.4 Industry Classification & Applicable Codes
- 1.5 Currency, Measurement Units & Valuation Basis
- 1.6 Target Stakeholders
- 1.7 Limitations & Assumptions
Chapter 2. Executive Summary
- 2.1 Global North America Quartz Powder Market Snapshot
- 2.1.1 Market Size – Historical (2024) & Forecast (2024-2032) (2024: USD 460.58 million → 2032: USD 741.62 million)
- 2.1.2 Volume & Revenue – Global Totals (Volume Where Applicable)
- 2.1.3 Key Market Highlights – Top Five Facts
- 2.2 North America Quartz Powder Market Segmentation Snapshot
- 2.2.1 Market Split by Region – 2024 vs. 2032
- 2.3 Competitive Snapshot
- 2.3.1 Top 10 Players by Revenue Share – 2024
- 2.3.2 Top 10 Players by Volume Share – 2024 (Volume Where Applicable)
- 2.3.3 Recent Strategic Developments (18-Month Summary)
- 2.4 Key Investment Highlights & Strategic Conclusions
Chapter 3. North America Quartz Powder Market Dynamics & Industry Analysis
- 3.1 Market Overview & Context
- 3.1.1 North America Quartz Powder Market Position in the Broader Industry Value Chain
- 3.1.2 Demand Structure & Purchasing Dynamics
- 3.1.3 Market Maturity & Development Stage by Region
- 3.2 North America Quartz Powder Market Drivers
- 3.3 North America Quartz Powder Market Restraints & Challenges
- 3.4 North America Quartz Powder Market Opportunities
- 3.5 Porter's Five Forces Analysis
- 3.5.1 Threat of New Entrants
- 3.5.2 Bargaining Power of Suppliers
- 3.5.3 Bargaining Power of Buyers
- 3.5.4 Threat of Substitutes
- 3.5.5 Competitive Rivalry – Intensity Assessment
- 3.6 North America Quartz Powder Value Chain Analysis
- 3.6.1 Upstream – Key Inputs, Resources & Suppliers
- 3.6.1.1 Key Input/Resource 1
- 3.6.1.2 Key Input/Resource 2
- 3.6.1.3 Key Input/Resource 3
- 3.6.2 Midstream – Core Operations & Value Creation
- 3.6.2.1 Operating Model & Process Overview
- 3.6.2.2 Key Operating Locations & Capabilities by Company
- 3.6.3 Downstream – Market Channels & End Users
- 3.6.3.1 Direct Sales & Customer Engagement Channels
- 3.6.3.2 Indirect Sales, Intermediaries & Partner Channels
- 3.6.4 Value Chain Profitability Analysis
- 3.6.1 Upstream – Key Inputs, Resources & Suppliers
- 3.7 PESTEL Analysis
- 3.7.1 Political Factors
- 3.7.2 Economic Factors
- 3.7.3 Social Factors
- 3.7.4 Technological Factors
- 3.7.5 Environmental Factors
- 3.7.6 Legal Factors
- 3.8 North America Quartz Powder Supply Chain Analysis
- 3.8.1 Critical Input & Resource Availability Risk Assessment
- 3.8.2 Supplier & Operational Concentration Risk (Geographic Exposure)
- 3.8.3 Supply & Service Disruption Impact Analysis
- 3.9 Regulatory & Policy Landscape
Note: The regulatory and policy landscape section covers regulations based on their applicability to the market, North America Quartz Powder category, geography, and scope of the study. Only regulatory frameworks with a material impact on operations, compliance, trade, sustainability, or market access are analyzed in detail.
Chapter 4. Key Investment Pockets & Opportunity Analysis
- 4.1 North America Quartz Powder Market Attractiveness Analysis
- 4.1.1 By Region – Investment Attractiveness Matrix (Market Size × CAGR)
- 4.2 Absolute Revenue Growth Opportunity
- 4.2.1 By Region – Absolute Revenue Growth Through 2032
- 4.3 Incremental Demand Opportunity
- 4.3.1 By Region – Incremental Demand Through 2032
- 4.3.2 Segment – Incremental Demand
- 4.4 Emerging Submarket Opportunity Deep Dive (Subject to Applicability)
- 4.5 Priority Market Opportunity Scorecards
- 4.5.1 United States
- 4.5.2 Europe
- 4.5.3 Asia
- 4.5.4 Middle East & Africa
Note: Priority market opportunity scorecards reflect the geographic scope and strategic relevance of the study. Listed markets are indicative and may be adapted to the industry.
Chapter 5. North America Quartz Powder Cross-Border Trade & Market Access Analysis
- 5.1 International Trade & Cross-Border Activity Overview
- 5.1.1 Global Export Value by Country (2024)
- 5.1.2 Global Export Volume by Country (2024) (Volume Where Applicable)
- 5.1.3 Global Import Value by Country (2024)
- 5.1.4 Global Import Volume by Country (2024) (Volume Where Applicable)
- 5.1.5 Net Trade Balance by Country (2024)
- 5.2 Export Analysis – Segment
- 5.2.1 Category 1 (Applicable Classification Code)
- 5.2.2 Category 2 (Applicable Classification Code)
- 5.2.3 Category 3 (Applicable Classification Code)
- 5.2.4 Category 4 (Applicable Classification Code)
- 5.2.5 Category 5 (Applicable Classification Code)
- 5.3 Import Analysis – Segment
- 5.3.1 Category 1 (Applicable Classification Code)
- 5.3.2 Category 2 (Applicable Classification Code)
- 5.3.3 Category 3 (Applicable Classification Code)
- 5.3.4 Category 4 (Applicable Classification Code)
- 5.3.5 Category 5 (Applicable Classification Code)
- 5.4 Cross-Border Pricing & Transaction Benchmarks
- 5.4.1 Export Pricing – Segment & Country
- 5.4.2 Import Pricing – Segment & Source Country
- 5.4.3 Price Trends (2024)
- 5.5 Key Cross-Border Trade & Delivery Routes
- 5.5.1 Cross-Border Trade/Delivery Route 1
- 5.5.2 Cross-Border Trade/Delivery Route 2
- 5.5.3 Cross-Border Trade/Delivery Route 3
- 5.5.4 Cross-Border Trade/Delivery Route 4
- 5.5.5 Cross-Border Trade/Delivery Route 5
- 5.6 Trade Policy & Market Access Impact Assessment
- 5.6.1 Tariff & Non-Tariff Barriers
- 5.6.2 Regional Trade & Economic Integration Frameworks
- 5.6.3 Bilateral & Multilateral Trade Agreements
- 5.6.4 Cross-Border Operating, Licensing & Localization Requirements
Note: This chapter applies where cross-border trade or delivery is relevant to North America Quartz Powder. Goods, services, and digital offerings are assessed using applicable classifications and transaction measures. Import-export volumes, trade balances, and route analyses are included only where meaningful to the market.
Chapter 6. Competitive Landscape & Company Benchmarking
- 6.1 North America Quartz Powder Market Concentration & Structure
- 6.1.1 Herfindahl-Hirschman Index (HHI) – vs. 2024
- 6.1.2 Leading, Mid-Sized & Emerging Player Structure
- 6.1.3 Global, Regional & Local Player Dynamics
- 6.2 North America Quartz Powder Market Share Analysis – 2024
- 6.2.1 Global Revenue Share by Company
- 6.2.2 Global Volume Share by Company (Volume Where Applicable)
- 6.2.3 Regional Revenue Share
- 6.2.4 Market Share Evolution ( vs. 2024)
- 6.2.5 Company Market Share by Key Segment
- 6.2.6 Company Market Share by Customer Group
- 6.3 Operating Scale, Capacity & Infrastructure Analysis
- 6.3.1 Global Operating Scale & Supply Capacity
- 6.3.2 Resource Utilization & Operating Efficiency
- 6.3.3 Output, Service Delivery & Activity Metrics
- 6.3.4 Operating Footprint & Infrastructure Map
- 6.3.5 Planned Operational & Capacity Expansion
- 6.4 North America Quartz Powder Competitive Benchmarking Matrix
- 6.4.1 Revenue, Growth, Profitability & Operating Metric Comparison
- 6.4.2 Channel Revenue Mix
- 6.4.3 Geographic Revenue Exposure
- 6.4.4 R&D Intensity
- 6.4.5 Sustainability Maturity
- 6.5 Strategic Developments in North America Quartz Powder (Last 24 Months)
- 6.5.1 Mergers, Acquisitions & Divestments
- 6.5.2 New Products, Services & Solutions in North America Quartz Powder
- 6.5.3 Operational & Infrastructure Expansions
- 6.5.4 Strategic Alliances, Joint Ventures & Partnerships
- 6.5.5 Distribution Expansion & Market Entry
- 6.5.6 Sustainability & ESG Initiatives
- 6.6 Competitive Strategy Mapping
- 6.6.1 Leader, Challenger, Follower & Niche Classification
- 6.6.2 Pricing Strategy Comparison
- 6.6.3 Channel Strategy Matrix
Note: Strategic developments are included based on their materiality and the availability of reliable information.
Chapter 7. Global North America Quartz Powder Market – By Sales & Delivery Channel
- 7.1 Segment Overview
- 7.1.1 Volume & Revenue Split by Channel (2024 & 2032) (Volume Where Applicable)
- 7.1.2 Channel Mix Evolution (2024-2032)
Chapter 8. Regional Market Analysis – Global Overview
- 8.1 Global Regional Overview
- 8.1.1 Regional Volume Share (Volume Where Applicable)
- 8.1.2 Regional Revenue Share
- 8.1.3 Regional Volume by Region (Volume Where Applicable)
- 8.1.4 Regional Revenue by Region
- 8.1.5 Regional Forecast Through 2032
- 8.2 Cross-Regional Segment Analysis
- 8.2.1 By Sales & Delivery Channel
- 8.2.2 By Competitive Positioning & Price Tier
Chapter 9. North America North America Quartz Powder Market
- 9.1 United States
- 9.2 Canada
- 9.3 Mexico
Chapter 10. Europe North America Quartz Powder Market
- 10.1 Germany
- 10.2 France
- 10.3 Italy
- 10.4 United Kingdom
- 10.5 Spain
- 10.6 Poland
- 10.7 Russia
- 10.8 Netherlands
- 10.9 Belgium
- 10.10 Sweden
- 10.11 Denmark
- 10.12 Norway
- 10.13 Rest of Europe
Chapter 11. Asia Pacific North America Quartz Powder Market
- 11.1 China
- 11.2 India
- 11.3 Japan
- 11.4 South Korea
- 11.5 Thailand
- 11.6 Indonesia
- 11.7 Vietnam
- 11.8 Malaysia
- 11.9 Australia
- 11.10 Rest of Asia Pacific
Chapter 12. Latin America North America Quartz Powder Market
- 12.1 Brazil
- 12.2 Argentina
- 12.3 Colombia
- 12.4 Chile
- 12.5 Rest of Latin America
Chapter 13. Middle East North America Quartz Powder Market
- 13.1 Saudi Arabia
- 13.2 United Arab Emirates
- 13.3 Turkey
- 13.4 Israel
- 13.5 Iran
- 13.6 Rest of the Middle East
Chapter 14. Africa North America Quartz Powder Market
- 14.1 South Africa
- 14.2 Egypt
- 14.3 Nigeria
- 14.4 Morocco
- 14.5 Rest of Africa
Chapter 15. North America Quartz Powder Company Profiles
- 15.1 [Company 01]
- 15.1.1 Company Overview
- 15.1.2 Key Management Personnel
- 15.1.3 Products & Services Portfolio
- 15.1.4 Financial Performance
- 15.1.5 Key Market Focus & Geographic Presence
- 15.1.6 Recent Developments & Strategic Initiatives
Note: The company profile list is preliminary and may change based on research findings, market developments, data availability, and client requirements.
Chapter 16. Appendices
- Appendix A – List of Abbreviations & Acronyms
- Appendix B – Industry Classification Code Reference – Full Series
- Appendix C – Supply, Output & Operating Capacity Data Tables
- Appendix D – End-Use & Demand Base Tables
- Appendix E – Demand, Adoption & Usage Assumptions
- Appendix F – Pricing & Revenue Metric Reference Tables
- Appendix G – Company Operations & Infrastructure Database
- Appendix H – Cross-Border Trade & Activity Data Tables (Where Applicable)
- Appendix I – Regulatory Summary Tables
- Appendix J – Primary Research Participant List (Anonymized)
- Appendix K – Primary Research Questionnaire Framework
- Appendix L – Data Sources & Bibliography
- Appendix M – Market Size Divergence & Source Comparison
Chapter 17. Research Methodology
- 17.1 Research Framework & Philosophy
- 17.2 Secondary Research – Sources, Hierarchy & Data Extraction
- 17.3 Data Modeling – Bottom-Up & Top-Down Market Sizing
- 17.4 Primary Research – Stakeholder Framework, LOI & Sample Sizes
- 17.5 Forecast Methodology – Regression, Scenario & Sensitivity Analysis
- 17.6 Quality Control – Four-Layer Validation Framework
- 17.7 Limitations & Standard Assumptions
- 17.8 Disclaimer
