
Market Overview
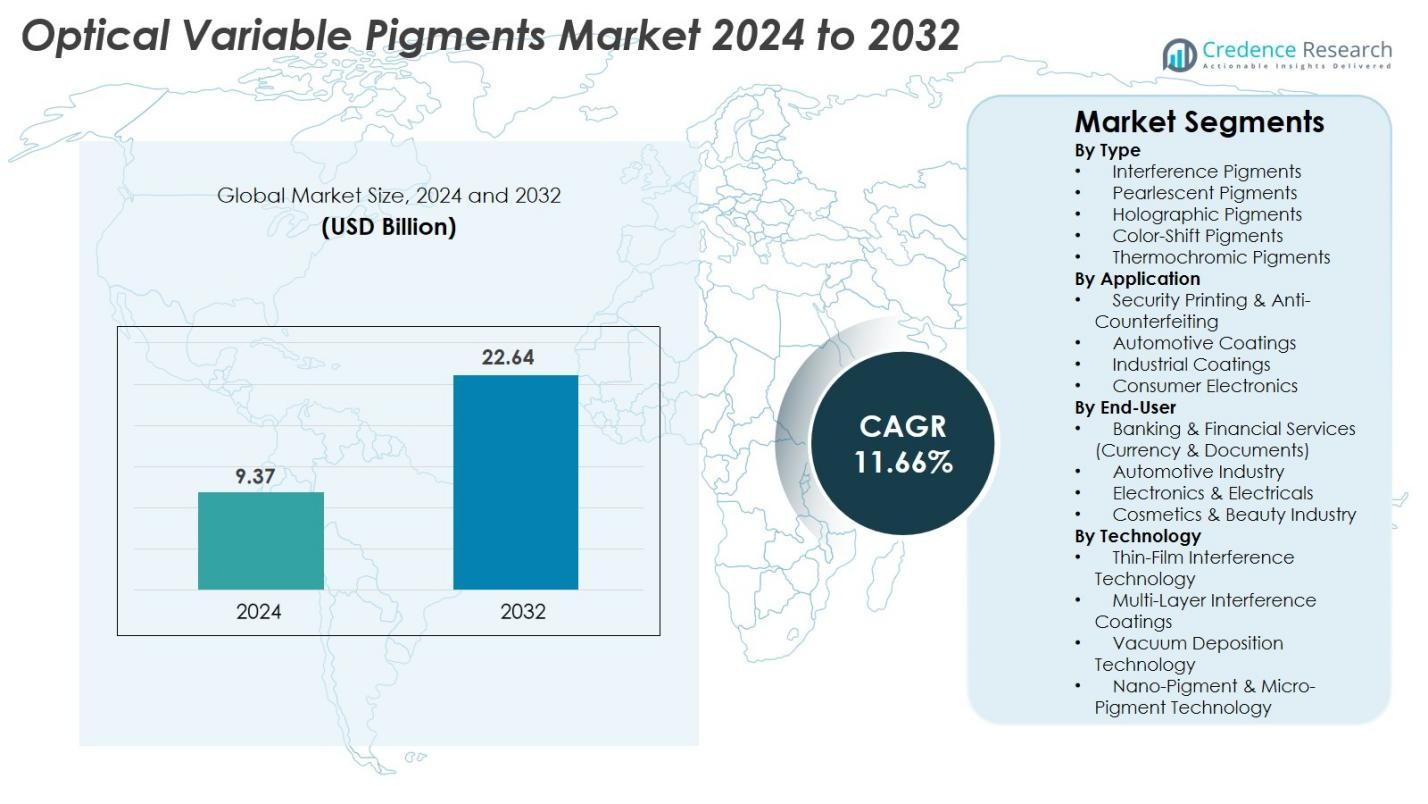
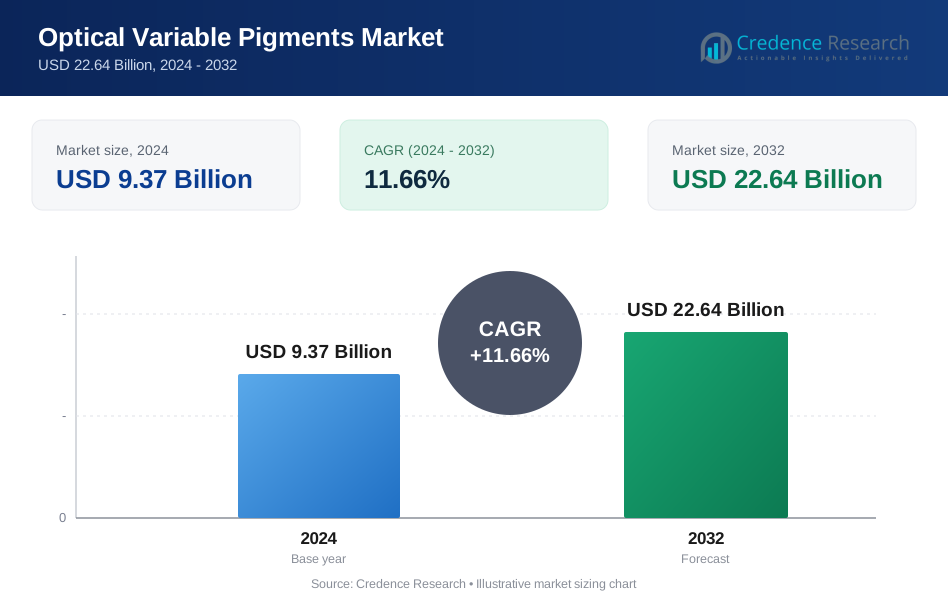
Optical Variable Pigments Market size was valued at USD 9.37 Billion in 2024 and is anticipated to reach USD 22.64 Billion by 2032, at a CAGR of 11.66% during the forecast period.
| REPORT ATTRIBUTE | DETAILS |
|---|---|
| Historical Period | 2020-2023 |
| Base Year | 2024 |
| Forecast Period | 2025-2032 |
| Optical Variable Pigments Market Size 2024 | USD 9.37 Billion |
| Optical Variable Pigments Market, CAGR | 11.66% |
| Optical Variable Pigments Market Size 2032 | USD 22.64 Billion |
Optical Variable Pigments Market is driven by strong participation from leading players such as BASF SE, Merck KGaA, DIC Corporation, Altana AG, Sun Chemical Corporation, Toyo Ink Co. Ltd, Flint Group, Huber Group, Clariant International Ltd, Nemoto & Co. Ltd, Geotech International B.V., JDS Uniphase Corporation, Viavi Solutions Inc., and Vanceva Color Solutions. These companies focus on advanced interference, holographic, and color-shift pigment technologies to serve security printing, automotive coatings, and premium packaging applications. Regionally, Asia-Pacific leads the market with a 32.7% share, supported by large-scale electronics and automotive production, followed by North America at 28.6% and Europe at 26.4%, driven by strong regulatory adoption and high-value manufacturing.
Market Insights
- Optical Variable Pigments Market was valued at USD 9.37 Billion in 2024 and is projected to reach USD 22.64 Billion by 2032, registering a CAGR of 11.66%.
- Market growth is driven by rising demand for anti-counterfeiting solutions in security printing, with interference pigments holding the largest 38.4% share due to their strong adoption in currency protection, premium packaging, and automotive coatings.
- Key trends include increasing integration of holographic and color-shift pigments in cosmetics, electronics, and luxury goods, supported by advancements in nanotechnology and premium aesthetic finishes.
- The market features active participation from major players such as BASF SE, Merck KGaA, DIC Corporation, Altana AG, Sun Chemical, and Viavi Solutions, focusing on innovation, high-security pigments, and expansion into emerging economies.
- Asia-Pacific leads with a 32.7% regional share, followed by North America at 28.6% and Europe at 26.4%, reflecting strong manufacturing bases and regulatory emphasis on security-grade pigments.
Market Segmentation Analysis
By Type
The Optical Variable Pigments Market by type is dominated by interference pigments, accounting for 38.4% share in 2024 due to their strong demand in high-security printing, premium packaging, and automotive finishes. These pigments offer precise color-shifting effects driven by thin-film interference technology, making them highly effective for anti-counterfeiting and aesthetic enhancement. Pearlescent pigments and color-shift pigments follow, supported by rising use in cosmetics and electronics. Holographic pigments are gaining traction with the growth of smart labels and brand authentication, while thermochromic pigments benefit from increasing adoption in temperature-sensitive coatings.
- For instance, OVD Kinegram developed its KINEGRAM® security foil technology featuring multi-layer interference coatings with more than 2,000 nano-structured lines per millimeter, enabling highly precise optical shifts used in over 100 national ID and passport programs.
By Application
In terms of application, security printing and anti-counterfeiting leads the Optical Variable Pigments Market with a 42.7% share in 2024, driven by stringent global regulations for currency protection, brand security, and document authentication. Governments and enterprises increasingly adopt OVP-enabled inks for banknotes, tax stamps, identity cards, and high-value product labels. Automotive coatings emerge as a fast-growing segment owing to rising demand for premium finishes and color-shifting exteriors. Industrial coatings and consumer electronics also exhibit growth supported by the need for visual differentiation, advanced aesthetics, and enhanced product protection.
- For instance, PPG’s Andaro® Xirallic® automotive pigments use high-purity aluminum oxide platelets measuring 1-3 microns in thickness, enabling deep chromatic effects used in OEM coatings for multiple global car models.
By End-Use Industry
Across end-use industries, banking and financial services (currency and documents) holds the dominant position with a 39.8% share in 2024, supported by central banks' adoption of color-shifting security pigments for banknotes and official documents. The automotive industry follows, benefiting from increasing use of high-impact color-transition coatings in premium vehicle segments. Electronics and electricals register strong growth as manufacturers integrate OVP effects into casings and device surfaces. The cosmetics and beauty industry continues to expand usage due to rising consumer preference for iridescent, metallic, and high-visibility pigment effects in makeup and packaging.
Key Growth Drivers
Growing Demand for Anti-Counterfeiting Solutions
The Optical Variable Pigments market is experiencing strong growth due to the heightened global focus on anti-counterfeiting measures across banking, consumer goods, pharmaceuticals, and official documents. Governments and central banks increasingly adopt OVP-enabled inks and coatings to protect currencies, tax stamps, and identity documents, as color-shifting effects are extremely difficult to replicate. With counterfeit activities rising in sectors such as cosmetics, automotive parts, and electronics, brand owners are investing heavily in advanced pigment technologies that offer multi-angle color transitions and high-security authentication. OVPs also support machine-readable features, enhancing multilayer security architecture for premium products. The expansion of global trade has further amplified the need for robust product protection solutions, and industries now view optical pigments as a critical preventive tool rather than an optional enhancement. This sustained demand for authentication technologies continues to reinforce OVP adoption and drives market expansion worldwide.
- For instance, Covestro’s Bayfol® HX holographic film incorporates microstructures with a spatial frequency reaching 3,000 lines per millimeter, enabling complex 3D depth effects widely used in premium brand protection labels.
Increasing Use of Premium Aesthetic Pigments in Automotive and Consumer Electronics
The automotive and consumer electronics industries are key contributors to the growth of Optical Variable Pigments, driven by the rising adoption of color-shifting, pearlescent, and interference effects in high-value product designs. Automakers increasingly integrate OVP-based coatings to differentiate premium models, enhance surface depth, and deliver dynamic multi-angle visual effects that appeal to luxury buyers. Simultaneously, electronics manufacturers are using these pigments in smartphone casings, laptops, and wearable devices to create visually striking finishes that stand out in competitive markets. Consumers associate OVP-enhanced finishes with innovation, style, and product quality, reinforcing demand in high-growth regions such as Asia-Pacific and Europe. The surge in electric vehicle production and the rapid introduction of limited-edition electronic devices further expand opportunities. As brands intensify emphasis on surface aesthetics and experiential design, optical pigments continue to play a central role in elevating product identity and market positioning.
- For instance, Toyota’s structural color research uses micro-structured surfaces with periodic dimensions around 300 nanometers, eliminating conventional pigments and producing angle-dependent blue and green shifts tested on Lexus concept models.
Rapid Adoption of Advanced Pigment Technologies in Packaging and Branding
Packaging has emerged as one of the fastest-growing application areas for Optical Variable Pigments due to rising demand for visually enhanced, secure, and premium packaging solutions. Brands across cosmetics, beverages, luxury goods, and FMCG incorporate OVP-based inks and coatings to elevate visual appeal and strengthen brand differentiation. Beyond aesthetics, OVPs support anti-tampering features, making them increasingly relevant for pharmaceuticals, nutraceuticals, and high-value consumer goods. The shift toward digital retail and shelf-intense product competition has pushed companies to invest in pigments that create holographic, iridescent, or multi-tone effects that capture consumer attention. Additionally, the growth of sustainability-driven packaging encourages the use of OVPs that blend advanced visual features with eco-friendly formulations. As brands seek premiumization and authentication simultaneously, optical pigments deliver an ideal combination of functionality and aesthetics, driving widespread market adoption.
Key Trends & Opportunities
Integration of Nanotechnology and Smart Pigments in High-Performance Coatings
A major trend reshaping the Optical Variable Pigments market is the integration of nanotechnology to create ultra-fine, high-performance pigments with improved color intensity, durability, and stability. Nanostructured OVPs allow manufacturers to achieve more precise optical effects, including sharper color transitions and enhanced luminosity, which are increasingly sought after in automotive coatings, luxury packaging, and electronics. These advanced pigments also enable improved heat resistance, UV stability, and surface adhesion-key requirements for premium and outdoor applications. The industry is also witnessing growing opportunities in “smart pigments,” such as thermochromic and photochromic variants, which respond dynamically to temperature or light exposure. These smart functionalities open new avenues in safety indicators, smart textiles, and energy-efficient building materials. As manufacturers shift toward next-generation high-performance coatings, nanotechnology-based OVPs are positioning themselves as a transformative opportunity for future product innovation.
- For instance, Eckart’s Luxan® FX series incorporates ultra-thin glass flakes with thicknesses controlled at 400-800 nanometers, providing high thermal stability suitable for exterior automotive and industrial coatings.
Expansion of OVP Applications in Cosmetics and Fashion Industries
The cosmetics and fashion sectors present significant opportunities for OVP manufacturers, driven by the rising popularity of iridescent, holographic, and multi-chromatic visual effects in makeup, nail products, skincare packaging, and apparel. Beauty brands increasingly adopt optical pigments to create high-impact finishes that align with trends in shimmer-based formulations, bold color expressions, and visually immersive cosmetic designs. OVPs support unique surface effects that enhance consumer appeal, especially in premium and celebrity-endorsed cosmetic lines. In the fashion industry, the integration of OVP-coated fabrics and accessories is accelerating, fueled by the growing demand for futuristic, color-transforming materials in apparel, handbags, and footwear. With social media amplifying visual trends and consumers gravitating toward expressive aesthetics, the use of OVPs in beauty and fashion continues to expand rapidly, presenting long-term opportunities for pigment producers.
- For instance, Merck’s Ronastar® Blue Lights pigment uses ultra-smooth mica substrates coated with titanium dioxide layers between 50 and 120 nanometers, producing vibrant iridescent effects that are widely incorporated into premium eye and lip formulations.
Key Challenges
High Production Costs and Complex Manufacturing Processes
The Optical Variable Pigments market faces a significant challenge in the form of high production costs, mainly due to complex manufacturing processes involving multi-layer thin-film deposition, vacuum technologies, and precision control systems. These processes require specialized equipment and highly skilled technicians, increasing both capital and operational expenses for manufacturers. As a result, OVPs are priced higher than conventional pigments, limiting their adoption in cost-sensitive industries such as basic packaging and mass-produced consumer goods. Additionally, the procurement of raw materials, including high-purity metal oxides and advanced interference substrates, adds to overall cost pressures. Small and mid-sized brands often struggle to justify investment in OVP-based solutions despite their benefits. The market must address the challenge of cost reduction through scalable production technologies and material innovations to support broader adoption across industries.
Stringent Regulatory Standards and Environmental Compliance Issues
Compliance with stringent environmental and safety regulations poses another major challenge to the Optical Variable Pigments market. Many OVP formulations involve metal oxides, solvents, and specialty chemicals that fall under strict regulatory scrutiny, especially in regions such as Europe and North America. Manufacturers must meet demanding standards related to VOC emissions, heavy metal restrictions, and safe pigment disposal, leading to increased compliance costs and the need for continuous reformulation. Additionally, the push for sustainable and eco-friendly pigments requires companies to invest in research and adopt greener manufacturing processes. This transition can be slow and resource-intensive, particularly for smaller producers. Failure to meet evolving regulatory requirements may restrict market access, especially in sensitive industries such as cosmetics, food packaging, and pharmaceuticals, positioning regulatory pressure as a long-term challenge for OVP manufacturers.
Regional Analysis
North America North America holds a significant position in the Optical Variable Pigments Market, accounting for 28.6% share in 2024, driven by strong demand from security printing, automotive coatings, and high-value consumer electronics. The U.S. leads regional growth due to federal adoption of advanced anti-counterfeiting technologies for currency, tax stamps, and identity documents. The presence of major pigment manufacturers and ongoing innovation in multi-layer thin-film interference technologies also support market expansion. Increasing demand for premium packaging in cosmetics and luxury goods further enhances the adoption of optical pigments across the region.
Europe
Europe commands 26.4% of the Optical Variable Pigments Market in 2024, supported by stringent regulatory frameworks promoting advanced security printing and environmentally compliant pigment formulations. Germany, France, and the U.K. remain key contributors, driven by strong automotive production, thriving cosmetic brands, and robust demand for anti-counterfeiting solutions. The region’s early adoption of premium coatings and holographic technologies strengthens its market presence. Additionally, Europe’s focus on sustainable pigment manufacturing encourages the development of eco-friendly OVP solutions, accelerating adoption across packaging, industrial coatings, and specialty inks.
Asia-Pacific
Asia-Pacific leads the global Optical Variable Pigments Market with a dominant 32.7% share in 2024, supported by rapid industrialization, large-scale manufacturing, and expanding automotive and electronics industries. China, Japan, South Korea, and India are major growth centers due to rising production of smartphones, electric vehicles, and premium packaging goods that integrate high-impact optical effects. Government investments in currency security and brand protection measures also boost market adoption. Growing cosmetic consumption and increasing brand competition further accelerate demand for holographic and color-shifting pigments across consumer-centric industries in the region.
Latin America
Latin America accounts for 6.8% share of the Optical Variable Pigments Market in 2024, showing steady growth driven by increased adoption of security printing technologies for official documents, tax stamps, and high-value consumer products. Brazil and Mexico lead regional demand due to expanding automotive manufacturing and rising need for protective packaging in pharmaceuticals and cosmetics. The region’s growing emphasis on counterfeiting prevention in FMCG and consumer electronics fuels interest in holographic and interference pigments. Although adoption remains cost-sensitive, expanding industrial production creates long-term opportunities for OVP integration.
Middle East & Africa
The Middle East & Africa region holds 5.5% share in 2024, with growth supported by government-led initiatives to enhance document security and reduce counterfeiting in currency, passports, and excise labels. The UAE, Saudi Arabia, and South Africa drive regional demand through expanding automotive refinishing, luxury packaging, and electronics imports requiring enhanced visual appeal. Increasing investment in premium consumer goods and security authentication solutions also supports the adoption of optical variable pigments. While market penetration is still developing, rising regulatory emphasis on anti-counterfeiting strengthens future demand potential.
Market Segmentations
By Type
- Interference Pigments
- Pearlescent Pigments
- Holographic Pigments
- Color-Shift Pigments
- Thermochromic Pigments
By Application
- Security Printing & Anti-Counterfeiting
- Automotive Coatings
- Industrial Coatings
- Consumer Electronics
By End-User
- Banking & Financial Services (Currency & Documents)
- Automotive Industry
- Electronics & Electricals
- Cosmetics & Beauty Industry
By Technology
- Thin-Film Interference Technology
- Multi-Layer Interference Coatings
- Vacuum Deposition Technology
- Nano-Pigment & Micro-Pigment Technology
By Geography
- North America
- U.S.
- Canada
- Mexico
- Europe
- Germany
- France
- U.K.
- Italy
- Spain
- Rest of Europe
- Asia Pacific
- China
- Japan
- India
- South Korea
- South-east Asia
- Rest of Asia Pacific
- Latin America
- Brazil
- Argentina
- Rest of Latin America
- Middle East & Africa
- GCC Countries
- South Africa
- Rest of the Middle East and Africa
Competitive Landscape
The competitive landscape of the Optical Variable Pigments Market is characterized by the strong presence of global players focusing on advanced pigment technologies, security solutions, and premium coatings. Key companies such as BASF SE, Merck KGaA, DIC Corporation, Altana AG, Sun Chemical Corporation, Toyo Ink Co. Ltd, Flint Group, Huber Group, Clariant International Ltd, Nemoto & Co. Ltd, Geotech International B.V., JDS Uniphase Corporation, Viavi Solutions Inc., and Vanceva Color Solutions actively strengthen their portfolios through innovation, product customization, and security-grade pigment development. These companies emphasize high-performance interference, holographic, and color-shift pigments designed for anti-counterfeiting, automotive finishes, and luxury packaging. Strategic partnerships with printing technology providers, investments in nanotechnology-based pigments, and expansion into emerging economies further intensify competition. With rising demand for secure and visually appealing coatings, players continue to differentiate through technological expertise, sustainability-oriented formulations, and enhanced application versatility across multiple industries.
Key Player Analysis
- Nemoto & Co Ltd
- Sun Chemical Corporation
- Clariant International Ltd
- Toyo Ink Co Ltd
- Merck KGaA
- Altana AG
- Viavi Solutions, Inc.
- Huber Group
- DIC Corporation
- BASF SE
Recent Developments
- In March 2025, BASF’s Coatings unit published that in the EMEA region the share of achromatic automotive colours rose from 72% in 2021 to nearly 80% in 2024, a trend enabled by advanced optical and effect-pigments including OVP-type interference pigments.
- In October 2024, BASF SE unveiled its new “ROUTING 2024-2025 Automotive Colour Trends” collection, which emphasised advanced interference pigments (a category of OVPs) in new multi-dimensional red and purple tones and highlighted sustainability via renewable, recycled and bio-based raw materials.
Report Coverage
The research report offers an in-depth analysis based on Type, Application, End-User, Technology and Geography. It details leading market players, providing an overview of their business, product offerings, investments, revenue streams, and key applications. Additionally, the report includes insights into the competitive environment, SWOT analysis, current market trends, as well as the primary drivers and constraints. Furthermore, it discusses various factors that have driven market expansion in recent years. The report also explores market dynamics, regulatory scenarios, and technological advancements that are shaping the industry. It assesses the impact of external factors and global economic changes on market growth. Lastly, it provides strategic recommendations for new entrants and established companies to navigate the complexities of the market.
Future Outlook
- The market will witness strong growth as demand for advanced anti-counterfeiting technologies continues to expand across currencies, tax stamps, and branded products.
- Adoption of color-shift and interference pigments will rise in automotive coatings due to increasing preference for premium and dynamic surface finishes.
- Cosmetics and personal care brands will increasingly integrate iridescent and holographic pigments to enhance visual appeal and product differentiation.
- Technological advancements in nanostructured pigments will improve color intensity, durability, and multi-angle visual effects.
- Sustainable and environmentally compliant pigment formulations will gain traction as regulations tighten across major markets.
- Consumer electronics manufacturers will adopt OVPs at a faster pace to create visually striking device casings and premium finishes.
- Expansion of luxury packaging and premium FMCG products will accelerate the use of multi-chromatic pigments.
- Security printing applications will remain the largest revenue contributor due to rising global counterfeiting threats.
- Emerging economies will experience increased demand as manufacturing activity and export-oriented industries grow.
- Partnerships between pigment manufacturers and printing technology companies will strengthen innovation and market penetration.
Request a Free Sample
Fill in your details and we'll send you a free sample report.
- Sample data tables & charts
- Research methodology
Need a Custom Version of This Report?
Tailor the scope, geography, or segments to your exact requirements.
- Custom geography or segment scope
- Direct access to our analyst team
Frequently Asked Questions
What is the current market size for Optical Variable Pigments Market, and what is its projected size in 2032?
At what Compound Annual Growth Rate is the Optical Variable Pigments Market projected to grow between 2025 and 2032?
Which Optical Variable Pigments Market segment held the largest share in 2024?
What are the primary factors fueling the growth of the Optical Variable Pigments Market?
Who are the leading companies in the Optical Variable Pigments Market?
Which region commanded the largest share of the Optical Variable Pigments Market in 2024?
Table of Content
Chapter 1. Report Introduction
- 1.1 Report Description & Purpose
- 1.1.1 Report Title & Market Definition
- 1.1.2 Unique Selling Propositions (USP) & Key Differentiators
- 1.1.3 Value Proposition for Stakeholders
- 1.2 Research Objectives
- 1.2.1 Market Sizing Objectives (Volume & Revenue) (Volume Where Applicable)
- 1.2.2 Segmentation Objectives
- 1.2.3 Competitive Intelligence Objectives
- 1.2.4 Forecast & Scenario Objectives
- 1.3 Report Scope
- 1.3.1 Optical Variable Pigments Scope – Segments & Subsegments Covered
- 1.3.2 Geographic Scope – Regions & Countries Covered
- 1.3.3 Historical Period, Base Year & Forecast Period (2024; forecast to 2032)
- 1.3.4 Inclusions & Exclusions
- 1.4 Industry Classification & Applicable Codes
- 1.5 Currency, Measurement Units & Valuation Basis
- 1.6 Target Stakeholders
- 1.7 Limitations & Assumptions
Chapter 2. Executive Summary
- 2.1 Global Optical Variable Pigments Market Snapshot
- 2.1.1 Market Size – Historical (2024) & Forecast (2024-2032) (2024: USD 9.37 Billion → 2032: USD 22.64 Billion)
- 2.1.2 Volume & Revenue – Global Totals (Volume Where Applicable)
- 2.1.3 Key Market Highlights – Top Five Facts
- 2.2 Optical Variable Pigments Market Segmentation Snapshot
- 2.2.1 Market Split by Region – 2024 vs. 2032
- 2.3 Competitive Snapshot
- 2.3.1 Top 10 Players by Revenue Share – 2024
- 2.3.2 Top 10 Players by Volume Share – 2024 (Volume Where Applicable)
- 2.3.3 Recent Strategic Developments (18-Month Summary)
- 2.4 Key Investment Highlights & Strategic Conclusions
Chapter 3. Optical Variable Pigments Market Dynamics & Industry Analysis
- 3.1 Market Overview & Context
- 3.1.1 Optical Variable Pigments Market Position in the Broader Industry Value Chain
- 3.1.2 Demand Structure & Purchasing Dynamics
- 3.1.3 Market Maturity & Development Stage by Region
- 3.2 Optical Variable Pigments Market Drivers
- 3.3 Optical Variable Pigments Market Restraints & Challenges
- 3.4 Optical Variable Pigments Market Opportunities
- 3.5 Porter's Five Forces Analysis
- 3.5.1 Threat of New Entrants
- 3.5.2 Bargaining Power of Suppliers
- 3.5.3 Bargaining Power of Buyers
- 3.5.4 Threat of Substitutes
- 3.5.5 Competitive Rivalry – Intensity Assessment
- 3.6 Optical Variable Pigments Value Chain Analysis
- 3.6.1 Upstream – Key Inputs, Resources & Suppliers
- 3.6.1.1 Key Input/Resource 1
- 3.6.1.2 Key Input/Resource 2
- 3.6.1.3 Key Input/Resource 3
- 3.6.2 Midstream – Core Operations & Value Creation
- 3.6.2.1 Operating Model & Process Overview
- 3.6.2.2 Key Operating Locations & Capabilities by Company
- 3.6.3 Downstream – Market Channels & End Users
- 3.6.3.1 Direct Sales & Customer Engagement Channels
- 3.6.3.2 Indirect Sales, Intermediaries & Partner Channels
- 3.6.4 Value Chain Profitability Analysis
- 3.6.1 Upstream – Key Inputs, Resources & Suppliers
- 3.7 PESTEL Analysis
- 3.7.1 Political Factors
- 3.7.2 Economic Factors
- 3.7.3 Social Factors
- 3.7.4 Technological Factors
- 3.7.5 Environmental Factors
- 3.7.6 Legal Factors
- 3.8 Optical Variable Pigments Supply Chain Analysis
- 3.8.1 Critical Input & Resource Availability Risk Assessment
- 3.8.2 Supplier & Operational Concentration Risk (Geographic Exposure)
- 3.8.3 Supply & Service Disruption Impact Analysis
- 3.9 Regulatory & Policy Landscape
Note: The regulatory and policy landscape section covers regulations based on their applicability to the market, Optical Variable Pigments category, geography, and scope of the study. Only regulatory frameworks with a material impact on operations, compliance, trade, sustainability, or market access are analyzed in detail.
Chapter 4. Key Investment Pockets & Opportunity Analysis
- 4.1 Optical Variable Pigments Market Attractiveness Analysis
- 4.1.1 By Region – Investment Attractiveness Matrix (Market Size × CAGR)
- 4.2 Absolute Revenue Growth Opportunity
- 4.2.1 By Region – Absolute Revenue Growth Through 2032
- 4.3 Incremental Demand Opportunity
- 4.3.1 By Region – Incremental Demand Through 2032
- 4.3.2 Segment – Incremental Demand
- 4.4 Emerging Submarket Opportunity Deep Dive (Subject to Applicability)
- 4.5 Priority Market Opportunity Scorecards
- 4.5.1 United States
- 4.5.2 Europe
- 4.5.3 Asia
- 4.5.4 Middle East & Africa
Note: Priority market opportunity scorecards reflect the geographic scope and strategic relevance of the study. Listed markets are indicative and may be adapted to the industry.
Chapter 5. Optical Variable Pigments Cross-Border Trade & Market Access Analysis
- 5.1 International Trade & Cross-Border Activity Overview
- 5.1.1 Global Export Value by Country (2024)
- 5.1.2 Global Export Volume by Country (2024) (Volume Where Applicable)
- 5.1.3 Global Import Value by Country (2024)
- 5.1.4 Global Import Volume by Country (2024) (Volume Where Applicable)
- 5.1.5 Net Trade Balance by Country (2024)
- 5.2 Export Analysis – Segment
- 5.2.1 Category 1 (Applicable Classification Code)
- 5.2.2 Category 2 (Applicable Classification Code)
- 5.2.3 Category 3 (Applicable Classification Code)
- 5.2.4 Category 4 (Applicable Classification Code)
- 5.2.5 Category 5 (Applicable Classification Code)
- 5.3 Import Analysis – Segment
- 5.3.1 Category 1 (Applicable Classification Code)
- 5.3.2 Category 2 (Applicable Classification Code)
- 5.3.3 Category 3 (Applicable Classification Code)
- 5.3.4 Category 4 (Applicable Classification Code)
- 5.3.5 Category 5 (Applicable Classification Code)
- 5.4 Cross-Border Pricing & Transaction Benchmarks
- 5.4.1 Export Pricing – Segment & Country
- 5.4.2 Import Pricing – Segment & Source Country
- 5.4.3 Price Trends (2024)
- 5.5 Key Cross-Border Trade & Delivery Routes
- 5.5.1 Cross-Border Trade/Delivery Route 1
- 5.5.2 Cross-Border Trade/Delivery Route 2
- 5.5.3 Cross-Border Trade/Delivery Route 3
- 5.5.4 Cross-Border Trade/Delivery Route 4
- 5.5.5 Cross-Border Trade/Delivery Route 5
- 5.6 Trade Policy & Market Access Impact Assessment
- 5.6.1 Tariff & Non-Tariff Barriers
- 5.6.2 Regional Trade & Economic Integration Frameworks
- 5.6.3 Bilateral & Multilateral Trade Agreements
- 5.6.4 Cross-Border Operating, Licensing & Localization Requirements
Note: This chapter applies where cross-border trade or delivery is relevant to Optical Variable Pigments. Goods, services, and digital offerings are assessed using applicable classifications and transaction measures. Import-export volumes, trade balances, and route analyses are included only where meaningful to the market.
Chapter 6. Competitive Landscape & Company Benchmarking
- 6.1 Optical Variable Pigments Market Concentration & Structure
- 6.1.1 Herfindahl-Hirschman Index (HHI) – vs. 2024
- 6.1.2 Leading, Mid-Sized & Emerging Player Structure
- 6.1.3 Global, Regional & Local Player Dynamics
- 6.2 Optical Variable Pigments Market Share Analysis – 2024
- 6.2.1 Global Revenue Share by Company
- 6.2.2 Global Volume Share by Company (Volume Where Applicable)
- 6.2.3 Regional Revenue Share
- 6.2.4 Market Share Evolution ( vs. 2024)
- 6.2.5 Company Market Share by Key Segment
- 6.2.6 Company Market Share by Customer Group
- 6.3 Operating Scale, Capacity & Infrastructure Analysis
- 6.3.1 Global Operating Scale & Supply Capacity
- 6.3.2 Resource Utilization & Operating Efficiency
- 6.3.3 Output, Service Delivery & Activity Metrics
- 6.3.4 Operating Footprint & Infrastructure Map
- 6.3.5 Planned Operational & Capacity Expansion
- 6.4 Optical Variable Pigments Competitive Benchmarking Matrix
- 6.4.1 Revenue, Growth, Profitability & Operating Metric Comparison
- 6.4.2 Channel Revenue Mix
- 6.4.3 Geographic Revenue Exposure
- 6.4.4 R&D Intensity
- 6.4.5 Sustainability Maturity
- 6.5 Strategic Developments in Optical Variable Pigments (Last 24 Months)
- 6.5.1 Mergers, Acquisitions & Divestments
- 6.5.2 New Products, Services & Solutions in Optical Variable Pigments
- 6.5.3 Operational & Infrastructure Expansions
- 6.5.4 Strategic Alliances, Joint Ventures & Partnerships
- 6.5.5 Distribution Expansion & Market Entry
- 6.5.6 Sustainability & ESG Initiatives
- 6.6 Competitive Strategy Mapping
- 6.6.1 Leader, Challenger, Follower & Niche Classification
- 6.6.2 Pricing Strategy Comparison
- 6.6.3 Channel Strategy Matrix
Note: Strategic developments are included based on their materiality and the availability of reliable information.
Chapter 7. Global Optical Variable Pigments Market – By Sales & Delivery Channel
- 7.1 Segment Overview
- 7.1.1 Volume & Revenue Split by Channel (2024 & 2032) (Volume Where Applicable)
- 7.1.2 Channel Mix Evolution (2024-2032)
Chapter 8. Regional Market Analysis – Global Overview
- 8.1 Global Regional Overview
- 8.1.1 Regional Volume Share (Volume Where Applicable)
- 8.1.2 Regional Revenue Share
- 8.1.3 Regional Volume by Region (Volume Where Applicable)
- 8.1.4 Regional Revenue by Region
- 8.1.5 Regional Forecast Through 2032
- 8.2 Cross-Regional Segment Analysis
- 8.2.1 By Sales & Delivery Channel
- 8.2.2 By Competitive Positioning & Price Tier
Chapter 9. North America Optical Variable Pigments Market
- 9.1 United States
- 9.2 Canada
- 9.3 Mexico
Chapter 10. Europe Optical Variable Pigments Market
- 10.1 Germany
- 10.2 France
- 10.3 Italy
- 10.4 United Kingdom
- 10.5 Spain
- 10.6 Poland
- 10.7 Russia
- 10.8 Netherlands
- 10.9 Belgium
- 10.10 Sweden
- 10.11 Denmark
- 10.12 Norway
- 10.13 Rest of Europe
Chapter 11. Asia Pacific Optical Variable Pigments Market
- 11.1 China
- 11.2 India
- 11.3 Japan
- 11.4 South Korea
- 11.5 Thailand
- 11.6 Indonesia
- 11.7 Vietnam
- 11.8 Malaysia
- 11.9 Australia
- 11.10 Rest of Asia Pacific
Chapter 12. Latin America Optical Variable Pigments Market
- 12.1 Brazil
- 12.2 Argentina
- 12.3 Colombia
- 12.4 Chile
- 12.5 Rest of Latin America
Chapter 13. Middle East Optical Variable Pigments Market
- 13.1 Saudi Arabia
- 13.2 United Arab Emirates
- 13.3 Turkey
- 13.4 Israel
- 13.5 Iran
- 13.6 Rest of the Middle East
Chapter 14. Africa Optical Variable Pigments Market
- 14.1 South Africa
- 14.2 Egypt
- 14.3 Nigeria
- 14.4 Morocco
- 14.5 Rest of Africa
Chapter 15. Optical Variable Pigments Company Profiles
- 15.1 [Company 01]
- 15.1.1 Company Overview
- 15.1.2 Key Management Personnel
- 15.1.3 Products & Services Portfolio
- 15.1.4 Financial Performance
- 15.1.5 Key Market Focus & Geographic Presence
- 15.1.6 Recent Developments & Strategic Initiatives
Note: The company profile list is preliminary and may change based on research findings, market developments, data availability, and client requirements.
Chapter 16. Appendices
- Appendix A – List of Abbreviations & Acronyms
- Appendix B – Industry Classification Code Reference – Full Series
- Appendix C – Supply, Output & Operating Capacity Data Tables
- Appendix D – End-Use & Demand Base Tables
- Appendix E – Demand, Adoption & Usage Assumptions
- Appendix F – Pricing & Revenue Metric Reference Tables
- Appendix G – Company Operations & Infrastructure Database
- Appendix H – Cross-Border Trade & Activity Data Tables (Where Applicable)
- Appendix I – Regulatory Summary Tables
- Appendix J – Primary Research Participant List (Anonymized)
- Appendix K – Primary Research Questionnaire Framework
- Appendix L – Data Sources & Bibliography
- Appendix M – Market Size Divergence & Source Comparison
Chapter 17. Research Methodology
- 17.1 Research Framework & Philosophy
- 17.2 Secondary Research – Sources, Hierarchy & Data Extraction
- 17.3 Data Modeling – Bottom-Up & Top-Down Market Sizing
- 17.4 Primary Research – Stakeholder Framework, LOI & Sample Sizes
- 17.5 Forecast Methodology – Regression, Scenario & Sensitivity Analysis
- 17.6 Quality Control – Four-Layer Validation Framework
- 17.7 Limitations & Standard Assumptions
- 17.8 Disclaimer
