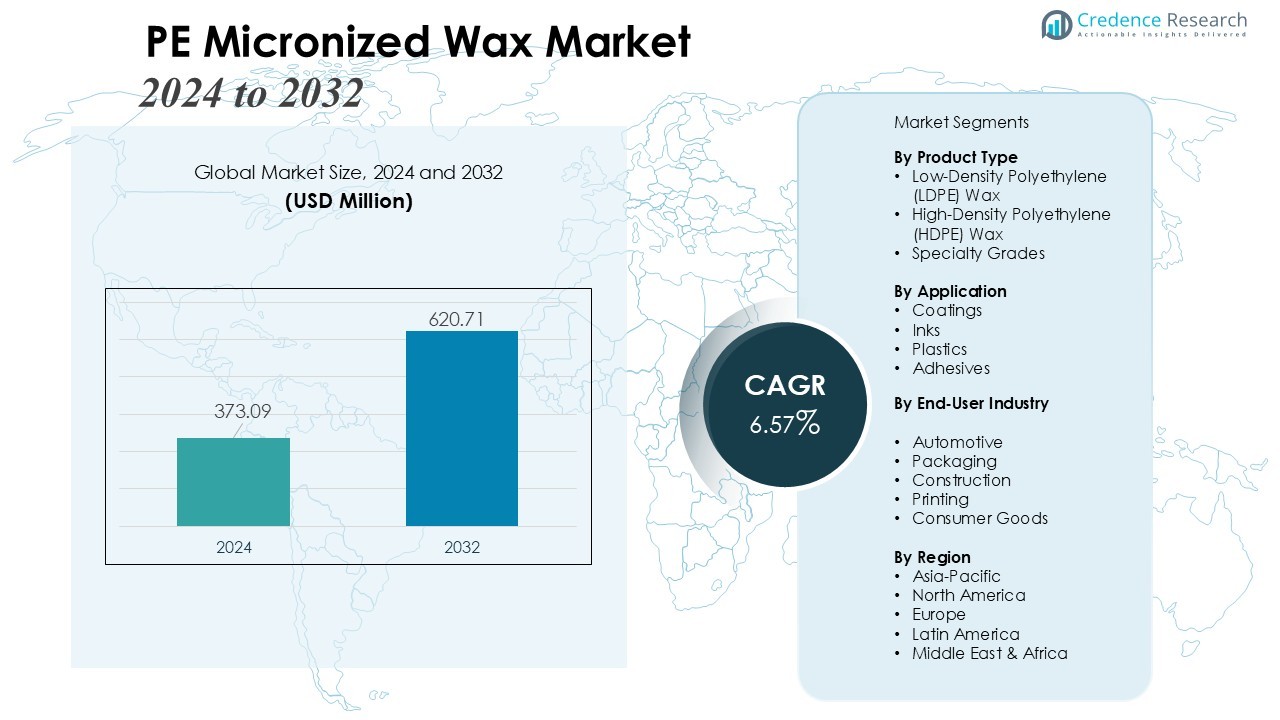
Home » Chemicals » PE Micronized Wax Market

PE Micronized Wax Market By Application (Lubricants, Coatings and Inks, Polishes and Cleaners, Plastics, Adhesives and Sealants, Personal Care and Cosmetics, Textiles and Fibers) By End-Use Industry (Plastics and Polymers, Paints and Coatings, Automotive, Printing, Construction, Textiles and Apparel) -Growth, Future Prospects & Competitive Analysis, 2022 – 2030

Price: $4699

Published: | Report ID: 23007 | Report Format : PDF

Market Insights

  • The global demand for PE Micronized Wax was valued at USD XX million in 2022 and is expected to reach USD XX Million in 2030, growing at a CAGR of 4.50% between 2023 and 2030.
  • The coatings sector is the fastest growing segment of the PE The second highest market share belongs to the PE Micronized Wax market, especially the coatings and inks segment and the personal care and cosmetics section.
  • The construction sector is the fastest growing section of the PE Micronized Wax market, with the automobile industry playing a significant role.
  • The micronized sector defines the market demand for PE Micronized Wax, while the submicron category has a significant market share.
  • Asia-Pacific will account for up to 42% of the PE Micronized Wax market by 2022, with North America enjoying the highest growth.
  • Growing demand for lightweight autos will result in market expansion.
  • Synthetic wax competition will stymie market expansion.

PE Micronized Wax Market

Executive Summary

Market Definition

The market for micronized wax made from polyethylene (PE) is referred to as the PE Micronized Wax market. PE micronized wax is a type of wax that has been micronized, resulting in small particles with a regulated particle size distribution. Because of its outstanding lubricating, dispersing, and matting capabilities, this type of wax is widely employed in a variety of industries, including coatings, printing inks, polymers, and rubber. The PE Micronized Wax market meets the demand for high-quality wax additives that improve the performance and functionality of these industries’ products.

Market Overview

It is anticipated that between 2023 and 2030, the worldwide PE Micronized Wax market will expand at a compound annual growth rate (CAGR) of 4.50%. From USD XX million in 2022, the market is projected to be worth USD XX million by 2030.

The market for PE Micronized Wax is increasing steadily and is likely to do so in the future years. The market is being driven by rising demand for high-performance additives in a variety of industries, including coatings, printing inks, polymers, and rubber. PE Micronized Wax has great qualities such as lubricating, dispersibility, and matting, making it a popular choice for improving product performance. The market is distinguished by the presence of both established and developing businesses, all of which strive to suit the changing needs of customers. With its diverse uses and benefits, the PE Micronized Wax market offers significant potential for growth and innovation.

Design Element 2

Access crucial information at unmatched prices!

Request your free sample report today & start making informed decisions powered by Credence Research!

Download Free Sample

CTA Design Element 3

Segmentation By Application

  • The PE Micronized Wax market, specifically the coatings and inks segment, is the dominating one. Coatings and inks are widely used in industries such as automotive, packaging, and printing, resulting in a significant demand for PE Micronized Wax in this area.
  • The personal care and cosmetics section has the second largest market share in the PE Micronized Wax market after the coatings and inks segment. Because of its emollient and texture-enhancing characteristics, PE Micronized Wax is often used in personal care products such as creams, lotions, and lip balms.

Segmentation By End-Use Industry

  • The construction industry is the fastest expanding segment of the PE Micronized Wax market. PE Micronized Wax is in high demand in the construction industry because to its numerous applications, including concrete admixtures, sealants, and coatings.
  • Aside from the construction industry, the automotive industry is a prominent stakeholder in the PE Micronized Wax market.

Segmentation by Partical Size

  • The micronized segment determines the market need for PE Micronized Wax. Micronized wax strikes a balance between particle size and performance, making it suited for a wide range of applications in industries such as coatings, inks, personal care, and others.
  • The submicron category is another big market share holder.

Segmentation by Region

  • In 2022, Asia-Pacific will hold up to 42% of the PE Micronized Wax market
  • North America is experiencing the fastest growth in the PE Micronized Wax market.
  • The rest of the world, including Latin America, the Middle East, and Africa, supplies the remaining demand for PE Micronized Wax.

PE Micronized Wax Market Research

In 2022, Asia Pacific is the area that dominates the market for PE Micronized Wax. One cause for this is China’s, India’s, and Japan’s rapid industrialization and economic expansion. These countries have a prominent presence in industries that use PE Micronized Wax, such as coatings, plastics, and personal care. Furthermore, the region’s growing population and urbanization fuel demand for construction and infrastructure projects, supporting the market for PE Micronized Wax. The Asia Pacific region’s market supremacy can be due to its strong industrial sector and expanding consumer base.

North America has the fastest growth rate in the PE Micronized Wax market. This is the region’s growing demand from businesses such as coatings, adhesives, and cosmetics. Technological advances, rising consumer awareness of the benefits of PE Micronized Wax, and the presence of important players in the sector are driving the North American market. Furthermore, the region’s emphasis on sustainable and eco-friendly products has resulted in an increase in the acceptance of PE Micronized Wax, leading to its rapid rise.

Key Highlights of the Report

The global PE Micronized Wax market is segmented By Application, End-Use Industry, Partical Size, and region. The PE Micronized Wax market, especially the coatings and inks segment, is the most dominant. Furthermore, the construction sector is the fastest growing section of the PE Micronized Wax market, and the micronized segment defines the market demand for PE Micronized Wax, with Asia Pacific leading the market growth.

The primary drivers of the market are increasing demand for high-performance additives in the coatings, printing inks, plastics, and rubber industries, as well as continuous innovation and product development. Furthermore, potential environmental issues and laws, fluctuating raw material prices, and intense market rivalry are the main obstacles that the market faces.

Nonetheless, Asia Pacific will dominate the market for PE Micronized Wax in 2022. Fast industrialization and economic development of China, India, and Japan. These nations are heavily involved in sectors that employ PE Micronized Wax, such as coatings, plastics, and personal care. Furthermore, the PE Micronized Wax market in North America is growing at the quickest rate. This is due to the region’s increasing demand from industries such as coatings, adhesives, and cosmetics.

What Elements Are Driving the Global Market for PE Micronized Wax?

Several reasons are driving the PE Micronized Wax market. This specialized wax is in high demand in industries such as coatings, printing inks, polymers, and rubber. PE Micronized Wax’s distinct features, such as its superior lubricating and dispersibility, make it a sought-after additive for improving the performance of a variety of products. Furthermore, there is an increasing demand for high-performance additives, and PE Micronized Wax excellently fits the bill. Finally, the market’s ongoing innovation and product development are driving its expansion, as firms attempt to fulfill customers’ shifting wants and deliver better solutions.

What Are The Main Obstacles That The Global PE Micronized Wax market Faces?

Concerns about environmental damage and laws are one potential impediment. As the industry matures, the usage and disposal of these wax additives may face more scrutiny and regulation. The shifting pricing of raw supplies are another constraint. The cost of raw materials used in the production of PE Micronized Wax might vary, affecting the market’s overall profitability. Finally, the market is highly competitive, with many firms competing for market share. This high rivalry can present difficulties for both new entrants and current businesses.

What Market Development Prospects Are There For PE Micronized Wax Globally?

One possibility is to extend into new geographical areas. Companies can explore undiscovered markets and build a presence in new regions as demand for high-performance additives grows globally. Another possibility is the creation of environmentally friendly and long-lasting products. With increased environmental awareness, there is a growing demand for wax additives with low environmental impact. Companies that can provide environmentally friendly alternatives have a better chance of capturing this market sector. Finally, collaborations and partnerships can give market growth chances. Companies can utilize their skills and resources by collaborating with other industry players to generate innovation and increase their market reach.

Market Drivers

The global PE Micronized Wax market is driven by several factors. The following are the key drivers of the global PE Micronized Wax market:

Increased Demand For Coatings, Paints, And Inks Will Drive Market Growth

The growing demand for these items is due to the diversity of coatings, paints, and inks being developed to improve their qualities. It can be used to increase the gloss of coatings and paints. This is critical for products that require a gleaming finish, such as vehicle paint and furniture varnish. It can be used with coatings and paints to improve adherence to the surface to which they are applied. This is critical for goods that require a strong surface bond, such as industrial coatings and maritime paints. It can be used to improve the water resistance of coatings and paints. This is critical for moisture-resistant materials such as exterior paints and marine coatings.

The rising demand for coatings, paints, and inks is driving up the price. This is attributable to the expanding building industry, rising automotive product demand, and rising consumer desire for aesthetic products.

Growing Demand For Lightweight Automobiles Will Result In Market Expansion

It is utilized in the automobile industry to increase vehicle fuel efficiency. The growing need for lightweight automobiles is driving the growth of this business. It is utilized in the automobile industry to increase vehicle fuel efficiency. This is accomplished by reducing the vehicle’s weight, which can result in a significant gain in fuel economy. It’s commonly utilized in the production of plastic pieces including bumpers, spoilers, and grilles. The growing need for lightweight automobiles is pushing it in the automotive sector. This is because of rising fuel prices and increased environmental concerns.

Market Restraints

The global PE Micronized Wax market faces some challenges that may hinder its growth. These include the following:

Competition From Synthetic Waxes To Hamper The Market Growth

Synthetic wax competition can be a barrier to the expansion of the PE Micronized Wax industry. Synthetic waxes, which are man-made, have features and functions comparable to PE Micronized Wax. This creates a competitive environment in which businesses must differentiate their products and demonstrate the superiority of PE Micronized Wax over synthetic alternatives. One difficulty faced by synthetic wax competition is the possible pricing advantage they may have. Synthetic waxes are frequently created at a reduced cost, making them more appealing to producers wanting to cut costs. Because of this price advantage, PE Micronized Wax may find it challenging to compete on a solely cost basis.

Additionally, synthetic waxes may provide comparable performance to PE Micronized Wax. This implies that producers may choose synthetic alternatives, particularly if they can achieve the same outcomes at a lower cost. The presence of these substitutes in the market may limit demand for PE Micronized Wax and impede its overall growth.

Opportunities

The global PE Micronized Wax market offers significant growth opportunities. These include the following:

Increased Demand For Environmentally Friendly And Sustainable Products

The growing demand for sustainable and eco-friendly products is one exciting prospect in the PE Micronized Wax market. As customers become more aware of their environmental impact, there is a growing interest in employing sustainable materials and procedures across a wide range of businesses. PE Micronized Wax is a sustainable alternative to traditional waxes because it is manufactured from polyethylene, a commonly available and recyclable material. Its environmentally benign characteristics attracts firms trying to lower their carbon impact and meet the growing demand for sustainable products.

In addition, PE Micronized Wax has numerous applications such as coatings, adhesives, printing inks, and polymers. The growing use of these materials in industries like as packaging, automotive, and construction is expected to drive up demand for PE Micronized Wax.

Competitive Landscape

Key Players

The global PE Micronized Wax market is highly competitive, with several key players. Some of the major players in the market and their market share are as follows:

  • Clariant
  • BASF
  • Honeywell
  • Lubrizol
  • Deuteron
  • Ceronas
  • MUNZING
  • Shamrock Technologies
  • Nanjing Tianshi New Material
  • Shanghai Jiaoer Wax
  • Jiangxi Longhai Chemical
  • Kunshan Xinkui Chem

These organizations prioritize product innovation, Disease Area expansion, and mergers and acquisitions to stay competitive.

The global PE Micronized Wax market’s key players continually seek to stay ahead by offering new Speciess and developments.

In September 2019, BASF agreed to sell its ultrafiltration membrane business, Inge GmbH, to DuPont Safety & Construction, a subsidiary business unit of DuPont Co. According to BASF officials, Inge GmbH and its products are more compatible with DuPont’s business plan.

In May 2020, Ceridust 3942 F TP and Ceridust 3943 F TP are two new micronized PTFE modified polyethylene wax additives from Clariant AG. These solutions, according to the company, enable powder coatings with a fine and homogeneous textured structure and a matte finish, as well as properties like as mar resistance and anti-slip performance, and can be utilized for coating and ink applications.

Summary of Key Findings

  • Synthetic wax competition will stifle market expansion.
  • Market segmented By Application, End-Use Industry, Partical Size, Battery Type, Size and Capacity, and region
  • The construction sector is the fastest growing section of the PE Micronized Wax market
  • The submicron category has a significant market share.
  • Asia Pacific is leading market growth; the market is highly competitive with key players including BASF, Sasol, Clariant, Honeywell, Lubrizol, MÃœNZING Corporation, MPI, Nanjing Tianshi, Michelman, Shamrock Technologies, Ceronas.

Shape Your Report to Specific Countries or Regions & Enjoy 30% Off!

Future Outlook

  • Demand is increasing in industries such as coatings, printing inks, polymers, and rubber.
  • A greater emphasis on high-performance additives.
  • Ongoing product development and innovation.
  • Market player and competition expansion.
  • Growing popularity of PE Micronized Wax due to its excellent features.
  • Exciting potential for expansion and investment.

Segmentation

By Application:

  • Lubricants
  • Coatings and Inks
  • Polishes and Cleaners
  • Plastics
  • Adhesives and Sealants
  • Personal Care and Cosmetics
  • Textiles and Fibers

By End-Use Industry:

  • Plastics and Polymers
  • Paints and Coatings
  • Automotive
  • Printing
  • Construction
  • Textiles and Apparel

By Particle Size:

  • Submicron
  • Micronized
  • Coarse
  • By Region
    • North America
      • US
      • Canada
      • Mexico
    • Europe
      • Germany
      • France
      • UK.
      • Italy
      • Spain
      • Rest of Europe
    • Asia Pacific
      • China
      • Japan
      • India
      • South Korea
      • South-east Asia
      • Rest of Asia Pacific
    • Latin America
      • Brazil
      • Argentina
      • Rest of Latin America
    • Middle East & Africa
      • GCC Countries
      • South Africa
      • Rest of Middle East and Africa

Adjacent Markets

In the PE Micronized Wax market, there are several adjacent markets which has high revenue growth opportunities. The key adjacent markets for PE Micronized Wax market-

1. Preface

1.1. Report Description

1.1.1. Purpose of the Report

1.1.2. Target Audience

1.1.3. USP and Key Offerings

1.2. Research Scope

1.3. Market Introduction


2. Executive Summary

2.1. Market Snapshot: Global PE Micronized Wax market

2.1.1. Global PE Micronized Wax market, By Application

2.1.2. Global PE Micronized Wax market, By End-Use Industry

2.1.3. Global PE Micronized Wax market, By Particle Size

2.1.4. Global PE Micronized Wax market, By Region

2.2. Insights from Primary Respondents


3. Market Dynamics & Factors Analysis

3.1. Introduction

3.1.1. Global PE Micronized Wax market Value, 2017-2030, (US$ Mn)

3.1.2. Y-o-Y Growth Trend Analysis

3.2. Market Dynamics

3.2.1. PE Micronized Wax market Drivers

3.2.2. PE Micronized Wax market Restraints

3.2.3. PE Micronized Wax market Opportunities

3.2.4. Major PE Micronized Wax Industry Challenges

3.3. Growth and Development Patterns

3.4. Investment Feasibility Analysis

3.5. Market Opportunity Analysis

3.5.1. Application

3.5.2. End-Use Industry

3.5.3. Particle Size

3.5.4. Geography


4. Market Competitive Landscape Analysis

4.1. Company Market Share Analysis, 2022

4.1.1. Global PE Micronized Wax market: Company Market Share, Value 2022

4.1.2. Global PE Micronized Wax market: Top 6 Company Market Share, Value 2022

4.1.3. Global PE Micronized Wax market: Top 3 Company Market Share, Value 2022

4.2. Global PE Micronized Wax market: Company Revenue Share Analysis, 2022

4.3. Company Assessment Metrics, 2022

4.3.1. Stars

4.3.2. Emerging Leaders

4.3.3. Pervasive Players

4.3.4. Participants

4.4. Startups/ SMEs Assessment Metrics, 2022

4.4.1. Progressive Companies

4.4.2. Responsive Companies

4.4.3. Dynamic Companies

4.4.4. Starting Blocks

4.5. Strategic Development

4.5.1. Acquisition and Mergers

4.5.2. New Application Launch

4.5.3. Regional Expansion

4.5.4. Partnerships

4.6. Key Player Application Matrix

4.7. Potential for New Players in the Global PE Micronized Wax market


5. Premium Insights

5.1. STAR (Situation, Task, Action, Results) Analysis

5.2. Porter’s Five Forces Analysis

5.2.1. Threat of New Entrants

5.2.2. Bargaining Power of Buyers/Consumers

5.2.3. Bargaining Power of Suppliers

5.2.4. Threat of Substitute Types

5.2.5. Intensity of Competitive Rivalry

5.3. PESTEL Analysis

5.3.1. Political Factors

5.3.2. Economic Factors

5.3.3. Social Factors

5.3.4. Technological Factors

5.3.5. Environmental Factors

5.3.6. Legal Factors

5.4. Key Market Trends

5.4.1. Demand Side Trends

5.4.2. Supply Side Trends

5.5. Value Chain Analysis

5.6. Technology Analysis

5.6.1. Micronized in the global market

5.6.2. Patent Analysis

5.6.3. Emerging technologies and their potential disruption to the market

5.7. Consumer Behaviour Analysis

5.7.1. Consumer Preferences and Expectations

5.7.2. Factors Influencing Consumer Buying Decisions

5.7.2.1. North America

5.7.2.2. Europe

5.7.2.3. Asia Pacific

5.7.2.4. Latin America

5.7.2.5. Middle East and Africa

5.7.3. Consumer Pain Points

5.8. Analysis and Recommendations

5.9. Adjacent Market Analysis


6. Market Positioning of Key Players, 2022

6.1. Company market share of key players, 2022

6.2. Competitive Benchmarking

6.3. Market Positioning of Key Vendors

6.4. Geographical Presence Analysis

6.5. Major Strategies Adopted by Key Players

6.5.1. Key Strategies Analysis

6.5.2. Mergers and Acquisitions

6.5.3. Partnerships

6.5.4. Application Launch

6.5.5. Geographical Expansion

6.5.6. Autoimmune Diseases


7. Impact Analysis of COVID 19 and Russia – Ukraine War on PE Micronized Wax market

7.1. Ukraine-Russia War Impact

7.1.1. Uncertainty and Economic Instability

7.1.2. Supply chain disruptions

7.1.3. Regional market shifts

7.1.4. Shift in government priorities

7.2. COVID-19 Impact Analysis

7.2.1. Supply Chain Disruptions

7.2.2. Demand Fluctuations

7.2.3. Shift in Application Mix

7.2.4. Reduced Industrial Activity

7.2.5. Regional Impact Analysis

7.2.5.1. North America

7.2.5.2. Europe

7.2.5.3. Asia Pacific

7.2.5.4. Latin America

7.2.5.5. Middle East and Africa


8. Global PE Micronized Wax market, By Application

8.1. Global PE Micronized Wax market Overview, By Application

8.1.1. Global PE Micronized Wax market Revenue Share, By Application, 2022 Vs 2030 (in %)

8.2. Lubrication

8.2.1. Global PE Micronized Wax market, By LUBRICATION, By Region, 2017-2030 (US$ Mn)

8.2.2. Market Dynamics for LUBRICATION

8.2.2.1. Drivers

8.2.2.2. Restraints

8.2.2.3. Opportunities

8.2.2.4. Trends

8.3. Coatings and Inks

8.3.1. Global PE Micronized Wax market, By COATINGS AND INKS, By Region, 2017-2030 (US$ Mn)

8.3.2. Market Dynamics for COATINGS AND INKS

8.3.2.1. Drivers

8.3.2.2. Restraints

8.3.2.3. Opportunities

8.3.2.4. Trends

8.4. Polishes and Cleaners

8.4.1. Global PE Micronized Wax market, By Polishes and Cleaners, By Region, 2017-2030 (US$ Mn)

8.4.2. Market Dynamics for Polishes and Cleaners

8.4.2.1. Drivers

8.4.2.2. Restraints

8.4.2.3. Opportunities

8.4.2.4. Trends

8.5. Plastics

8.5.1. Global PE Micronized Wax market, By Plastics, By Region, 2017-2030 (US$ Mn)

8.5.2. Market Dynamics for Plastics

8.5.2.1. Drivers

8.5.2.2. Restraints

8.5.2.3. Opportunities

8.5.2.4. Trends

8.6. Plastics

8.6.1. Global PE Micronized Wax market, By Plastics, By Region, 2017-2030 (US$ Mn)

8.6.2. Market Dynamics for Plastics

8.6.2.1. Drivers

8.6.2.2. Restraints

8.6.2.3. Opportunities

8.6.2.4. Trends

8.7. Adhesives and Sealants

8.7.1. Global PE Micronized Wax market, By Adhesives and Sealants, By Region, 2017-2030 (US$ Mn)

8.7.2. Market Dynamics for Adhesives and Sealants

8.7.2.1. Drivers

8.7.2.2. Restraints

8.7.2.3. Opportunities

8.7.2.4. Trends

8.8. Personal Care and Cosmetics

8.8.1. Global PE Micronized Wax market, By Personal Care and Cosmetics, By Region, 2017-2030 (US$ Mn)

8.8.2. Market Dynamics for Personal Care and Cosmetics

8.8.2.1. Drivers

8.8.2.2. Restraints

8.8.2.3. Opportunities

8.8.2.4. Trends

8.9. Textiles and Fibers

8.9.1. Global PE Micronized Wax market, By Textiles and Fibers, By Region, 2017-2030 (US$ Mn)

8.9.2. Market Dynamics for Textiles and Fibers

8.9.2.1. Drivers

8.9.2.2. Restraints

8.9.2.3. Opportunities

8.9.2.4. Trends


9. Global PE Micronized Wax market, By End-Use Industry

9.1. Global PE Micronized Wax market Overview, By End-Use Industry

9.1.1. Global PE Micronized Wax market Revenue Share, By End-Use Industry, 2022 Vs 2030 (in %)

9.2. Plastics and Polymers

9.2.1. Global PE Micronized Wax market, By Plastics and Polymers, By Region, 2017-2030 (US$ Mn)

9.2.2. Market Dynamics for Plastics and Polymers

9.2.2.1. Drivers

9.2.2.2. Restraints

9.2.2.3. Opportunities

9.2.2.4. Trends

9.3. Automotive

9.3.1. Global PE Micronized Wax market, By Automotive, By Region, 2017-2030 (US$ Mn)

9.3.2. Market Dynamics for Automotive

9.3.2.1. Drivers

9.3.2.2. Restraints

9.3.2.3. Opportunities

9.3.2.4. Trends

9.4. Printing

9.4.1. Global PE Micronized Wax market, By Printing, By Region, 2017-2030 (US$ Mn)

9.4.2. Market Dynamics for Printing

9.4.2.1. Drivers

9.4.2.2. Restraints

9.4.2.3. Opportunities

9.4.2.4. Trends

9.5. Construction

9.5.1. Global PE Micronized Wax market, By Construction, By Region, 2017-2030 (US$ Mn)

9.5.2. Market Dynamics for Construction

9.5.2.1. Drivers

9.5.2.2. Restraints

9.5.2.3. Opportunities

9.5.2.4. Trends

9.6. Textiles and Apparel

9.6.1. Global PE Micronized Wax market, By Textiles and Apparel, By Region, 2017-2030 (US$ Mn)

9.6.2. Market Dynamics for Textiles and Apparel

9.6.2.1. Drivers

9.6.2.2. Restraints

9.6.2.3. Opportunities

9.6.2.4. Trends


10. Global PE Micronized Wax market, By Particle Size

10.1. Global PE Micronized Wax market Overview, By Particle Size

10.1.1. Global PE Micronized Wax market Revenue Share, By Particle Size, 2022 Vs 2030 (in %)

10.2. Submicron

10.2.1. Global PE Micronized Wax market, By Submicron, By Region, 2017-2030 (US$ Mn)

10.2.2. Market Dynamics for Submicron

10.2.2.1. Drivers

10.2.2.2. Restraints

10.2.2.3. Opportunities

10.2.2.4. Trends

10.3. Micronized

10.3.1. Global PE Micronized Wax market, By Micronized, By Region, 2017-2030 (US$ Mn)

10.3.2. Market Dynamics for Micronized

10.3.2.1. Drivers

10.3.2.2. Restraints

10.3.2.3. Opportunities

10.3.2.4. Trends

10.4. Coarse

10.4.1. Global PE Micronized Wax market, By Coarse, By Region, 2017-2030 (US$ Mn)

10.4.2. Market Dynamics for Coarse

10.4.2.1. Drivers

10.4.2.2. Restraints

10.4.2.3. Opportunities

10.4.2.4. Trends


11. Global PE Micronized Wax market, By Region

11.1. Global PE Micronized Wax market Overview, by Region

11.1.1. Global PE Micronized Wax market, By Region, 2022 vs 2030 (in%)

11.2. Application

11.2.1. Global PE Micronized Wax market, By Application, 2017-2030 (US$ Mn)

11.3. End-Use Industry

11.3.1. Global PE Micronized Wax market, By End-Use Industry, 2017-2030 (US$ Mn)

11.4. Particle Size

11.4.1. Global PE Micronized Wax market, By Particle Size, 2017-2030 (US$ Mn)


12. North America PE Micronized Wax market Analysis

12.1. Overview

12.1.1. Market Dynamics for North America

12.1.1.1. Drivers

12.1.1.2. Restraints

12.1.1.3. Opportunities

12.1.1.4. Trends

12.2. North America PE Micronized Wax market, By Application, 2017-2030(US$ Mn)

12.2.1. Overview

12.2.2. SRC Analysis

12.3. North America PE Micronized Wax market, By End-Use Industry, 2017-2030(US$ Mn)

12.3.1. Overview

12.3.2. SRC Analysis

12.4. North America PE Micronized Wax market, By Particle Size, 2017-2030(US$ Mn)

12.4.1. Overview

12.4.2. SRC Analysis

12.5. North America PE Micronized Wax market, by Country, 2017-2030(US$ Mn)

12.5.1. North America PE Micronized Wax market, by Country, 2022 Vs 2030 (in%)

12.5.2. U.S.

12.5.3. Canada

12.5.4. Mexico


13. Europe PE Micronized Wax market Analysis

13.1. Overview

13.1.1. Market Dynamics for North America

13.1.1.1. Drivers

13.1.1.2. Restraints

13.1.1.3. Opportunities

13.1.1.4. Trends

13.2. Europe PE Micronized Wax market, By Application, 2017-2030(US$ Mn)

13.2.1. Overview

13.2.2. SRC Analysis

13.3. Europe PE Micronized Wax market, By End-Use Industry, 2017-2030(US$ Mn)

13.3.1. Overview

13.3.2. SRC Analysis

13.4. Europe PE Micronized Wax market, By Particle Size, 2017-2030(US$ Mn)

13.4.1. Overview

13.4.2. SRC Analysis

13.5. Europe PE Micronized Wax market, by Country, 2017-2030 (US$ Mn)

13.5.1. Europe PE Micronized Wax market, by Country, 2022 Vs 2030 (in%)

13.5.2. UK

13.5.3. France

13.5.4. Germany

13.5.5. Italy

13.5.6. Spain

13.5.7. Benelux

13.5.8. Russia

13.5.9. Rest of Europe


14. Asia Pacific PE Micronized Wax market Analysis

14.1. Overview

14.1.1. Market Dynamics for North America

14.1.1.1. Drivers

14.1.1.2. Restraints

14.1.1.3. Opportunities

14.1.1.4. Trends

14.2. Asia Pacific PE Micronized Wax market, By Application, 2017-2030(US$ Mn)

14.2.1. Overview

14.2.2. SRC Analysis

14.3. Asia Pacific PE Micronized Wax market, By End-Use Industry, 2017-2030(US$ Mn)

14.3.1. Overview

14.3.2. SRC Analysis

14.4. Asia Pacific PE Micronized Wax market, By Particle Size, 2017-2030(US$ Mn)

14.4.1. Overview

14.4.2. SRC Analysis

14.5. Asia Pacific PE Micronized Wax market, by Country, 2017-2030 (US$ Mn)

14.5.1. Asia Pacific PE Micronized Wax market, by Country, 2022 Vs 2030 (in%)

14.5.2. China

14.5.3. Japan

14.5.4. India

14.5.5. South Korea

14.5.6. South East Asia

14.5.7. Rest of Asia Pacific


15. Latin America PE Micronized Wax market Analysis

15.1. Overview

15.1.1. Market Dynamics for North America

15.1.1.1. Drivers

15.1.1.2. Restraints

15.1.1.3. Opportunities

15.1.1.4. Trends

15.2. Latin America PE Micronized Wax market, By Application, 2017-2030(US$ Mn)

15.2.1. Overview

15.2.2. SRC Analysis

15.3. Latin America PE Micronized Wax market, By End-Use Industry, 2017-2030(US$ Mn)

15.3.1. Overview

15.3.2. SRC Analysis

15.4. Latin America PE Micronized Wax market, By Particle Size, 2017-2030(US$ Mn)

15.4.1. Overview

15.4.2. SRC Analysis

15.5. Latin America PE Micronized Wax market, by Country, 2017-2030 (US$ Mn)

15.5.1. Latin America PE Micronized Wax market, by Country, 2022 Vs 2030 (in%)

15.5.2. Brazil

15.5.3. Argentina

15.5.4. Rest of Latin America


16. Middle East PE Micronized Wax market Analysis

16.1. Overview

16.1.1. Market Dynamics for North America

16.1.1.1. Drivers

16.1.1.2. Restraints

16.1.1.3. Opportunities

16.1.1.4. Trends

16.2. Middle East PE Micronized Wax market, By Application, 2017-2030(US$ Mn)

16.2.1. Overview

16.2.2. SRC Analysis

16.3. Middle East PE Micronized Wax market, By End-Use Industry, 2017-2030(US$ Mn)

16.3.1. Overview

16.3.2. SRC Analysis

16.4. Middle East PE Micronized Wax market, By Particle Size, 2017-2030(US$ Mn)

16.4.1. Overview

16.4.2. SRC Analysis

16.5. Middle East PE Micronized Wax market, by Country, 2017-2030 (US$ Mn)

16.5.1. Middle East PE Micronized Wax market, by Country, 2022 Vs 2030 (in%)

16.5.2. UAE

16.5.3. Saudi Arabia

16.5.4. Rest of Middle East


17. Africa PE Micronized Wax market Analysis

17.1. Overview

17.1.1. Market Dynamics for North America

17.1.1.1. Drivers

17.1.1.2. Restraints

17.1.1.3. Opportunities

17.1.1.4. Trends

17.2. Africa PE Micronized Wax market, By Application, 2017-2030(US$ Mn)

17.2.1. Overview

17.2.2. SRC Analysis

17.3. Africa PE Micronized Wax market, By End-Use Industry, 2017-2030(US$ Mn)

17.3.1. Overview

17.3.2. SRC Analysis

17.4. Africa PE Micronized Wax market, By Particle Size, 2017-2030(US$ Mn)

17.4.1. Overview

17.4.2. SRC Analysis

17.5. Africa PE Micronized Wax market, by Country, 2017-2030 (US$ Mn)

17.5.1. Middle East PE Micronized Wax market, by Country, 2022 Vs 2030 (in%)

17.5.2. South Africa

17.5.3. Egypt

17.5.4. Rest of Africa


18. Company Profiles

18.1. Clariant

18.1.1. Company Overview

18.1.2. Applications/Services Portfolio

18.1.3. Geographical Presence

18.1.4. SWOT Analysis

18.1.5. Financial Summary

18.1.5.1. Market Revenue and Net Profit (2019-2022)

18.1.5.2. Business Segment Revenue Analysis

18.1.5.3. Geographical Revenue Analysis

18.2. BASF

18.3. Honeywell

18.4. Lubrizol

18.5. Deuteron

18.6. Ceronas

18.7. MUNZING

18.8. Shamrock Technologies

18.9. Nanjing Tianshi New Material

18.10. Shanghai Jiaoer Wax

18.11. Jiangxi Longhai Chemical

18.12. Kunshan Xinkui Chem


19. Research Methodology

19.1. Research Methodology

19.2. Submicron – Secondary Research

19.3. SubmicronI – Data Modelling

19.3.1. Company Share Analysis Model

19.3.2. Revenue Based Modelling

19.4. SubmicronII – Primary Research

19.5. Research Limitations

19.5.1. Assumptions

List of Figures

FIG. 1 Global PE Micronized Wax market: Research Methodology

FIG. 2 Market Size Estimation – Top Down & Bottom up Approach

FIG. 3 Global PE Micronized Wax market Segmentation

FIG. 4 Global PE Micronized Wax market, By Application, 2022 (US$ Mn)

FIG. 5 Global PE Micronized Wax market, By End-Use Industry, 2022 (US$ Mn)

FIG. 6 Global PE Micronized Wax market, By Particle Size, 2022 (US$ Mn)

FIG. 7 Global PE Micronized Wax market, by Geography, 2022 (US$ Mn)

FIG. 8 Attractive Investment Proposition, By Application, 2022

FIG. 9 Attractive Investment Proposition, By End-Use Industry, 2022

FIG. 10 Attractive Investment Proposition, By Particle Size, 2022

FIG. 11 Attractive Investment Proposition, by Geography, 2022

FIG. 12 Global Market Share Analysis of Key PE Micronized Wax market Manufacturers, 2022

FIG. 13 Global Market Positioning of Key PE Micronized Wax market Manufacturers, 2022

FIG. 14 Global PE Micronized Wax market Value Contribution, By Application, 2022 & 2030 (Value %)

FIG. 15 Global PE Micronized Wax market, by Lubrication, Value, 2017-2030 (US$ Mn)

FIG. 16 Global PE Micronized Wax market, by Coatings AND INKS, Value, 2017-2030 (US$ Mn)

FIG. 17 Global PE Micronized Wax market, by Polishes and Cleaners, Value, 2017-2030 (US$ Mn)

FIG. 18 Global PE Micronized Wax market, by Plastics, Value, 2017-2030 (US$ Mn)

FIG. 19 Global PE Micronized Wax market, by Adhesives and Sealants, Value, 2017-2030 (US$ Mn)

FIG. 20 Global PE Micronized Wax market, by Personal Care and Cosmetics, Value, 2017-2030 (US$ Mn)

FIG. 21 Global PE Micronized Wax market, by Textiles and Fibers, Value, 2017-2030 (US$ Mn)

FIG. 22 Global PE Micronized Wax market Value Contribution, By End-Use Industry, 2022 & 2030 (Value %)

FIG. 23 Global PE Micronized Wax market, by Plastics and Polymers, Value, 2017-2030 (US$ Mn)

FIG. 24 Global PE Micronized Wax market, by Paints and Coatings, Value, 2017-2030 (US$ Mn)

FIG. 25 Global PE Micronized Wax market, by Automotive, Value, 2017-2030 (US$ Mn)

FIG. 26 Global PE Micronized Wax market, by Printing, Value, 2017-2030 (US$ Mn)

FIG. 27 Global PE Micronized Wax market, by Construction, Value, 2017-2030 (US$ Mn)

FIG. 28 Global PE Micronized Wax market, by Textiles and Apparel, Value, 2017-2030 (US$ Mn)

FIG. 29 Global PE Micronized Wax market Value Contribution, By Particle Size, 2022 & 2030 (Value %)

FIG. 30 Global PE Micronized Wax market, by Submicron, Value, 2017-2030 (US$ Mn)

FIG. 31 Global PE Micronized Wax market, by Micronized, Value, 2017-2030 (US$ Mn)

FIG. 32 Global PE Micronized Wax market, by Coarse, Value, 2017-2030 (US$ Mn)

FIG. 33 North America PE Micronized Wax market, 2017-2030 (US$ Mn)

FIG. 34 U.S. PE Micronized Wax market, 2017-2030 (US$ Mn)

FIG. 35 Canada PE Micronized Wax market, 2017-2030 (US$ Mn)

FIG. 36 Mexico PE Micronized Wax market, 2017-2030 (US$ Mn)

FIG. 37 Europe PE Micronized Wax market, 2017-2030 (US$ Mn)

FIG. 38 Germany PE Micronized Wax market, 2017-2030 (US$ Mn)

FIG. 39 France PE Micronized Wax market, 2017-2030 (US$ Mn)

FIG. 40 U.K. PE Micronized Wax market, 2017-2030 (US$ Mn)

FIG. 41 Italy PE Micronized Wax market, 2017-2030 (US$ Mn)

FIG. 42 Spain PE Micronized Wax market, 2017-2030 (US$ Mn)

FIG. 43 Benelux PE Micronized Wax market, 2017-2030 (US$ Mn)

FIG. 44 Russia PE Micronized Wax market, 2017-2030 (US$ Mn)

FIG. 45 Rest of Europe PE Micronized Wax market, 2017-2030 (US$ Mn)

FIG. 46 Asia Pacific PE Micronized Wax market, 2017-2030 (US$ Mn)

FIG. 47 China PE Micronized Wax market, 2017-2030 (US$ Mn)

FIG. 48 Japan PE Micronized Wax market, 2017-2030 (US$ Mn)

FIG. 49 India PE Micronized Wax market, 2017-2030 (US$ Mn)

FIG. 50 South Korea PE Micronized Wax market, 2017-2030 (US$ Mn)

FIG. 51 South-East Asia PE Micronized Wax market, 2017-2030 (US$ Mn)

FIG. 52 Rest of Asia Pacific PE Micronized Wax market, 2017-2030 (US$ Mn)

FIG. 53 Latin America PE Micronized Wax market, 2017-2030 (US$ Mn)

FIG. 54 Brazil PE Micronized Wax market, 2017-2030 (US$ Mn)

FIG. 55 Argentina PE Micronized Wax market, 2017-2030 (US$ Mn)

FIG. 56 Rest of Latin America PE Micronized Wax market, 2017-2030 (US$ Mn)

FIG. 57 Middle East PE Micronized Wax market, 2017-2030 (US$ Mn)

FIG. 58 UAEPE Micronized Wax market, 2017-2030 (US$ Mn)

FIG. 59 Saudi Arabia PE Micronized Wax market, 2017-2030 (US$ Mn)

FIG. 60 Rest of Middle East PE Micronized Wax market, 2017-2030 (US$ Mn)

FIG. 61 Africa PE Micronized Wax market, 2017-2030 (US$ Mn)

FIG. 62 South Africa PE Micronized Wax market, 2017-2030 (US$ Mn)

FIG. 63 Egypt PE Micronized Wax market, 2017-2030 (US$ Mn)

FIG. 64 Rest of Africa PE Micronized Wax market, 2017-2030 (US$ Mn)


List of Tables

TABLE 1 Market Snapshot: Global  PE Micronized Wax market

TABLE 2 Global  PE Micronized Wax market: Drivers Impact Analysis

TABLE 3 Global  PE Micronized Wax market: Market Restraints Impact Analysis

TABLE 4 Global  PE Micronized Wax market, by Competitive Benchmarking, 2022

TABLE 5 Global  PE Micronized Wax market, by Geographical Presence Analysis, 2022

TABLE 6 Global  PE Micronized Wax market, by Key Strategies Analysis, 2022

TABLE 7 Global  PE Micronized Wax market, by LUBRICATION, By Region, 2017-2022 (US$ Mn)

TABLE 8 Global  PE Micronized Wax market, by LUBRICATION, By Region, 2023-2030 (US$ Mn)

TABLE 9 Global  PE Micronized Wax market, by COATINGS AND INKS, By Region, 2017-2022 (US$ Mn)

TABLE 10 Global  PE Micronized Wax market, by COATINGS AND INKS, By Region, 2023-2030 (US$ Mn)

TABLE 11 Global  PE Micronized Wax market, by Polishes and Cleaners, By Region, 2017-2022 (US$ Mn)

TABLE 12 Global  PE Micronized Wax market, by Polishes and Cleaners, By Region, 2023-2030 (US$ Mn)

TABLE 13 Global  PE Micronized Wax market, by Plastics, By Region, 2017-2022 (US$ Mn)

TABLE 14 Global  PE Micronized Wax market, by Plastics, By Region, 2023-2030 (US$ Mn)

TABLE 15 Global  PE Micronized Wax market, by Adhesives and Sealants, By Region, 2017-2022 (US$ Mn)

TABLE 16 Global  PE Micronized Wax market, by Adhesives and Sealants, By Region, 2023-2030 (US$ Mn)

TABLE 17 Global  PE Micronized Wax market, by Personal Care and Cosmetics, By Region, 2017-2022 (US$ Mn)

TABLE 18 Global  PE Micronized Wax market, by Personal Care and Cosmetics, By Region, 2023-2030 (US$ Mn)

TABLE 19 Global  PE Micronized Wax market, by Textiles and Fibers, By Region, 2017-2022 (US$ Mn)

TABLE 20 Global  PE Micronized Wax market, by Textiles and Fibers, By Region, 2023-2030 (US$ Mn)

TABLE 21 Global  PE Micronized Wax market, by Plastics and Polymers, By Region, 2017-2022 (US$ Mn)

TABLE 22 Global  PE Micronized Wax market, by Plastics and Polymers, By Region, 2023-2030 (US$ Mn)

TABLE 23 Global  PE Micronized Wax market, by Paints and Coatings, By Region, 2017-2022 (US$ Mn)

TABLE 24 Global  PE Micronized Wax market, by Paints and Coatings, By Region, 2023-2030 (US$ Mn)

TABLE 25 Global  PE Micronized Wax market, by Automotive, By Region, 2017-2022 (US$ Mn)

TABLE 26 Global  PE Micronized Wax market, by Automotive, By Region, 2023-2030 (US$ Mn)

TABLE 27 Global  PE Micronized Wax market, by Printing, By Region, 2017-2022 (US$ Mn)

TABLE 28 Global  PE Micronized Wax market, by Printing, By Region, 2023-2030 (US$ Mn)

TABLE 29 Global  PE Micronized Wax market, by Construction, By Region, 2017-2022 (US$ Mn)

TABLE 30 Global  PE Micronized Wax market, by Construction, By Region, 2023-2030 (US$ Mn)

TABLE 31 Global  PE Micronized Wax market, by Textiles and Apparel, By Region, 2017-2022 (US$ Mn)

TABLE 32 Global  PE Micronized Wax market, by Textiles and Apparel, By Region, 2023-2030 (US$ Mn)

TABLE 33 Global  PE Micronized Wax market, by Submicron, By Region, 2017-2022 (US$ Mn)

TABLE 34 Global  PE Micronized Wax market, by Submicron, By Region, 2023-2030 (US$ Mn)

TABLE 35 Global  PE Micronized Wax market, by Micronized, By Region, 2017-2022 (US$ Mn)

TABLE 36 Global  PE Micronized Wax market, by Micronized, By Region, 2023-2030 (US$ Mn)

TABLE 37 Global  PE Micronized Wax market, by Coarse, By Region, 2017-2022 (US$ Mn)

TABLE 38 Global  PE Micronized Wax market, by Coarse, By Region, 2023-2030 (US$ Mn)

TABLE 39 Global  PE Micronized Wax market, By Application, 2017-2022 (US$ Mn)

TABLE 40 Global  PE Micronized Wax market, By Application, 2023-2030 (US$ Mn)

TABLE 41 Global  PE Micronized Wax market, By End-Use Industry, 2017-2022 (US$ Mn)

TABLE 42 Global  PE Micronized Wax market, By End-Use Industry, 2023-2030 (US$ Mn)

TABLE 43 Global  PE Micronized Wax market, By Particle Size, 2017-2022 (US$ Mn)

TABLE 44 Global  PE Micronized Wax market, By Particle Size, 2023-2030 (US$ Mn)

TABLE 45 Global  PE Micronized Wax market, by Region, 2017-2022 (US$ Mn)

TABLE 46 Global  PE Micronized Wax market, by Region, 2023-2030 (US$ Mn)

TABLE 47 North America  PE Micronized Wax market, By Application, 2017-2022 (US$ Mn)

TABLE 48 North America  PE Micronized Wax market, By Application, 2023-2030 (US$ Mn)

TABLE 49 North America  PE Micronized Wax market, By End-Use Industry, 2017-2022 (US$ Mn)

TABLE 50 North America  PE Micronized Wax market, By End-Use Industry, 2023-2030 (US$ Mn)

TABLE 51 North America  PE Micronized Wax market, By Particle Size, 2017-2022 (US$ Mn)

TABLE 52 North America  PE Micronized Wax market, By Particle Size, 2023-2030 (US$ Mn)

TABLE 53 North America  PE Micronized Wax market, by Country, 2017-2022 (US$ Mn)

TABLE 54 North America  PE Micronized Wax market, by Country, 2023-2030 (US$ Mn)

TABLE 55 United States  PE Micronized Wax market, By Application, 2017-2022 (US$ Mn)

TABLE 56 United States  PE Micronized Wax market, By Application, 2023-2030 (US$ Mn)

TABLE 57 United States  PE Micronized Wax market, By End-Use Industry, 2017-2022 (US$ Mn)

TABLE 58 United States  PE Micronized Wax market, By End-Use Industry, 2023-2030 (US$ Mn)

TABLE 59 United States  PE Micronized Wax market, By Particle Size, 2017-2022 (US$ Mn)

TABLE 60 United States  PE Micronized Wax market, By Particle Size, 2023-2030 (US$ Mn)

TABLE 61 Canada  PE Micronized Wax market, By Application, 2017-2022 (US$ Mn)

TABLE 62 Canada  PE Micronized Wax market, By Application, 2023-2030 (US$ Mn)

TABLE 63 Canada  PE Micronized Wax market, By End-Use Industry, 2017-2022 (US$ Mn)

TABLE 64 Canada  PE Micronized Wax market, By End-Use Industry, 2023-2030 (US$ Mn)

TABLE 65 Canada  PE Micronized Wax market, By Particle Size, 2017-2022 (US$ Mn)

TABLE 66 Canada  PE Micronized Wax market, By Particle Size, 2023-2030 (US$ Mn)

TABLE 67 Mexico  PE Micronized Wax market, By Application, 2017-2022 (US$ Mn)

TABLE 68 Mexico  PE Micronized Wax market, By Application, 2023-2030 (US$ Mn)

TABLE 69 Mexico  PE Micronized Wax market, By End-Use Industry, 2017-2022 (US$ Mn)

TABLE 70 Mexico  PE Micronized Wax market, By End-Use Industry, 2023-2030 (US$ Mn)

TABLE 71 Mexico  PE Micronized Wax market, By Particle Size, 2017-2022 (US$ Mn)

TABLE 72 Mexico  PE Micronized Wax market, By Particle Size, 2023-2030 (US$ Mn)

TABLE 73 Europe  PE Micronized Wax market, By Application, 2017-2022 (US$ Mn)

TABLE 74 Europe  PE Micronized Wax market, By Application, 2023-2030 (US$ Mn)

TABLE 75 Europe  PE Micronized Wax market, By End-Use Industry, 2017-2022 (US$ Mn)

TABLE 76 Europe  PE Micronized Wax market, By End-Use Industry, 2023-2030 (US$ Mn)

TABLE 77 Europe  PE Micronized Wax market, By Particle Size, 2017-2022 (US$ Mn)

TABLE 78 Europe  PE Micronized Wax market, By Particle Size, 2023-2030 (US$ Mn)

TABLE 79 Europe  PE Micronized Wax market, by Country, 2017-2022 (US$ Mn)

TABLE 80 Europe  PE Micronized Wax market, by Country, 2023-2030 (US$ Mn)

TABLE 81 Germany  PE Micronized Wax market, By Application, 2017-2022 (US$ Mn)

TABLE 82 Germany  PE Micronized Wax market, By Application, 2023-2030 (US$ Mn)

TABLE 83 Germany  PE Micronized Wax market, By End-Use Industry, 2017-2022 (US$ Mn)

TABLE 84 Germany  PE Micronized Wax market, By End-Use Industry, 2023-2030 (US$ Mn)

TABLE 85 Germany  PE Micronized Wax market, By Particle Size, 2017-2022 (US$ Mn)

TABLE 86 Germany  PE Micronized Wax market, By Particle Size, 2023-2030 (US$ Mn)

TABLE 87 France  PE Micronized Wax market, By Application, 2017-2022 (US$ Mn)

TABLE 88 France  PE Micronized Wax market, By Application, 2023-2030 (US$ Mn)

TABLE 89 France  PE Micronized Wax market, By End-Use Industry, 2017-2022 (US$ Mn)

TABLE 90 France  PE Micronized Wax market, By End-Use Industry, 2023-2030 (US$ Mn)

TABLE 91 France  PE Micronized Wax market, By Particle Size, 2017-2022 (US$ Mn)

TABLE 92 France  PE Micronized Wax market, By Particle Size, 2023-2030 (US$ Mn)

TABLE 93 United Kingdom  PE Micronized Wax market, By Application, 2017-2022 (US$ Mn)

TABLE 94 United Kingdom  PE Micronized Wax market, By Application, 2023-2030 (US$ Mn)

TABLE 95 United Kingdom  PE Micronized Wax market, By End-Use Industry, 2017-2022 (US$ Mn)

TABLE 96 United Kingdom  PE Micronized Wax market, By End-Use Industry, 2023-2030 (US$ Mn)

TABLE 97 United Kingdom  PE Micronized Wax market, By Particle Size, 2017-2022 (US$ Mn)

TABLE 98 United Kingdom  PE Micronized Wax market, By Particle Size, 2023-2030 (US$ Mn)

TABLE 99 Italy  PE Micronized Wax market, By Application, 2017-2022 (US$ Mn)

TABLE 100 Italy  PE Micronized Wax market, By Application, 2023-2030 (US$ Mn)

TABLE 101 Italy  PE Micronized Wax market, By End-Use Industry, 2017-2022 (US$ Mn)

TABLE 102 Italy  PE Micronized Wax market, By End-Use Industry, 2023-2030 (US$ Mn)

TABLE 103 Italy  PE Micronized Wax market, By Particle Size, 2017-2022 (US$ Mn)

TABLE 104 Italy  PE Micronized Wax market, By Particle Size, 2023-2030 (US$ Mn)

TABLE 105 Spain  PE Micronized Wax market, By Application, 2017-2022 (US$ Mn)

TABLE 106 Spain  PE Micronized Wax market, By Application, 2023-2030 (US$ Mn)

TABLE 107 Spain  PE Micronized Wax market, By End-Use Industry, 2017-2022 (US$ Mn)

TABLE 108 Spain  PE Micronized Wax market, By End-Use Industry, 2023-2030 (US$ Mn)

TABLE 109 Spain  PE Micronized Wax market, By Particle Size, 2017-2022 (US$ Mn)

TABLE 110 Spain  PE Micronized Wax market, By Particle Size, 2023-2030 (US$ Mn)

TABLE 111 Benelux PE Micronized Wax market, By Application, 2017-2022 (US$ Mn)

TABLE 112 Benelux PE Micronized Wax market, By Application, 2023-2030 (US$ Mn)

TABLE 113 Benelux PE Micronized Wax market, By End-Use Industry, 2017-2022 (US$ Mn)

TABLE 114 Benelux PE Micronized Wax market, By End-Use Industry, 2023-2030 (US$ Mn)

TABLE 115 Benelux PE Micronized Wax market, By Particle Size, 2017-2022 (US$ Mn)

TABLE 116 Benelux PE Micronized Wax market, By Particle Size, 2023-2030 (US$ Mn)

TABLE 117 Russia PE Micronized Wax market, By Application, 2017-2022 (US$ Mn)

TABLE 118 Russia PE Micronized Wax market, By Application, 2023-2030 (US$ Mn)

TABLE 119 Russia PE Micronized Wax market, By End-Use Industry, 2017-2022 (US$ Mn)

TABLE 120 Russia PE Micronized Wax market, By End-Use Industry, 2023-2030 (US$ Mn)

TABLE 121 Russia PE Micronized Wax market, By Particle Size, 2017-2022 (US$ Mn)

TABLE 122 Russia PE Micronized Wax market, By Particle Size, 2023-2030 (US$ Mn)

TABLE 123 Rest of Europe  PE Micronized Wax market, By Application, 2017-2022 (US$ Mn)

TABLE 124 Rest of Europe  PE Micronized Wax market, By Application, 2023-2030 (US$ Mn)

TABLE 125 Rest of Europe  PE Micronized Wax market, By End-Use Industry, 2017-2022 (US$ Mn)

TABLE 126 Rest of Europe  PE Micronized Wax market, By End-Use Industry, 2023-2030 (US$ Mn)

TABLE 127 Rest of Europe  PE Micronized Wax market, By Particle Size, 2017-2022 (US$ Mn)

TABLE 128 Rest of Europe  PE Micronized Wax market, By Particle Size, 2023-2030 (US$ Mn)

TABLE 129 Asia Pacific  PE Micronized Wax market, By Application, 2017-2022 (US$ Mn)

TABLE 130 Asia Pacific  PE Micronized Wax market, By Application, 2023-2030 (US$ Mn)

TABLE 131 Asia Pacific  PE Micronized Wax market, By End-Use Industry, 2017-2022 (US$ Mn)

TABLE 132 Asia Pacific  PE Micronized Wax market, By End-Use Industry, 2023-2030 (US$ Mn)

TABLE 133 Asia Pacific  PE Micronized Wax market, By Particle Size, 2017-2022 (US$ Mn)

TABLE 134 Asia Pacific  PE Micronized Wax market, By Particle Size, 2023-2030 (US$ Mn)

TABLE 135 China  PE Micronized Wax market, By Application, 2017-2022 (US$ Mn)

TABLE 136 China  PE Micronized Wax market, By Application, 2023-2030 (US$ Mn)

TABLE 137 China  PE Micronized Wax market, By End-Use Industry, 2017-2022 (US$ Mn)

TABLE 138 China  PE Micronized Wax market, By End-Use Industry, 2023-2030 (US$ Mn)

TABLE 139 China  PE Micronized Wax market, By Particle Size, 2017-2022 (US$ Mn)

TABLE 140 China  PE Micronized Wax market, By Particle Size, 2023-2030 (US$ Mn)

TABLE 141 Japan  PE Micronized Wax market, By Application, 2017-2022 (US$ Mn)

TABLE 142 Japan  PE Micronized Wax market, By Application, 2023-2030 (US$ Mn)

TABLE 143 Japan  PE Micronized Wax market, By End-Use Industry, 2017-2022 (US$ Mn)

TABLE 144 Japan  PE Micronized Wax market, By End-Use Industry, 2023-2030 (US$ Mn)

TABLE 145 Japan  PE Micronized Wax market, By Particle Size, 2017-2022 (US$ Mn)

TABLE 146 Japan  PE Micronized Wax market, By Particle Size, 2023-2030 (US$ Mn)

TABLE 147 India  PE Micronized Wax market, By Application, 2017-2022 (US$ Mn)

TABLE 148 India  PE Micronized Wax market, By Application, 2023-2030 (US$ Mn)

TABLE 149 India  PE Micronized Wax market, By End-Use Industry, 2017-2022 (US$ Mn)

TABLE 150 India  PE Micronized Wax market, By End-Use Industry, 2023-2030 (US$ Mn)

TABLE 151 India  PE Micronized Wax market, By Particle Size, 2017-2022 (US$ Mn)

TABLE 152 India  PE Micronized Wax market, By Particle Size, 2023-2030 (US$ Mn)

TABLE 153 South Korea  PE Micronized Wax market, By Application, 2017-2022 (US$ Mn)

TABLE 154 South Korea  PE Micronized Wax market, By Application, 2023-2030 (US$ Mn)

TABLE 155 South Korea  PE Micronized Wax market, By End-Use Industry, 2017-2022 (US$ Mn)

TABLE 156 South Korea  PE Micronized Wax market, By End-Use Industry, 2023-2030 (US$ Mn)

TABLE 157 South Korea  PE Micronized Wax market, By Particle Size, 2017-2022 (US$ Mn)

TABLE 158 South Korea  PE Micronized Wax market, By Particle Size, 2023-2030 (US$ Mn)

TABLE 159 South-East Asia  PE Micronized Wax market, By Application, 2017-2022 (US$ Mn)

TABLE 160 South-East Asia  PE Micronized Wax market, By Application, 2023-2030 (US$ Mn)

TABLE 161 South-East Asia  PE Micronized Wax market, By End-Use Industry, 2017-2022 (US$ Mn)

TABLE 162 South-East Asia  PE Micronized Wax market, By End-Use Industry, 2023-2030 (US$ Mn)

TABLE 163 South-East Asia  PE Micronized Wax market, By Particle Size, 2017-2022 (US$ Mn)

TABLE 164 South-East Asia  PE Micronized Wax market, By Particle Size, 2023-2030 (US$ Mn)

TABLE 165 Rest of Asia Pacific  PE Micronized Wax market, By Application, 2017-2022 (US$ Mn)

TABLE 166 Rest of Asia Pacific  PE Micronized Wax market, By Application, 2023-2030 (US$ Mn)

TABLE 167 Rest of Asia Pacific  PE Micronized Wax market, By End-Use Industry, 2017-2022 (US$ Mn)

TABLE 168 Rest of Asia Pacific  PE Micronized Wax market, By End-Use Industry, 2023-2030 (US$ Mn)

TABLE 169 Rest of Asia Pacific  PE Micronized Wax market, By Particle Size, 2017-2022 (US$ Mn)

TABLE 170 Rest of Asia Pacific  PE Micronized Wax market, By Particle Size, 2023-2030 (US$ Mn)

TABLE 171 Latin America  PE Micronized Wax market, By Application, 2017-2022 (US$ Mn)

TABLE 172 Latin America  PE Micronized Wax market, By Application, 2023-2030 (US$ Mn)

TABLE 173 Latin America  PE Micronized Wax market, By End-Use Industry, 2017-2022 (US$ Mn)

TABLE 174 Latin America  PE Micronized Wax market, By End-Use Industry, 2023-2030 (US$ Mn)

TABLE 175 Latin America  PE Micronized Wax market, By Particle Size, 2017-2022 (US$ Mn)

TABLE 176 Latin America  PE Micronized Wax market, By Particle Size, 2023-2030 (US$ Mn)

TABLE 177 Brazil  PE Micronized Wax market, By Application, 2017-2022 (US$ Mn)

TABLE 178 Brazil  PE Micronized Wax market, By Application, 2023-2030 (US$ Mn)

TABLE 179 Brazil  PE Micronized Wax market, By End-Use Industry, 2017-2022 (US$ Mn)

TABLE 180 Brazil  PE Micronized Wax market, By End-Use Industry, 2023-2030 (US$ Mn)

TABLE 181 Brazil  PE Micronized Wax market, By Particle Size, 2017-2022 (US$ Mn)

TABLE 182 Brazil  PE Micronized Wax market, By Particle Size, 2023-2030 (US$ Mn)

TABLE 183 Argentina  PE Micronized Wax market, By Application, 2017-2022 (US$ Mn)

TABLE 184 Argentina  PE Micronized Wax market, By Application, 2023-2030 (US$ Mn)

TABLE 185 Argentina  PE Micronized Wax market, By End-Use Industry, 2017-2022 (US$ Mn)

TABLE 186 Argentina  PE Micronized Wax market, By End-Use Industry, 2023-2030 (US$ Mn)

TABLE 187 Argentina  PE Micronized Wax market, By Particle Size, 2017-2022 (US$ Mn)

TABLE 188 Argentina  PE Micronized Wax market, By Particle Size, 2023-2030 (US$ Mn)

TABLE 189 Rest of Latin America  PE Micronized Wax market, By Application, 2017-2022 (US$ Mn)

TABLE 190 Rest of Latin America  PE Micronized Wax market, By Application, 2023-2030 (US$ Mn)

TABLE 191 Rest of Latin America  PE Micronized Wax market, By End-Use Industry, 2017-2022 (US$ Mn)

TABLE 192 Rest of Latin America  PE Micronized Wax market, By End-Use Industry, 2023-2030 (US$ Mn)

TABLE 193 Rest of Latin America  PE Micronized Wax market, By Particle Size, 2017-2022 (US$ Mn)

TABLE 194 Rest of Latin America  PE Micronized Wax market, By Particle Size, 2023-2030 (US$ Mn)

TABLE 195 Middle East PE Micronized Wax market, By Application, 2017-2022 (US$ Mn)

TABLE 196 Middle East PE Micronized Wax market, By Application, 2023-2030 (US$ Mn)

TABLE 197 Middle East PE Micronized Wax market, By End-Use Industry, 2017-2022 (US$ Mn)

TABLE 198 Middle East PE Micronized Wax market, By End-Use Industry, 2023-2030 (US$ Mn)

TABLE 199 Middle East PE Micronized Wax market, By Particle Size, 2017-2022 (US$ Mn)

TABLE 200 Middle East PE Micronized Wax market, By Particle Size, 2023-2030 (US$ Mn)

TABLE 201 UAE PE Micronized Wax market, By Application, 2017-2022 (US$ Mn)

TABLE 202 UAE PE Micronized Wax market, By Application, 2023-2030 (US$ Mn)

TABLE 203 UAE PE Micronized Wax market, By End-Use Industry, 2017-2022 (US$ Mn)

TABLE 204 UAE PE Micronized Wax market, By End-Use Industry, 2023-2030 (US$ Mn)

TABLE 205 UAE PE Micronized Wax market, By Particle Size, 2017-2022 (US$ Mn)

TABLE 206 UAE PE Micronized Wax market, By Particle Size, 2023-2030 (US$ Mn)

TABLE 207 Saudi Arabia PE Micronized Wax market, By Application, 2017-2022 (US$ Mn)

TABLE 208 Saudi Arabia PE Micronized Wax market, By Application, 2023-2030 (US$ Mn)

TABLE 209 Saudi Arabia PE Micronized Wax market, By End-Use Industry, 2017-2022 (US$ Mn)

TABLE 210 Saudi Arabia PE Micronized Wax market, By End-Use Industry, 2023-2030 (US$ Mn)

TABLE 211 Saudi Arabia PE Micronized Wax market, By Particle Size, 2017-2022 (US$ Mn)

TABLE 212 Saudi Arabia PE Micronized Wax market, By Particle Size, 2023-2030 (US$ Mn)

TABLE 213 Rest of Middle East PE Micronized Wax market, By Application, 2017-2022 (US$ Mn)

TABLE 214 Rest of Middle East PE Micronized Wax market, By Application, 2023-2030 (US$ Mn)

TABLE 215 Rest of Middle East PE Micronized Wax market, By End-Use Industry, 2017-2022 (US$ Mn)

TABLE 216 Rest of Middle East PE Micronized Wax market, By End-Use Industry, 2023-2030 (US$ Mn)

TABLE 217 Rest of Middle East PE Micronized Wax market, By Particle Size, 2017-2022 (US$ Mn)

TABLE 218 Rest of Middle East PE Micronized Wax market, By Particle Size, 2023-2030 (US$ Mn)

TABLE 219 Africa PE Micronized Wax market, By Application, 2017-2022 (US$ Mn)

TABLE 220 Africa PE Micronized Wax market, By Application, 2023-2030 (US$ Mn)

TABLE 221 Africa PE Micronized Wax market, By End-Use Industry, 2017-2022 (US$ Mn)

TABLE 222 Africa PE Micronized Wax market, By End-Use Industry, 2023-2030 (US$ Mn)

TABLE 223 Africa PE Micronized Wax market, By Particle Size, 2017-2022 (US$ Mn)

TABLE 224 Africa PE Micronized Wax market, By Particle Size, 2023-2030 (US$ Mn)

TABLE 225 South Africa PE Micronized Wax market, By Application, 2017-2022 (US$ Mn)

TABLE 226 South Africa PE Micronized Wax market, By Application, 2023-2030 (US$ Mn)

TABLE 227 South Africa PE Micronized Wax market, By End-Use Industry, 2017-2022 (US$ Mn)

TABLE 228 South Africa PE Micronized Wax market, By End-Use Industry, 2023-2030 (US$ Mn)

TABLE 229 South Africa PE Micronized Wax market, By Particle Size, 2017-2022 (US$ Mn)

TABLE 230 South Africa PE Micronized Wax market, By Particle Size, 2023-2030 (US$ Mn)

TABLE 231 Egypt PE Micronized Wax market, By Application, 2017-2022 (US$ Mn)

TABLE 232 Egypt PE Micronized Wax market, By Application, 2023-2030 (US$ Mn)

TABLE 233 Egypt PE Micronized Wax market, By End-Use Industry, 2017-2022 (US$ Mn)

TABLE 234 Egypt PE Micronized Wax market, By End-Use Industry, 2023-2030 (US$ Mn)

TABLE 235 Egypt PE Micronized Wax market, By Particle Size, 2017-2022 (US$ Mn)

TABLE 236 Egypt PE Micronized Wax market, By Particle Size, 2023-2030 (US$ Mn)

TABLE 237 Rest of Africa PE Micronized Wax market, By Application, 2017-2022 (US$ Mn)

TABLE 238 Rest of Africa PE Micronized Wax market, By Application, 2023-2030 (US$ Mn)

TABLE 239 Rest of Africa PE Micronized Wax market, By End-Use Industry, 2017-2022 (US$ Mn)

TABLE 240 Rest of Africa PE Micronized Wax market, By End-Use Industry, 2023-2030 (US$ Mn)

TABLE 241 Rest of Africa PE Micronized Wax market, By Particle Size, 2017-2022 (US$ Mn)

TABLE 242 Rest of Africa PE Micronized Wax market, By Particle Size, 2023-2030 (US$ Mn)

Frequently Asked Questions

What is the current Species of the worldwide PE Micronized Wax market?

In 2022, the global PE Micronized Wax market is expected to be worth USD XX million.

What is the predicted growth rate of the PE Micronized Wax market between 2023 and 2030?

The PE Micronized Wax market is estimated to increase at a CAGR of 4.50% between 2023 and 2030, reaching USD XX Million in 2030.

Which segment has the most market share in terms of Application?

The PE Micronized Wax market, specifically the coatings and inks segment

Which partical size  segment governs the market demand for PE Micronized Wax?

The micronized sector defines the market demand for PE Micronized Wax

Which End-user industry segment is predicted to grow at the fastest growing segment over the forecast period?

The construction sector is the fastest growing section of the PE Micronized Wax market

Which region is driving the PE Micronized Wax industry forward?

Asia-Pacific will account for up to 42% of the PE Micronized Wax market by 2022

Who are the major players in the global PE Micronized Wax market?

The top players include BASF, Sasol, Clariant, Honeywell, Lubrizol, MÃœNZING Corporation, MPI, Nanjing Tianshi, Michelman, Shamrock Technologies, Ceronas.

What are the major market drivers of the PE Micronized Wax industry?

Growing demand in coatings, printing inks, plastics, and rubber sectors, Increasing need for high-performance additives and Continuous innovation and product development are the main drivers of the market

What are the major market restraints of the PE Micronized Wax industry?

The market’s main hurdles are potential environmental concerns and laws, fluctuating raw material prices, and intense competition.

What are the major market opportunities of the PE Micronized Wax industry?

The significant opportunities in the market are expansion into new geographical regions, development of eco-friendly and sustainable products, and collaborations and partnerships for market growth.

Micro Perforation Machines Market

Published:
Report ID: 75590

Congenital Adrenal Hyperplasia Treatment Market

Published:
Report ID: 75587

Commercial Beverage Dispenser Market

Published:
Report ID: 75541

Europe Data Center Renovation Market

Published:
Report ID: 75495

High Temperature Adhesive  Market

Published:
Report ID: 75379

Europe AC-DC Power Supply in Data Center Market

Published:
Report ID: 75202

Marine Suspension Seat Bases Market

Published:
Report ID: 75180

France Adult Diaper Market

Published:
Report ID: 75131

Hypersensitivity Pneumonitis Market

Published:
Report ID: 75098

Inorganic Flame Retardants Market

Published:
Report ID: 75396

High Temperature Adhesive  Market

Published:
Report ID: 75379

Alpha-Amylase Baking Enzyme Market

Published:
Report ID: 75344

Lecithin and Phospholipids Market

Published:
Report ID: 75185

Agricultural Grade Zinc Chemical Market

Published:
Report ID: 75157

Aerospace Adhesives and Sealants Market

Published:
Report ID: 75142

Lauryl Dimethyl Amine Oxide Market

Published:
Report ID: 75130

Agricultural Activator Adjuvant Market

Published:
Report ID: 70806

Direct Methanol Fuel Cell Market

Published:
Report ID: 74942

Full Container Shrink Sleeves Market

Published:
Report ID: 74929

Foamed Polypropylene Films Market

Published:
Report ID: 74884

Heavy Oil Cracking Catalyst Market

Published:
Report ID: 74868

Purchase Options

The report comes as a view-only PDF document, optimized for individual clients. This version is recommended for personal digital use and does not allow printing.
$4699

To meet the needs of modern corporate teams, our report comes in two formats: a printable PDF and a data-rich Excel sheet. This package is optimized for internal analysis and multi-location access, making it an excellent choice for organizations with distributed workforce.
$5699

The report will be delivered in printable PDF format along with the report’s data Excel sheet. This license offers 100 Free Analyst hours where the client can utilize Credence Research Inc.’s research team. It is highly recommended for organizations seeking to execute short, customized research projects related to the scope of the purchased report.
$7699

Smallform of Sample request

Have a question?

User Profile

Don’t settle for less – trust Mitul to help you find the best solution.

Report delivery within 24 to 48 hours

– Other Info –

What people say?-

User Review

I am very impressed with the information in this report. The author clearly did their research when they came up with this product and it has already given me a lot of ideas.

Jana Schmidt
CEDAR CX Technologies

– Connect with us –


support

24/7 Research Support


– Research Methodology –

Going beyond the basics: advanced techniques in research methodology

– Trusted By –

Pepshi, LG, Nestle
Motorola, Honeywell, Johnson and johnson
LG Chem, SIEMENS, Pfizer
Unilever, Samsonite, QIAGEN