Home » Consumer Goods » Philippines and Global Sustainable Seafood Market

Philippines and Global Sustainable Seafood Market By Sourcing Methods (Wild-Caught Seafood, Farmed/Aquaculture Seafood, Hybrid Sourcing); By Species (Tuna, Shrimp, Salmon, Mackerel, Tilapia, Sardines, Others); By Certification Standards (Marine Stewardship Council [MSC], Aquaculture Stewardship Council [ASC], Fair Trade Certified, Friend of the Sea [FOS], Global Aquaculture Alliance [GAA], Others); By Distribution Channel (Supermarkets & Hypermarkets, Specialty Seafood Stores, Online Retail, Foodservice [Hotels, Restaurants, Catering], Wholesalers, Others) – Growth, Share, Opportunities & Competitive Analysis, 2024 – 2032

Report ID: 157596 | Report Format : Excel, PDF

Market Overview:

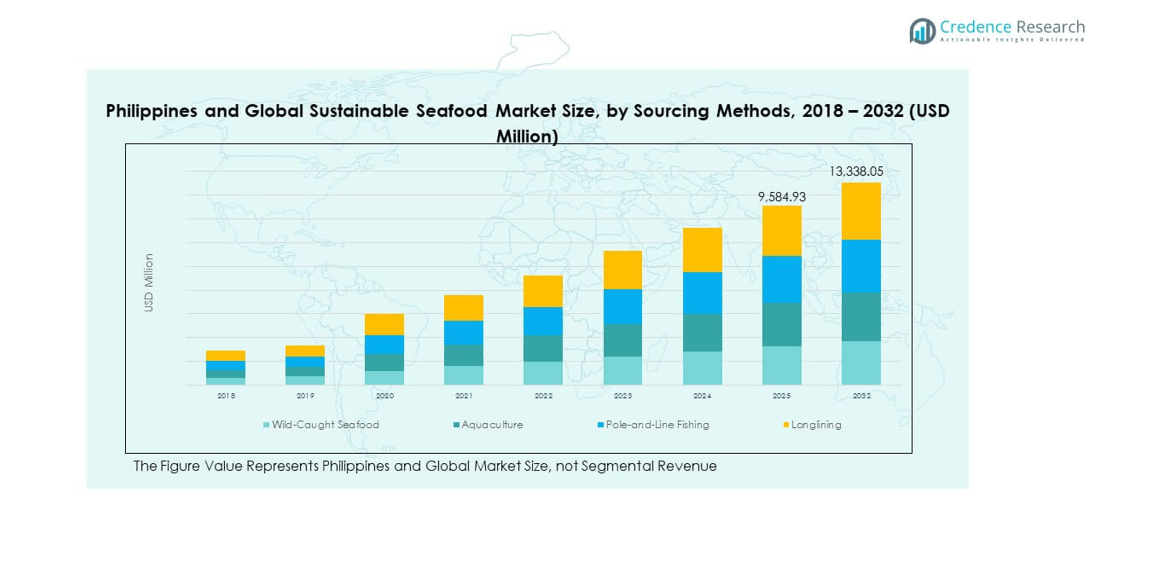
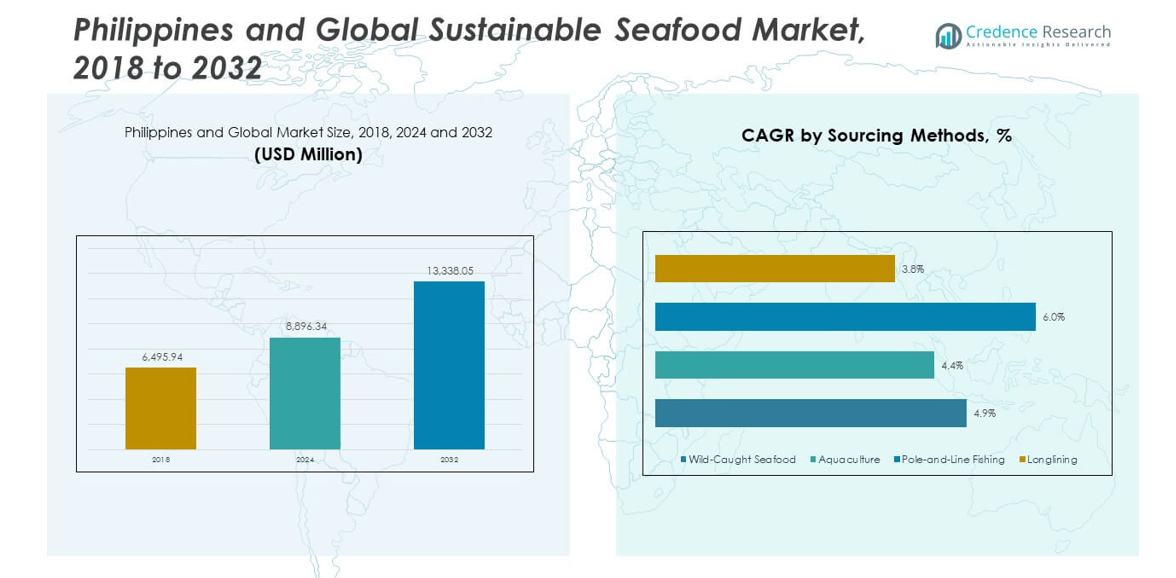
The Philippines and Global Sustainable Seafood Market size was valued at USD 6,495.94 million in 2018, grew to USD 8,896.34 million in 2024, and is anticipated to reach USD 13,338.05 million by 2032, at a CAGR of 4.83% during the forecast period.

REPORT ATTRIBUTE DETAILS
Historical Period 2020-2023
Base Year 2024
Forecast Period 2025-2032
Philippines and Global Sustainable Seafood Market Size 2024 USD 8,896.34 million
Philippines and Global Sustainable Seafood Market, CAGR 4.83%
Philippines and Global Sustainable Seafood Market Size 2032 USD 13,338.05 million


The market growth is driven by the rising focus on responsible fishing practices and eco-certifications. Consumers are increasingly aware of overfishing, pollution, and the need for traceable seafood sources. It benefits from government initiatives promoting sustainable aquaculture, along with seafood brands committing to certified sourcing. Retailers and restaurants are expanding partnerships with suppliers following Marine Stewardship Council (MSC) or Aquaculture Stewardship Council (ASC) standards.

Regionally, North America and Europe lead the market due to strong environmental policies and consumer preference for ethically sourced seafood. The Asia-Pacific region, particularly the Philippines, Japan, and Indonesia, is emerging rapidly with expanding sustainable aquaculture systems. Latin America and Africa show growing adoption supported by international aid and trade initiatives promoting responsible marine resource management.

Philippines and Global Sustainable Seafood Market size

Market Insights:

  • The Philippines and Global Sustainable Seafood Market was valued at USD 6,495.94 million in 2018, grew to USD 8,896.34 million in 2024, and is projected to reach USD 13,338.05 million by 2032, registering a CAGR of 4.83% during the forecast period.
  • Asia Pacific holds the highest market share at 35%, driven by strong aquaculture capacity and export growth, followed by North America (25%) and Europe (20%), supported by advanced certification frameworks and high consumer demand for traceable seafood.
  • Asia Pacific remains the fastest-growing region with its 35% share, supported by government initiatives, sustainable aquaculture expansion, and rapid adoption of traceability technologies across major producing nations.
  • Wild-Caught Seafood accounts for approximately 45% of total market share due to continued consumer preference for natural-caught varieties and strong export demand from major fishing nations.
  • Aquaculture contributes nearly 40% of the market share, reflecting advances in sustainable hatchery systems, eco-friendly feeds, and improved production consistency to meet global sustainability standards.

Access crucial information at unmatched prices!

Request your sample report today & start making informed decisions powered by Credence Research Inc.!

Download Sample

Market Drivers:

Rising Global Demand for Eco-Certified and Traceable Seafood

The growing preference for sustainable and traceable seafood is a key force driving the Philippines and Global Sustainable Seafood Market. Consumers are increasingly aware of the environmental damage caused by overfishing and illegal fishing practices. It benefits from expanding certifications like MSC and ASC that ensure responsible sourcing. Retailers and restaurants prefer certified suppliers to align with sustainability goals. The rising health consciousness among consumers boosts seafood consumption due to its nutritional value. Government campaigns promoting ethical seafood choices further support adoption. Major retailers in Asia and Europe now demand traceable supply chains for seafood. This shift continues to influence global fishing and aquaculture operations toward responsible management.

  • For instance, the Marine Stewardship Council (MSC) reports that more than 45,000 sites worldwide are certified under its Chain of Custody standard.

Strong Government and NGO Initiatives Supporting Sustainable Aquaculture

Government and non-government organizations are actively supporting the adoption of sustainable aquaculture practices. The Philippines’ Bureau of Fisheries and Aquatic Resources (BFAR) promotes eco-friendly aquaculture technologies to protect marine ecosystems. The Global Sustainable Seafood Market benefits from policy support for fishery management, habitat restoration, and anti-illegal fishing enforcement. International agencies such as WWF and FAO drive collaborative projects that train local communities. It leads to higher yields and reduced ecological footprint. Countries across Southeast Asia are investing in sustainable hatcheries and feed innovation. Strong regulatory frameworks and funding support make sustainable production economically viable. These actions improve the competitiveness of sustainable seafood producers worldwide.

  • For instance, the GARLAND study on integrated multi-trophic aquaculture showed up to 80–90% improvement in bioremediation of nutrients compared to monoculture systems.

Technological Advancements Enhancing Monitoring and Supply Chain Transparency

Innovation in monitoring and data systems strengthens sustainability verification across seafood supply chains. Technologies like blockchain, IoT, and satellite tracking provide end-to-end traceability of fish products. The Philippines and Global Sustainable Seafood Market leverages these tools to prevent mislabeling and illegal catches. It enables authorities and companies to validate sources efficiently. Automated aquaculture management tools enhance productivity and water quality control. Startups are developing digital solutions for real-time tracking of fishing fleets. AI-based analytics help predict demand and minimize waste. These advancements build consumer trust and ensure transparency in global seafood trade.

Growing Corporate Commitments and Retailer-Led Sustainability Programs

Corporate responsibility programs are expanding sustainability efforts in the seafood industry. Global retailers and foodservice companies are partnering with NGOs to source only certified seafood. It encourages suppliers to meet environmental and ethical standards. The Philippines and Global Sustainable Seafood Market gains from such collaboration as it drives responsible practices across production networks. Leading brands now publish annual sustainability reports highlighting progress toward traceable sourcing. Supplier audits and compliance verification enhance accountability. This coordinated action among supply chain players boosts market integrity. It also fosters a positive brand image for companies adhering to responsible seafood sourcing.

Market Trends:

Expansion of Aquaculture Practices Using Circular and Regenerative Systems

Aquaculture operations are shifting toward circular systems that reuse resources and minimize waste. The Philippines and Global Sustainable Seafood Market observes growing use of recirculating aquaculture systems (RAS) and integrated multi-trophic aquaculture. These models reduce environmental impact and enhance efficiency. It helps mitigate pressure on wild fish stocks. Companies are investing in green technologies to meet eco-certification standards. Feed innovation using algae and insect protein is gaining adoption. These practices contribute to lower emissions and sustainable output. The adoption of closed-loop aquaculture models is expected to expand across emerging markets.

  • For instance, studies indicate RAS can reduce water consumption by up to 99% compared with traditional systems. It helps mitigate pressure on wild fish stocks. Companies are investing in green technologies to meet eco-certification standards. Feed innovation using algae and insect protein is gaining adoption.

Rise of Digital Platforms for Direct Consumer Engagement and Transparency

Digital platforms now connect seafood producers directly with eco-conscious consumers. The Philippines and Global Sustainable Seafood Market experiences rapid digitization of seafood sales and supply chain management. It allows traceability and provides consumers with sourcing details. Mobile apps and QR code-based labeling let users verify product origins instantly. Online marketplaces highlight certified and sustainable seafood options. These systems build trust and support premium pricing. E-commerce growth further amplifies visibility for sustainable brands. The integration of digital platforms strengthens transparency and supports responsible consumption.

  • For instance, the Global Dialogue on Seafood Traceability (GDST) reports that efforts toward interoperable digital seafood supply-chain data accelerated significantly in 2024. Mobile apps and QR-code-based labelling let users verify product origins instantly. Online marketplaces highlight certified and sustainable seafood options.

Increased Collaboration Between Industry Players and Certification Bodies

Partnerships between producers, regulators, and certification agencies are reshaping sustainability standards. The Philippines and Global Sustainable Seafood Market benefits from harmonized certification systems and shared verification frameworks. It promotes consistency in sustainability claims across countries. Joint programs help small-scale fishers gain certification through training and cooperative models. Retailers, NGOs, and governments collaborate to reduce barriers for certification adoption. These alliances expand the global footprint of sustainable seafood initiatives. Enhanced traceability and harmonized reporting boost confidence among international buyers. Such collaborations continue to elevate environmental responsibility across the industry.

Shifts Toward Plant-Based and Alternative Seafood Products

The growing acceptance of plant-based seafood substitutes is transforming consumer choices. It aligns with sustainability and ethical consumption goals. The Philippines and Global Sustainable Seafood Market observes major food innovators launching algae-based and cell-cultured seafood. These products reduce reliance on ocean resources and address overfishing concerns. Consumer acceptance grows with improved texture and nutritional quality. The introduction of hybrid seafood combining plant and fish proteins is also gaining traction. Startups and established food manufacturers are investing in R&D to refine flavor authenticity. This trend diversifies market offerings while supporting ecological balance.

Philippines and Global Sustainable Seafood Market share

Market Challenges Analysis:

High Production Costs and Limited Access to Sustainable Inputs

The Philippines and Global Sustainable Seafood Market faces rising production costs due to the expense of certified feeds, renewable energy integration, and quality monitoring tools. Many small-scale fisheries and aquaculture operators struggle to access sustainable inputs or technologies. It limits their ability to compete with large-scale producers. Feed alternatives like insect or algae protein remain costlier than traditional fishmeal. Regulatory compliance also adds financial pressure through audits and reporting systems. Infrastructure limitations in developing regions hinder efficient distribution and cold-chain management. Lack of financial incentives further discourages widespread adoption of sustainable practices. Addressing cost barriers is vital for scaling responsible seafood production globally.

Inadequate Enforcement of Regulations and Weak Global Coordination

Weak enforcement mechanisms in certain regions threaten sustainability progress in the seafood sector. The Philippines and Global Sustainable Seafood Market struggles with fragmented regulatory oversight and inconsistent implementation of fishing laws. It allows illegal, unreported, and unregulated fishing to persist in many waters. Limited international cooperation complicates efforts to manage shared marine resources. Data collection gaps restrict accurate stock assessments and sustainability certification. Cross-border trade in non-certified seafood undermines fair competition. Capacity-building programs often lack funding to sustain long-term impact. Stronger global governance and regional coordination are necessary to protect marine biodiversity and resource integrity.

Market Opportunities:

Expansion of Sustainable Aquaculture and Certification Programs in Emerging Markets

Emerging economies are witnessing strong potential for sustainable aquaculture expansion. The Philippines and Global Sustainable Seafood Market benefits from international investments that promote eco-friendly hatcheries and advanced feed technologies. It creates inclusive growth opportunities for local fishing communities. The increasing collaboration between governments and NGOs supports certification training programs. Developing regions can leverage low-cost innovations to boost production while protecting ecosystems. Certification growth among small-scale producers will enhance global seafood supply diversity. Investors see this segment as a stable, long-term opportunity in responsible food systems. The expansion of training initiatives ensures economic inclusion and improved livelihood outcomes.

Adoption of Digital Traceability and Green Logistics Solutions

Digitalization and logistics modernization open new pathways for growth. The Philippines and Global Sustainable Seafood Market is adopting blockchain and IoT technologies to ensure real-time tracking of seafood origins. It enhances transparency and strengthens brand credibility across global markets. Smart logistics systems reduce energy waste and carbon emissions in distribution. E-commerce expansion enables certified seafood brands to reach a broader audience. Governments and private firms are investing in green infrastructure to support sustainable transport. Integration of renewable-powered cold chains can boost efficiency. These factors create long-term growth prospects for companies aligned with environmental and ethical standards.

Market Segmentation Analysis:

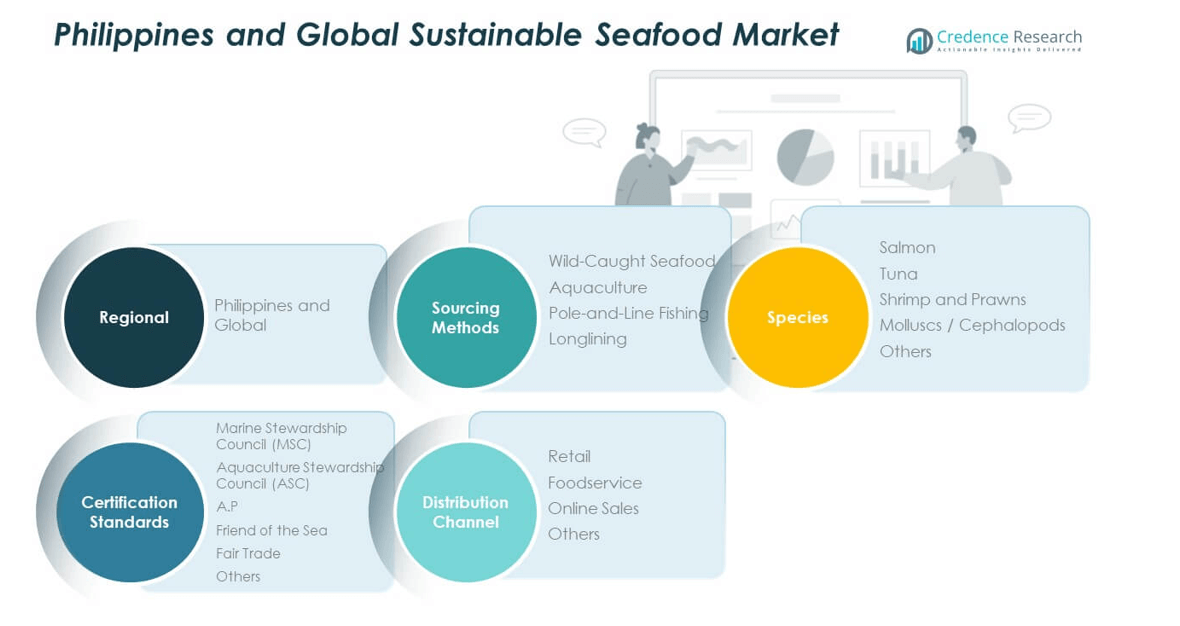
By Sourcing Methods

The Philippines and Global Sustainable Seafood Market is divided into wild-caught, farmed or aquaculture, and hybrid sourcing. Wild-caught seafood remains vital due to its premium taste and natural nutrition profile. Farmed seafood is expanding with improved hatchery technology and sustainable feed systems. It supports consistent supply and reduces strain on wild fish populations. Hybrid sourcing combines capture and aquaculture advantages, offering supply stability and quality control. Companies are focusing on responsible fishing practices and traceability programs to enhance consumer trust. This diversification strengthens seafood availability across global supply chains.

  • For instance, Cargill Aqua Nutrition reported in its 2017 sustainability report that it produced nearly 1.49 million tonnes of aquaculture feed across more than 30 species, with nearly 30% of raw material tonnage coming from by-products. It supports consistent supply and reduces strain on wild fish populations.

By Species

The market includes tuna, shrimp, salmon, mackerel, tilapia, sardines, and others. Tuna leads due to its global demand in both canned and fresh formats. Shrimp and salmon show strong growth supported by aquaculture innovation and export potential. Mackerel and tilapia cater to affordable protein needs in developing nations. Sardines dominate local consumption in the Philippines due to cultural and economic relevance. Other niche species attract premium consumers seeking variety. Species diversification enhances resilience and reduces ecological risks tied to overfishing.

  • For instance, Calysta Inc. and its partner Cargill Inc. developed the FeedKind® protein for aquaculture, aiming for 20,000 metric tonnes per annum production initially and scaling to 200,000 tonnes per annum—supporting species such as salmon and tilapia. Sardines dominate local consumption in the Philippines due to cultural and economic relevance.

By Certification Standards

Key certifications such as MSC, ASC, Fair Trade, FOS, and GAA ensure product credibility and sustainability compliance. Certified seafood builds consumer confidence and meets retailer procurement requirements. It improves international market access for producers adhering to environmental and ethical benchmarks. Certification adoption is rising among both large processors and small cooperatives.

By Distribution Channel

Distribution spans supermarkets, specialty stores, online retail, foodservice, and wholesalers. Supermarkets dominate due to visibility and trust. Online retail is growing quickly, offering traceable seafood to informed consumers. Foodservice channels demand bulk-certified supply to meet sustainable sourcing commitments.

Philippines and Global Sustainable Seafood Market segmentation

Segmentation:

  • By Sourcing Methods
    • Wild-Caught Seafood
    • Farmed/Aquaculture Seafood
    • Hybrid Sourcing
  • By Species
    • Tuna
    • Shrimp
    • Salmon
    • Mackerel
    • Tilapia
    • Sardines
    • Others
  • By Certification Standards
    • Marine Stewardship Council (MSC)
    • Aquaculture Stewardship Council (ASC)
    • Fair Trade Certified
    • Friend of the Sea (FOS)
    • Global Aquaculture Alliance (GAA)
    • Others
  • By Distribution Channel
    • Supermarkets & Hypermarkets
    • Specialty Seafood Stores
    • Online Retail
    • Foodservice (Hotels, Restaurants, Catering)
    • Wholesalers
    • Others
  • By Region (Global Scope)
    • North America
      • U.S.
      • Canada
      • Mexico
    • Europe
      • Germany
      • France
      • U.K.
      • Italy
      • Spain
      • Rest of Europe
    • Asia Pacific
      • China
      • Japan
      • India
      • South Korea
      • South-east Asia
      • Rest of Asia Pacific
    • Latin America
      • Brazil
      • Argentina
      • Rest of Latin America
    • Middle East & Africa
      • GCC Countries
      • South Africa
      • Rest of the Middle East and Africa

Regional Analysis:

Asia Pacific

Asia Pacific leads the Philippines and Global Sustainable Seafood Market with a 35% share, driven by strong aquaculture production and large-scale exports. The Philippines, China, Indonesia, and Vietnam are major contributors, supported by abundant marine resources and advanced farming systems. It benefits from government initiatives promoting sustainable aquaculture, responsible fishing, and export diversification. Demand for eco-certified seafood is growing among middle-income consumers seeking healthier and traceable food options. The presence of major seafood processors enhances regional competitiveness. Rising investment in hatchery innovation and cold-chain infrastructure strengthens the region’s market dominance. Asia Pacific remains the fastest-growing regional segment supported by favorable trade policies and sustainability programs.

North America

North America accounts for 25% of the total market share, backed by advanced sustainability frameworks and consumer preference for traceable seafood. The United States and Canada lead the regional market with strong certification compliance and digitalized supply chains. It benefits from growing awareness of ethical consumption and environmental conservation. Retailers and restaurants emphasize sustainable sourcing as part of their procurement policies. Demand for premium seafood such as salmon, shrimp, and tuna continues to rise. The region also invests in alternative proteins and low-carbon aquaculture to meet environmental goals. These factors establish North America as a mature and innovation-driven seafood market.

Europe

Europe holds a 20% share in the global market, supported by strict environmental regulations and high adoption of certification standards like MSC and ASC. It leads in implementing traceability and labelling systems ensuring product transparency. The region’s consumers prioritize eco-friendly seafood and sustainability credentials. It benefits from strong coordination between governments, NGOs, and retailers to improve fishing practices. Northern Europe, particularly Norway and Denmark, drives sustainable aquaculture through R&D investments. Southern countries such as Spain and Italy maintain steady import demand for processed and frozen seafood. Europe continues to shape global sustainability norms through regulatory influence and responsible sourcing practices.

Shape Your Report to Specific Countries or Regions & Enjoy 30% Off!

 Key Player Analysis:

  • Phil-Union Frozen Foods, Inc. (PUFFI)
  • Meliomar Inc.
  • Century Pacific Food, Inc.
  • Fisher Farms Incorporated
  • Philbest Canning Co.
  • Akai Foods, Inc.
  • Better Seafood Philippines
  • High Liner Foods Inc.
  • Thai Union Group PCL
  • Maruha Nichiro Corporation
  • Nippon Suisan Kaisha Ltd. (Nissui)
  • Royal Greenland A/S
  • Nueva Pescanova Group
  • Pacific Seafood Group
  • Trident Seafoods Corporation
  • Austevoll Seafood ASA
  • Clearwater Seafoods Inc.
  • Charoen Pokphand Foods Public Company Limited (CP Foods)
  • Marine Harvest ASA (Mowi ASA)
  • Dongwon Industries Co., Ltd.

Competitive Analysis:

The Philippines and Global Sustainable Seafood Market is moderately fragmented, featuring a mix of multinational corporations and regional producers. Leading players focus on eco-certification, vertical integration, and traceable supply chains to maintain competitiveness. It benefits from rising consumer demand for responsibly sourced seafood, pushing companies to strengthen partnerships with certification bodies such as MSC and ASC. Firms are investing in digital tracking, sustainable aquaculture systems, and cold-chain logistics to ensure product integrity. Local enterprises are aligning with export-oriented standards to capture niche markets in Europe and North America. Strategic alliances and continuous R&D investments enhance competitiveness and operational efficiency across the industry.

Recent Developments:

  • In October 2025, Century Pacific Food, Inc. received international recognition when its vegan “unMeat Tuna in Water” was named Best Vegan Fish 2025 by PETA UK, reinforcing Century’s commitment to sustainable and plant-forward food innovation. The company has also underscored its leadership in tuna sustainability and compliance with global conservation measures through packaging and supply chain upgrades.
  • On June 30, 2025, High Liner Foods Incorporated completed the acquisition of leading U.S. seafood brands Mrs. Paul’s and Van de Kamp’s from Conagra Brands, Inc., expanding its U.S. retail footprint and securing additional volume for sustainable seafood distribution.
  • On May 28, 2025, Maruha Nichiro Corporation and UMAMI Bioworks Pte Ltd. launched a joint development project to commercialize cell-cultivated bluefin tuna, advancing alternative sustainable seafood technologies.
  • In April 2025, Meliomar Inc. achieved Certified B Corporation status, joining a global community dedicated to high standards for social and environmental impact. Meliomar also recently launched the Blueyou seafood brand in the Philippines, emphasizing traceable, high-quality, and responsibly sourced seafood in partnership with local fishing communities and global sustainability organizations.

Report Coverage:

The research report offers an in-depth analysis based on sourcing methods, species, certification standards, and distribution channels. It details leading market players, providing an overview of their business, product offerings, investments, revenue streams, and key applications. Additionally, the report includes insights into the competitive environment, SWOT analysis, current market trends, as well as the primary drivers and constraints. Furthermore, it discusses various factors that have driven market expansion in recent years. The report also explores market dynamics, regulatory scenarios, and technological advancements that are shaping the industry. It assesses the impact of external factors and global economic changes on market growth. Lastly, it provides strategic recommendations for new entrants and established companies to navigate the complexities of the market.

Future Outlook:

  • Rising consumer awareness will drive demand for certified and traceable seafood.
  • Expansion of sustainable aquaculture will strengthen regional production capacity.
  • Adoption of blockchain and IoT will enhance transparency across supply chains.
  • Partnerships between global NGOs and producers will boost responsible sourcing.
  • Government incentives will encourage eco-friendly aquaculture investments.
  • Retailers will expand sustainable product lines across premium and mass segments.
  • Export opportunities will grow with stricter international sustainability standards.
  • Technological innovation will improve feed efficiency and water management.
  • Market players will focus on carbon-neutral fishing and packaging solutions.
  • The industry will see stronger alignment with global climate and biodiversity goals.

CHAPTER NO. 1 : INTRODUCTION 22

1.1. Report Description 22

Purpose of the Report 22

USP & Key Offerings 22

1.2. Key Benefits for Stakeholders 23

1.3. Target Audience 23

CHAPTER NO. 2 : EXECUTIVE SUMMARY 24

CHAPTER NO. 3 : PHILIPPINES AND GLOBAL SUSTAINABLE SEAFOOD MARKET FORCES & INDUSTRY PULSE 27

3.1. Foundations of Change – Market Overview 27

3.2. Catalysts of Expansion – Key Market Drivers 29

3.3. Momentum Boosters – Growth Triggers 30

3.4. Innovation Fuel – Disruptive Technologies 30

3.5. Headwinds & Crosswinds – Market Restraints 31

3.6. Regulatory Tides – Compliance Challenges 32

3.7. Economic Frictions – Inflationary Pressures 32

3.8. Untapped Horizons – Growth Potential & Opportunities  and Strategic Navigation – Industry Frameworks 33

3.9. Market Equilibrium – Porter’s Five Forces 34

3.10. Ecosystem Dynamics – Value Chain Analysis 36

3.11. Macro Forces – PESTEL Breakdown 38

3.12. Price Trend Analysis 40

3.12.1. Country-wise Price Trend 41

3.12.2. Price Trend by Product 41

3.12.3. Price and Consumer Behavior 41

3.13. Buying Criteria 42

3.14. Top 20 Seafood in the Philippines 43

3.15. Share of Business of Fresh, Frozen, dried, and processed seafood in the Philippine Market 44

3.16. Key Insights National Capital Region (NCR) 45

CHAPTER NO. 4 : COMPETITION ANALYSIS 46

4.1. Company Market Share Analysis 46

4.1.1. Philippines and Global Sustainable Seafood Market Company Volume Market Share 46

4.1.2. Philippines and Global Sustainable Seafood Market Company Revenue Market Share 48

4.2. Strategic Developments 50

4.2.1. Acquisitions & Mergers 50

4.2.2. New Product Launch 51

4.2.3. Agreements & Collaborations 52

4.3. Competitive Dashboard 53

4.4. Company Assessment Metrics, 2024 54

CHAPTER NO. 5 : PHILIPPINES MARKET ANALYSIS, INSIGHTS & FORECAST, BY SOURCING METHODS 55

CHAPTER NO. 6 : PHILIPPINES MARKET ANALYSIS, INSIGHTS & FORECAST, BY SPECIES 59

CHAPTER NO. 7 : PHILIPPINES MARKET ANALYSIS, INSIGHTS & FORECAST, BY CERTIFICATION STANDARDS 64

CHAPTER NO. 8 : PHILIPPINES MARKET ANALYSIS, INSIGHTS & FORECAST, BY DISTRIBUTION CHANNEL 69

CHAPTER NO. 9 : PHILIPPINES AND GLOBAL MARKET ANALYSIS, INSIGHTS & FORECAST 74

CHAPTER NO. 10 : COMPANY PROFILE 86

10.1. Phil Union Frozen Foods, Inc. (PUFFI) 86

10.2. Meliomar Inc. 89

10.3. Century Pacific Food, Inc. 89

10.4. Fisher Farms Incorporated 89

10.5. Philbest Canning Co. 89

10.6. Akai Foods, Inc. 89

10.7. Better Seafood Philippines 89

10.8. Company 8 89

10.9. Company 9 89

10.10. Company 10 89

10.11. Company 11 89

10.12. Company 12 89

10.13. Company 13 89

10.14. Company 14 89

List of Figures

FIG NO. 1. Sustainable Seafood Market Revenue Share, By Sourcing Methods, 2026 & 2030 55

FIG NO. 2. Market Attractiveness Analysis, By Sourcing Methods 56

FIG NO. 3. Incremental Revenue Growth Opportunity by Sourcing Methods, 2026 – 2030 57

FIG NO. 4. Sustainable Seafood Market Revenue Share, By Species, 2026 & 2030 59

FIG NO. 5. Incremental Revenue Growth Opportunity by Species, 2026 – 2030 60

FIG NO. 6. Incremental Revenue Growth Opportunity by Species, 2026 – 2030 61

FIG NO. 7. Sustainable Seafood Market Revenue Share, By Certification Standards, 2026 & 2030 64

FIG NO. 8. Market Attractiveness Analysis, By Certification Standards 65

FIG NO. 9. Incremental Revenue Growth Opportunity by Certification Standards, 2026 – 2030 66

FIG NO. 10. Sustainable Seafood Market Revenue Share, By Distribution Channel, 2026 & 2030 69

FIG NO. 11. Market Attractiveness Analysis, By Distribution Channel 70

FIG NO. 12. Incremental Revenue Growth Opportunity by Distribution Channel, 2026 – 2030 71

FIG NO. 13. Sustainable Seafood Market Revenue Share, By Region, 2026 & 2030 74

FIG NO. 14. Market Attractiveness Analysis, By Region 75

FIG NO. 15. Incremental Revenue Growth Opportunity by Region, 2026 – 2030 76

List of Tables

TABLE NO. 1. : Top 20 Seafood in the Philippines 43

TABLE NO. 2. : Share of Business of Fresh, Frozen, dried, and processed seafood in the Philippine Market 44

TABLE NO. 3. : Philippines Sustainable Seafood Market Revenue, By Sourcing Methods, 2026 – 2030 (USD Million) 58

TABLE NO. 4. : Philippines Sustainable Seafood Market Volume, By Sourcing Methods, 2026 – 2030 (Metric Tons) 58

TABLE NO. 5. : Philippines Sustainable Seafood Market Revenue, By Species, 2026 – 2030 (USD Million) 62

TABLE NO. 6. : Philippines Sustainable Seafood Market Volume, By Species, 2026 – 2030 (Metric Tons) 63

TABLE NO. 7. : Philippines Sustainable Seafood Market Revenue, By  Certification Standards, 2026 – 2030 (USD Million) 67

TABLE NO. 8. : Philippines Sustainable Seafood Market Volume, By  Certification Standards, 2026 – 2030 (Metric Tons) 68

TABLE NO. 9. : Philippines Sustainable Seafood Market Revenue, By Distribution Channel, 2026 – 2030 (USD Million) 72

TABLE NO. 10. : Philippines Sustainable Seafood Market Volume, By Distribution Channel, 2026 – 2030 (Metric Tons) 73

TABLE NO. 11. : Global Sustainable Seafood Market Revenue, By Region, 2026 – 2030 (USD Million) 77

TABLE NO. 12. : Global Sustainable Seafood Market Volume, By Region, 2026 – 2030 (Metric Tons) 78

TABLE NO. 13. : Global Sustainable Seafood Market Revenue, By Sourcing Methods, 2026 – 2030 (USD Million) 79

TABLE NO. 14. : Global Sustainable Seafood Market Volume, By Sourcing Methods, 2026 – 2030 (Metric Tons) 79

TABLE NO. 15. : Global Sustainable Seafood Market Revenue, By Species, 2026 – 2030 (USD Million) 80

TABLE NO. 16. : Global Sustainable Seafood Market Volume, By Species, 2026 – 2030 (Metric Tons) 81

TABLE NO. 17. : Global Sustainable Seafood Market Revenue, By  Certification Standards, 2026 – 2030 (USD Million) 82

TABLE NO. 18. : Global Sustainable Seafood Market Volume, By  Certification Standards, 2026 – 2030 (Metric Tons) 83

TABLE NO. 19. : Global Sustainable Seafood Market Revenue, By Distribution Channel, 2026 – 2030 (USD Million) 84

TABLE NO. 20. : Global Sustainable Seafood Market Volume, By Distribution Channel, 2026 – 2030 (Metric Tons) 85

 

Request Free Sample

We prioritize the confidentiality and security of your data. Our promise: your information remains private.

Ready to Transform Data into Decisions?

Request Your Sample Report and Start Your Journey of Informed Choices


Providing the strategic compass for industry titans.

cr-clients-logos

Frequently Asked Questions

What is the current market size for Philippines and Global Sustainable Seafood Market, and what is its projected size in 2032?

The Philippines and Global Sustainable Seafood Market size was valued at USD 6,495.94 million in 2018, grew to USD 8,896.34 million in 2024, and is anticipated to reach USD 13,338.05 million by 2032, at a CAGR of 4.83% during the forecast period.

At what Compound Annual Growth Rate is the Philippines and Global Sustainable Seafood Market projected to grow between 2025 and 2032?

Philippines and Global Sustainable Seafood Market Grow at a CAGR of 4.83% during the forecast period.

Which Philippines and Global Sustainable Seafood Market market segment held the largest share in 2024?

What are the primary factors fueling the growth of the Philippines and Global Sustainable Seafood Market?

Who are the leading companies in the Philippines and Global Sustainable Seafood Market?

Which region commanded the largest share of the Philippines and Global Sustainable Seafood Market in 2024?

About Author

Rajdeep Kumar Deb

Rajdeep Kumar Deb

Lead Analyst – Consumer & Finance

Rajdeep brings a decade of consumer goods and financial services insight to strategic market analysis.

View Profile

Related Reports

Fish Collagen Market

The Global Fish Collagen Market size was valued at USD 995.72 million in 2018 to USD 1,524.01 million in 2024 and is anticipated to reach USD 2,581.48 million by 2032, at a CAGR of 6.34% during the forecast period.

Fiber Splice Enclosures Market

The Global Fiber Splice Enclosures Market size was valued at USD 1,588.46 million in 2018 to USD 2,405.18 million in 2024 and is anticipated to reach USD 4,006.73 million by 2032, at a CAGR of 6.13% during the forecast period.

Fiber Sorter Market

The Global Fiber Sorter Market size was valued at USD 1,926.82 million in 2018, growing to USD 2,786.53 million in 2024, and is anticipated to reach USD 4,710.43 million by 2032, at a CAGR of 6.31% during the forecast period.

Fiber Photometry System Market

The Global Fiber Photometry System Market size was valued at USD 66.48 million in 2018 to USD 131.00 million in 2024 and is anticipated to reach USD 337.56 million by 2032, at a CAGR of 11.70% during the forecast period.

Facial Pumps Market

he Global Facial Pumps Market size was valued at USD 4,248.76 million in 2018 to USD 6,383.25 million in 2024 and is anticipated to reach USD 10,924.78 million by 2032, at a CAGR of 6.47% during the forecast period.

Fashion Tech Market

The Global Fashion Tech Market size was valued at USD 190.49 million in 2018 to USD 275.18 million in 2024 and is anticipated to reach USD 429.52 million by 2032, at a CAGR of 5.33% during the forecast period.

Nylon Monofilament Market

The Global Nylon Monofilament Market size was valued at USD 1,100 million in 2018 to USD  1,285.96 million in 2024 and is anticipated to reach USD  1,932.36 million by 2032, at a CAGR of 5.29% during the forecast period.

Air Purifier Market

The Air Purifiers Market is projected to grow from USD 15,563.64 million in 2024 to an estimated USD 26,601.6 million by 2032, with a compound annual growth rate (CAGR) of 6.93% from 2024 to 2032.

Fleece Knitting Yarn Market

The Global Fleece Knitting Yarn Market size was valued at USD  1,120.00 million in 2018 to USD   1,305.43 million in 2024 and is anticipated to reach USD  1,967.98 million by 2032, at a CAGR of 5.34% during the forecast period.

Fiber Based Packaging Market

The Global Fiber Based Packaging Market size was valued at USD 259.14 billion in 2018, reaching USD 357.69 billion in 2024, and is anticipated to attain USD 525.38 million by 2032, expanding at a CAGR of 4.58% during the forecast period.

Dry Whole Milk Powder Market

Dry Whole Milk Powder Market size was valued USD 12.53 billion in 2024 and is anticipated to reach USD 16.76 billion by 2032, at a CAGR of 3.7% during the forecast period.

Salon Service Market

Salon Service Market size was valued at USD 240 billion in 2024 and is anticipated to reach USD 343.9 billion by 2032, at a CAGR of 4.6% during the forecast period.

Licence Option

The report comes as a view-only PDF document, optimized for individual clients. This version is recommended for personal digital use and does not allow printing. Use restricted to one purchaser only.
$4999

To meet the needs of modern corporate teams, our report comes in two formats: a printable PDF and a data-rich Excel sheet. This package is optimized for internal analysis. Unlimited users allowed within one corporate location (e.g., regional office).
$6999

The report will be delivered in printable PDF format along with the report’s data Excel sheet. This license offers 100 Free Analyst hours where the client can utilize Credence Research Inc. research team. Permitted for unlimited global use by all users within the purchasing corporation, such as all employees of a single company.
$12999

Report delivery within 24 to 48 hours

Credence Staff 3

WILLIAM, North America

Support Staff at Credence Research

KEITH PHILLIPS, Europe

Lee - CR Sales Staff

LEE VALLANCE, Asia Pacific

Kieran Jameson

KIERAN JAMESON, Australia

Smallform of Sample request
User Review

Thank you for the data! The numbers are exactly what we asked for and what we need to build our business case.

Materials Scientist
(privacy requested)

User Review

The report was an excellent overview of the Industrial Burners market. This report does a great job of breaking everything down into manageable chunks.

Imre Hof
Management Assistant, Bekaert

cr-clients-logos

Request Sample