Home » Consumer Goods » Fiber Splice Enclosures Market

Fiber Splice Enclosures Market By Type (Dome Type, Horizontal Type, Modular Type, Inline Type); By Capacity (Small Enclosures [Up to 12 Fibers], Medium Enclosures [12–48 Fibers], Large Enclosures [More than 48 Fibers]); By Application (Aerial Enclosures, Underground Enclosures, Wall-Mounted Enclosures, Others) – Growth, Share, Opportunities & Competitive Analysis, 2024 – 2032

Report ID: 157498 | Report Format : Excel, PDF

Market Overview:

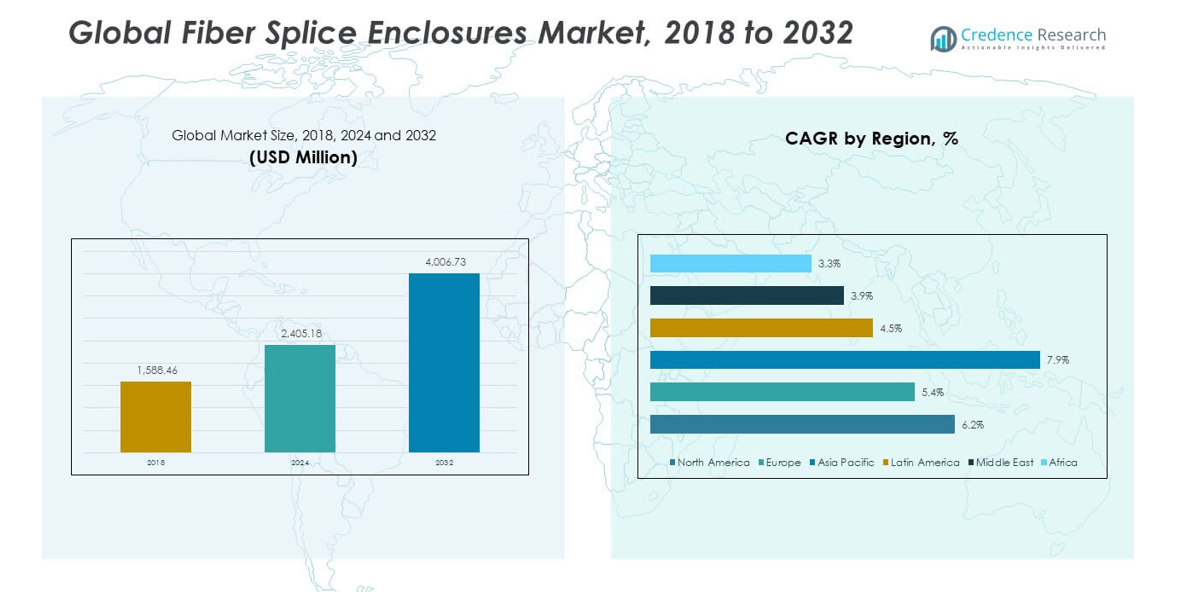
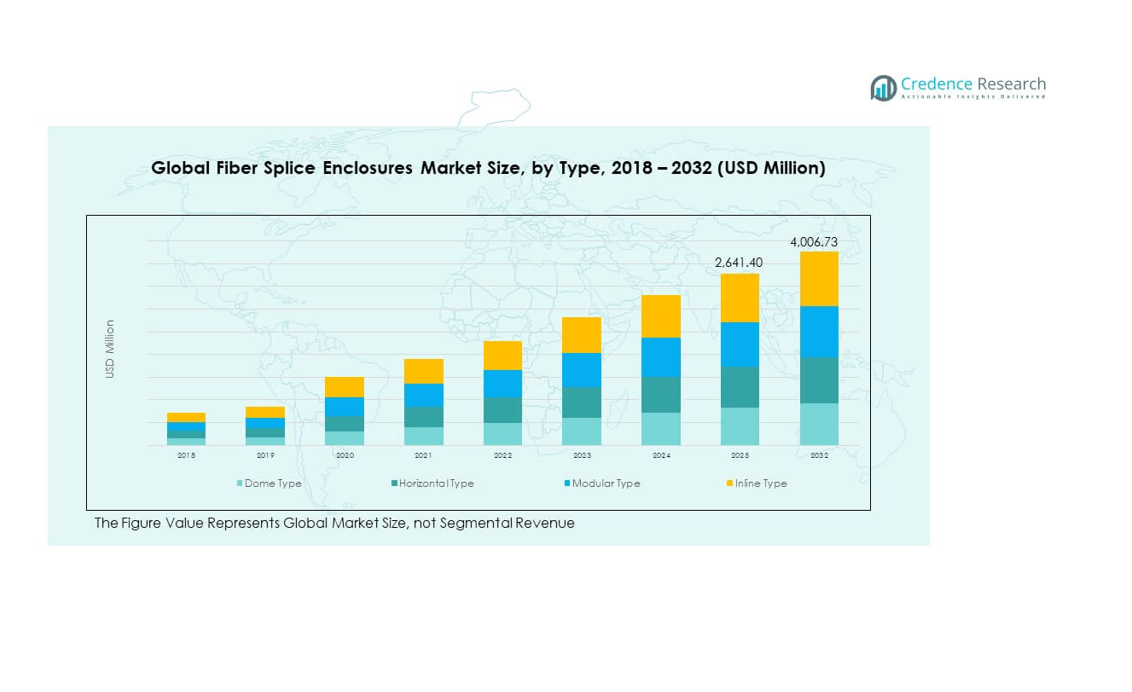
The Global Fiber Splice Enclosures Market size was valued at USD 1,588.46 million in 2018 to USD 2,405.18 million in 2024 and is anticipated to reach USD 4,006.73 million by 2032, at a CAGR of 6.13% during the forecast period.

REPORT ATTRIBUTE DETAILS
Historical Period 2020-2023
Base Year 2024
Forecast Period 2025-2032
Fiber Splice Enclosures Market Size 2024  USD 2,405.18 million
Fiber Splice Enclosures Market, CAGR 6.13%
Fiber Splice Enclosures Market Size 2032 USD 4,006.73 million


The market growth is driven by expanding fiber optic networks supporting broadband and 5G infrastructure. Rising demand for high-speed internet connectivity and smart city development strengthens installation of durable fiber enclosures. Growing investments in telecommunication infrastructure by governments and private operators also stimulate adoption. The shift toward data-intensive applications in enterprises and residential networks encourages the need for reliable, weather-resistant, and high-capacity fiber splice solutions.

Regionally, Asia-Pacific leads due to rapid digital transformation, large-scale telecom deployments, and strong government-backed fiber expansion in China, Japan, and India. North America follows, driven by the roll-out of 5G and advanced data center networks. Europe shows steady adoption supported by broadband modernization projects. Emerging markets in Latin America and the Middle East are gaining traction through expanding urban connectivity and investments in telecom infrastructure upgrades.

Fiber Splice Enclosures Market size

Market Insights:

  • The Global Fiber Splice Enclosures Market was valued at USD 1,588.46 million in 2018, reached USD 2,405.18 million in 2024, and is projected to attain USD 4,006.73 million by 2032, expanding at a CAGR of 6.13% during the forecast period.
  • Asia Pacific (26.9%), North America (25.9%), and Europe (21.8%) hold the top three regional shares. These regions dominate due to extensive 5G rollouts, data center expansions, and strong fiber-to-the-home (FTTH) penetration supported by government and private investments.
  • Asia Pacific is the fastest-growing region, supported by rapid urbanization, large-scale smart city projects, and expanding broadband infrastructure in China, India, and Japan. Its cost-effective manufacturing base strengthens growth potential across telecom and enterprise applications.
  • Dome type enclosures account for the largest segment share, widely adopted for their high sealing efficiency, superior protection, and suitability for outdoor and underground fiber installations.
  • Horizontal type enclosures represent the second-largest share, favored in duct-based and urban telecom networks for their accessibility, modular design, and flexibility in cable management.

Access crucial information at unmatched prices!

Request your sample report today & start making informed decisions powered by Credence Research Inc.!

Download Sample

Market Drivers:

Rising Expansion of Fiber Optic Infrastructure Across Global Telecommunications Networks

The Global Fiber Splice Enclosures Market experiences strong growth from expanding broadband and 5G network infrastructure. Telecommunication operators are deploying extensive fiber optic cables to enhance data transmission capacity and connectivity reliability. This demand creates a steady requirement for advanced splice enclosures that protect optical fibers from environmental and mechanical stress. Governments worldwide are investing in digitalization programs and rural broadband access. Such initiatives accelerate fiber rollouts and stimulate the market. It benefits from public-private collaborations focusing on last-mile connectivity improvements. Continuous fiber penetration in mobile backhaul and fixed-line networks further strengthens market adoption. The demand for compact, modular, and weather-resistant enclosures continues to grow in both developed and emerging economies.

  • For instance, Orange reached over 10 million fiber customers in France, becoming the first European operator to achieve this milestone in its domestic market, as announced in September 2025. Furthermore, Orange is working with the French government, not Nokia, to provide fiber connectivity to an additional 1.12 million households in specific areas by the end of 2025, an agreement announced in November 2023.

Growing Data Consumption from Cloud Computing and Data Center Expansion

Rapid growth in data consumption drives higher fiber deployment across cloud data centers and enterprise networks. The surge in online content, streaming platforms, and IoT-connected devices has intensified bandwidth requirements globally. Fiber splice enclosures play a crucial role in ensuring uninterrupted data transmission by protecting splicing points. Data center operators are upgrading network infrastructure to support low latency and scalability demands. The market benefits from the construction of hyperscale data centers worldwide. Rising enterprise migration to cloud-based systems encourages increased fiber backbone installations. It creates a need for reliable and scalable splicing protection solutions. The combination of digital transformation and smart infrastructure expansion continues to boost adoption across multiple sectors.

  • For instance, Corning’s EDGE Rapid Connect fiber solutions have been shown to reduce fiber installation times by up to 70% while providing high-density, rapid deployment capabilities. This capability is documented in official Corning publications from 2024 and earlier.

Rising Government Support and Incentives for Fiber Deployment Projects

Several countries are implementing national broadband plans to improve internet coverage and quality. The Global Fiber Splice Enclosures Market gains momentum through subsidies, tax benefits, and infrastructure funding offered by authorities. Public utility and telecom firms are collaborating to accelerate fiber-to-the-home (FTTH) installations. Urban and rural connectivity initiatives under programs like “Digital India” and “Connect America” enhance fiber infrastructure expansion. It supports increased deployment of splice enclosures across different network layers. Governments’ focus on smart city frameworks and e-governance also amplifies market growth. The demand for durable, waterproof, and high-capacity splice solutions is increasing in public infrastructure projects. This broad policy push enhances fiber reliability and long-term network sustainability.

Technological Advancements in Enclosure Design and Material Innovation

Continuous innovation in enclosure materials and design boosts performance, durability, and ease of installation. Manufacturers are integrating corrosion-resistant polymers, high-strength metals, and advanced sealing systems. The Global Fiber Splice Enclosures Market benefits from IP-rated protection standards and modular design improvements. These advancements enable flexible configurations, faster field assembly, and reduced maintenance time. Optical fiber management systems with improved space optimization support large-scale installations. Automation in cable termination and enhanced protection against temperature extremes further elevate product reliability. It helps network operators achieve cost efficiency and operational resilience. Rising investment in research and product standardization fosters consistent performance across diverse environmental conditions.

Market Trends:

Shift Toward Compact and Modular Enclosure Systems for Simplified Network Deployment

Modern fiber networks demand smaller, modular, and adaptable enclosure systems to support dense installations. The Global Fiber Splice Enclosures Market is witnessing a clear move toward compact and stackable units that simplify setup in confined urban areas. Modular enclosures enhance scalability by allowing easy capacity upgrades without complex reconfiguration. Telecom operators prefer flexible designs that fit both aerial and underground applications. It also aids faster deployment for broadband and 5G rollouts. This trend aligns with urban fiber densification strategies and space-optimized infrastructure models. Compact enclosures improve cost efficiency and speed up service activation timelines. The transition supports operators aiming for minimal downtime and flexible maintenance schedules.

  • For instance, CommScope has globally commercialized the NOVUX™ modular fiber portfolio, which allows up to 50 times more deployment configurations with 75% fewer components than previous platforms, greatly simplifying urban and rural network rollouts, as reported in product announcements and solution guides in 2021.

Integration of Smart Monitoring and IoT Features for Network Reliability

The industry is integrating IoT-enabled monitoring and diagnostics tools into fiber enclosures. These intelligent systems provide real-time performance data and fault detection, improving network uptime. The Global Fiber Splice Enclosures Market benefits from innovations such as temperature and humidity sensors embedded in enclosure units. Automated alerts enhance predictive maintenance and operational efficiency for telecom service providers. The use of remote monitoring reduces manual inspection costs in challenging field conditions. It strengthens reliability across geographically dispersed networks. Smart enclosure systems also support sustainability by optimizing maintenance routes and reducing downtime. Their adoption is expanding in advanced communication and defense infrastructure projects worldwide.

  • For instance, Huawei launched smart site monitoring platforms in 2024 integrated with optical fiber networks, deploying AI-powered environmental sensing solutions to reduce maintenance dispatches and improve average network repair times by over 40% in pilot projects across Europe and Asia, according to post-event coverage from HUAWEI CONNECT 2024 Paris.

Increased Adoption of Environmentally Sustainable Materials and Designs

Environmental awareness among manufacturers drives the use of recyclable and eco-friendly materials in fiber splice enclosures. The Global Fiber Splice Enclosures Market is adopting polymer blends that reduce environmental impact while maintaining strength. Companies are focusing on minimizing carbon emissions during production through energy-efficient manufacturing processes. Lightweight designs are gaining preference for reducing logistics and installation costs. It also improves overall operational sustainability. Regulatory frameworks promoting green infrastructure further influence this transition. Many suppliers have introduced biodegradable coatings and sustainable packaging. The growing preference for environmentally conscious designs reflects the broader industry shift toward carbon-neutral communication systems.

Growing Preference for Pre-Connectorized and Plug-and-Play Solutions

The market is shifting toward pre-connectorized fiber enclosures to save installation time and labor costs. These ready-to-deploy solutions simplify field connections and reduce the risk of splicing errors. The Global Fiber Splice Enclosures Market benefits from the telecom sector’s focus on faster service delivery. Plug-and-play configurations enable rapid network extensions and repairs in dynamic environments. It increases efficiency for operators managing large-scale projects with tight timelines. Rising deployment in FTTH and 5G infrastructure fuels demand for these enclosures. Their compatibility with diverse cable types enhances design flexibility. Manufacturers continue refining product ergonomics to improve reliability and technician convenience during installation.

Fiber Splice Enclosures Market share

Market Challenges Analysis:

High Installation and Maintenance Costs Impacting Large-Scale Deployment

The Global Fiber Splice Enclosures Market faces significant challenges due to high installation and maintenance costs. Fiber splicing and enclosure setup require skilled technicians and precision tools, increasing overall expenditure. Many developing regions face cost barriers in deploying large-scale fiber networks. It limits adoption among small Internet Service Providers (ISPs) and rural projects. Harsh weather and physical strain on cables raise maintenance expenses. The lack of standardization in design complicates compatibility across multiple vendors. Operators also encounter delays due to complex approval processes in public infrastructure. These financial and logistical challenges can slow down market expansion despite strong demand potential.

Supply Chain Disruptions and Limited Skilled Workforce Affecting Growth

The market also struggles with disruptions in material supply and a shortage of trained professionals. The Global Fiber Splice Enclosures Market depends heavily on the timely availability of polymers, metals, and optical components. Supply delays caused by geopolitical tensions or transportation bottlenecks hinder manufacturing continuity. It affects project timelines and cost structures for operators. Skilled labor shortages lead to inconsistent installation quality and network failures. The industry faces difficulty in retaining technical personnel trained in fiber optic maintenance. Standardized training initiatives and automated assembly technologies are helping mitigate this issue. However, persistent workforce gaps and procurement delays continue to challenge industry scalability.

Market Opportunities:

Rising Fiber Penetration in Emerging Economies and Smart City Programs

The Global Fiber Splice Enclosures Market holds strong growth potential in developing economies investing in digital connectivity. Emerging countries in Asia, Africa, and Latin America are adopting national broadband and smart city programs. Governments are promoting public-private partnerships to extend high-speed internet to remote locations. It creates steady demand for cost-effective, weatherproof enclosure systems. Rapid urbanization and digital inclusion initiatives further boost infrastructure needs. The market benefits from fiber deployment in educational, healthcare, and industrial projects. Growing cloud adoption and 5G expansions add long-term revenue opportunities across these regions.

Product Innovation and Customization Opportunities in Advanced Network Applications

Manufacturers are focusing on product innovation to deliver high-performance and tailored enclosure systems. The Global Fiber Splice Enclosures Market benefits from growing demand for compact, heat-resistant, and easy-to-install designs. It enables operators to support dense fiber networks in urban and industrial settings. Companies introducing modular and hybrid enclosures with integrated cable management gain a competitive edge. Increasing adoption in defense, aerospace, and enterprise networking expands application scope. Continuous R&D investment and product differentiation offer significant business growth opportunities for leading vendors.

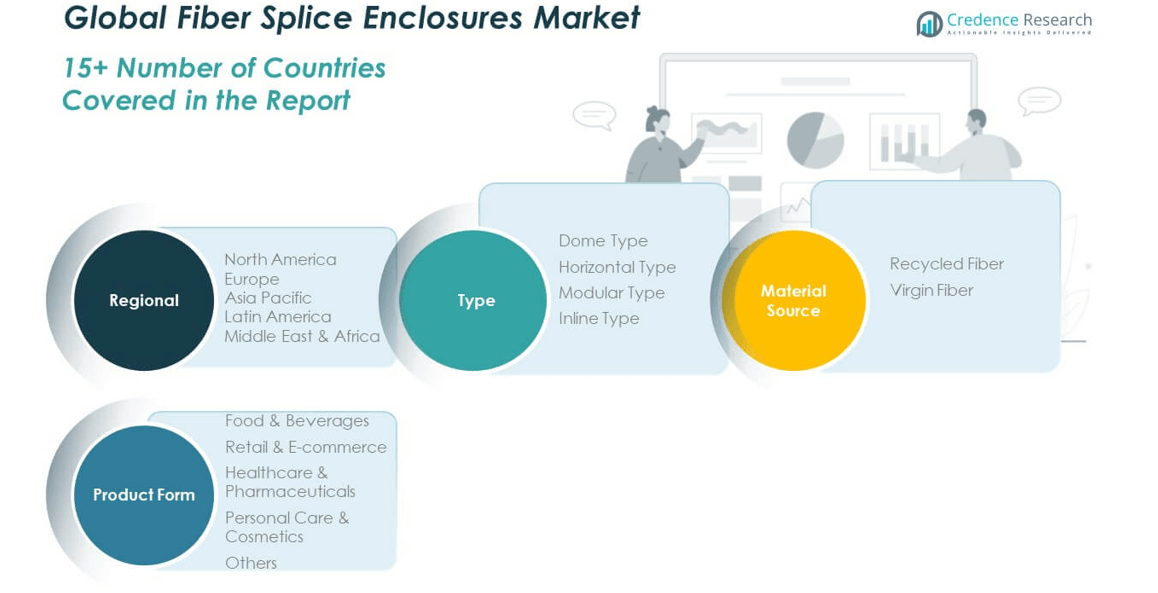
Market Segmentation Analysis:

By Type

The Global Fiber Splice Enclosures Market is categorized into dome type, horizontal type, modular type, and inline type. Dome-type enclosures dominate due to their high capacity, superior sealing, and durability in outdoor installations. Horizontal enclosures hold strong demand in underground and duct-based networks requiring easy access. Modular enclosures gain traction in large-scale and customized telecom deployments, offering flexible configurations. Inline types support compact installations in confined spaces, preferred by utility and enterprise networks. It continues to evolve with design innovation to meet diverse installation and protection requirements.

  • For instance, Tyco/CommScope FOSC dome enclosures routinely support up to 576 fiber splices per unit and are widely used by Tier 1 operators in demanding underground network segments, as detailed in certified product specifications and distributor catalogs updated in 2024.

By Capacity

The market is segmented into small enclosures (up to 12 fibers), medium enclosures (12–48 fibers), and large enclosures (more than 48 fibers). Medium enclosures lead due to their wide application across fiber-to-the-home (FTTH) and metropolitan networks. Large enclosures find strong usage in backbone and long-haul fiber systems, supporting higher splice density. Small enclosures are used in local distribution and short-distance links where compact designs are needed. It reflects the growing preference for scalable and maintenance-friendly solutions that align with network expansion goals.

  • For instance, Prysmian Group extended its partnership with Openreach in the UK to supply medium-capacity closures designed for 48 fiber splices, recognized with innovation awards in 2024 for enabling rapid and reliable FTTH deployments, as announced in official Prysmian press releases and industry coverage.

By Application

The market includes aerial, underground, wall-mounted, and other enclosure types. Aerial enclosures dominate due to their extensive use in overhead fiber installations and broadband infrastructure. Underground enclosures show steady growth driven by fiber protection needs in urban and long-distance networks. Wall-mounted enclosures are expanding across enterprises and data centers for internal connectivity. It benefits from the surge in high-speed communication infrastructure, ensuring safe and efficient fiber management across all application areas.

Fiber Splice Enclosures Market segmentatiobn

Segmentation:

  • By Type:
    • Dome Type
    • Horizontal Type
    • Modular Type
    • Inline Type
  • By Capacity:
    • Small Enclosures (up to 12 fibers)
    • Medium Enclosures (12–48 fibers)
    • Large Enclosures (more than 48 fibers)
  • By Application:
    • Aerial Enclosures
    • Underground Enclosures
    • Wall-Mounted Enclosures
    • Others
  • By Region:
    • North America
      • U.S.
      • Canada
      • Mexico
    • Europe
      • Germany
      • France
      • U.K.
      • Italy
      • Spain
      • Rest of Europe
    • Asia Pacific
      • China
      • Japan
      • India
      • South Korea
      • South-east Asia
      • Rest of Asia Pacific
    • Latin America
      • Brazil
      • Argentina
      • Rest of Latin America
    • Middle East & Africa
      • GCC Countries
      • South Africa
      • Rest of the Middle East and Africa

Regional Analysis:

North America

The North America Global Fiber Splice Enclosures Market size was valued at USD 693.12 million in 2018 to USD 1,038.58 million in 2024 and is anticipated to reach USD 1,734.95 million by 2032, at a CAGR of 6.2% during the forecast period. North America accounts for around 25.9% of the global market share. The region maintains strong leadership driven by widespread 5G deployment, advanced broadband infrastructure, and growing demand for high-speed fiber connectivity. The U.S. leads adoption through large-scale fiber-to-the-home (FTTH) and data center expansion projects. Canada and Mexico are accelerating digital infrastructure investments to improve connectivity in rural and semi-urban areas. The presence of key technology players and favorable government policies enhances innovation and fiber network upgrades. It benefits from early adoption of next-generation enclosure technologies designed for harsh outdoor conditions and underground applications.

Europe

The Europe Global Fiber Splice Enclosures Market size was valued at USD 468.97 million in 2018 to USD 685.49 million in 2024 and is anticipated to reach USD 1,077.84 million by 2032, at a CAGR of 5.4% during the forecast period. Europe contributes about 21.8% of the global market share. Strong digital transformation policies and the European Union’s Gigabit Society goals propel fiber network development. The U.K., Germany, and France lead the deployment of FTTH and enterprise fiber solutions. Eastern Europe experiences rapid growth supported by government-backed broadband expansion programs. The region’s emphasis on sustainable and energy-efficient infrastructure supports the adoption of advanced polymer-based enclosure systems. It benefits from growing investment in telecom modernization and enhanced manufacturing capabilities across the continent.

Asia Pacific

The Asia Pacific Global Fiber Splice Enclosures Market size was valued at USD 280.12 million in 2018 to USD 462.95 million in 2024 and is anticipated to reach USD 881.96 million by 2032, at a CAGR of 7.9% during the forecast period. Asia Pacific represents around 26.9% of the global market share, making it the fastest-growing region. China, Japan, and India lead adoption driven by massive 5G rollouts, smart city projects, and government digitalization initiatives. Expanding manufacturing bases and local component suppliers strengthen cost efficiency. Rapid urbanization and rising internet users create sustained demand for reliable fiber protection systems. It experiences strong growth in telecommunications, utilities, and industrial fiber infrastructure. Continuous regional investment in high-capacity networks further amplifies the market outlook.

Latin America

The Latin America Global Fiber Splice Enclosures Market size was valued at USD 75.21 million in 2018 to USD 112.46 million in 2024 and is anticipated to reach USD 165.87 million by 2032, at a CAGR of 4.5% during the forecast period. Latin America holds about 5.1% of the global market share. Countries like Brazil, Mexico, and Argentina are focusing on expanding broadband access and upgrading legacy telecom systems. National broadband programs and private sector participation are accelerating fiber installations in urban centers. Rising data consumption from streaming and e-commerce platforms supports continuous network upgrades. It benefits from increasing adoption of aerial and underground enclosure solutions suited to diverse climatic conditions. Ongoing infrastructure reforms and digital inclusion policies are expected to drive consistent market progress.

Middle East

The Middle East Global Fiber Splice Enclosures Market size was valued at USD 45.20 million in 2018 to USD 62.65 million in 2024 and is anticipated to reach USD 88.35 million by 2032, at a CAGR of 3.9% during the forecast period. The region contributes about 3.1% of the global market share. GCC countries such as the UAE, Saudi Arabia, and Qatar lead growth through large-scale smart city and 5G projects. Investments in high-speed fiber infrastructure align with regional digital transformation goals. It benefits from strong government support and collaborations with international telecom equipment manufacturers. Expansion of enterprise connectivity and data centers continues to enhance demand. The region’s focus on diversifying economies toward knowledge-based industries drives steady infrastructure spending.

Africa

The Africa Global Fiber Splice Enclosures Market size was valued at USD 25.85 million in 2018 to USD 43.04 million in 2024 and is anticipated to reach USD 57.76 million by 2032, at a CAGR of 3.3% during the forecast period. Africa holds approximately 2.7% of the global market share. The region’s growth is driven by ongoing investments in telecom infrastructure and cross-border fiber connectivity. South Africa, Egypt, and Kenya are leading fiber expansion through government-backed digital projects. Private ISPs are extending network coverage to underserved areas, creating steady enclosure demand. It faces challenges related to high installation costs and limited technical expertise but continues to show improvement in deployment efficiency. Growing adoption of mobile broadband and regional digital hubs supports long-term fiber infrastructure development.

Shape Your Report to Specific Countries or Regions & Enjoy 30% Off!

Key Player Analysis:

  • Corning Incorporated
  • Fujikura Ltd.
  • Prysmian Group
  • Sumitomo Electric Industries, Ltd.
  • TE Connectivity Ltd.
  • AFL Global
  • CommScope
  • Optical Cable Corporation
  • Belden Inc.
  • Leoni Fiber Optics

Competitive Analysis:

The Global Fiber Splice Enclosures Market features a competitive set of established manufacturers and emerging players, each focused on enhancing product portfolios and geographic reach. Major companies such as Corning Incorporated, Fujikura Ltd., Prysmian Group and CommScope maintain strong positions through global operations and diversified telecom infrastructure offerings. They invest substantially in R&D, enabling enclosure designs that support higher fiber counts, extreme environmental protection and modular installations. It must continuously adapt to evolving fibre-optic network requirements and faster roll-out timelines. Smaller niche suppliers leverage innovation and regional distribution to challenge incumbents. Pricing pressure and material cost volatility impose challenges that drive consolidation and strategic partnerships. Companies that deliver faster time-to-installation and reliable performance gain market advantage. The competitive intensity drives quality improvements, cost efficiency and geographic expansion.

Recent Developments:

  • In September 2025, Fujikura Ltd. launched the world’s highest-count hyperscale fiber optic cable—13,824 fiber SWR/WTC—achieving twice the fiber density of previous cables, specifically aimed at streamlining hyperscale data center splicing and enclosure needs. Alongside, Fujikura promoted mass fusion splicing and rapid enclosure installation at the Connected Britain 2025 event, targeting accelerated build times for advanced network operators.
  • In July 2025, Prysmian Group introduced its award-winning Eagle™ Splice Closure at the ISE Expo in New Orleans, supporting modular setups from simple drops to high-count butt splices, optimized for rural broadband and scalable fiber deployment. The SiroccoHD™ Microduct cable was also promoted, offering high-density, field-proven fiber solutions ideal for flexible and fast enclosure installations in dense urban fiber networks.

Report Coverage:

The research report offers an in-depth analysis based on Type and Application segments. It details leading market players, providing an overview of their business, product offerings, investments, revenue streams, and key applications. Additionally, the report includes insights into the competitive environment, SWOT analysis, current market trends, as well as the primary drivers and constraints. Furthermore, it discusses various factors that have driven market expansion in recent years. The report also explores market dynamics, regulatory scenarios, and technological advancements that are shaping the industry. It assesses the impact of external factors and global economic changes on market growth. Lastly, it provides strategic recommendations for new entrants and established companies to navigate the complexities of the market.

Future Outlook:

  • Surge in 5G and fibre-to-the-home deployments will raise demand for advanced splice enclosures.
  • Growth in data-centres and cloud infrastructure will drive large-capacity enclosure adoption.
  • Modular and pre-configured solutions will increasingly dominate deployment strategies.
  • Sustainability and lighter-weight materials will become key differentiators.
  • Smart monitoring and IoT-enabled enclosures will support predictive maintenance.
  • Emerging economies will offer accelerated growth opportunities beyond mature markets.
  • Consolidation among vendors will continue, boosting global reach and product breadth.
  • Standardisation efforts will streamline interoperability across regions and vendors.
  • Cost pressures on raw materials will push design innovation and supply-chain optimisation.
  • Fibre-optic network densification in urban settings will favour compact, high-density enclosures.

CHAPTER NO. 1: GENESIS OF THE MARKET

1.1 Market Prelude – Introduction & Scope

1.2 The Big Picture – Objectives & Vision

1.3 Strategic Edge – Unique Value Proposition

1.4 Stakeholder Compass – Key Beneficiaries

CHAPTER NO. 2: EXECUTIVE LENS

2.1 Pulse of the Industry – Market Snapshot

2.2 Growth Arc – Revenue Projections (USD Million)

2.3. Premium Insights – Based on Primary Interviews

CHAPTER NO. 3: FERROVANADIUM MARKET FORCES & INDUSTRY PULSE

3.1 Foundations of Change – Market Overview
3.2 Catalysts of Expansion – Key Market Drivers
3.2.1 Momentum Boosters – Growth Triggers
3.2.2 Innovation Fuel – Disruptive Technologies
3.3 Headwinds & Crosswinds – Market Restraints
3.3.1 Regulatory Tides – Compliance Challenges
3.3.2 Economic Frictions – Inflationary Pressures
3.4 Untapped Horizons – Growth Potential & Opportunities
3.5 Strategic Navigation – Industry Frameworks
3.5.1 Market Equilibrium – Porter’s Five Forces
3.5.2 Ecosystem Dynamics – Value Chain Analysis
3.5.3 Macro Forces – PESTEL Breakdown

3.6 Price Trend Analysis

    3.6.1 Regional Price Trend
3.6.2 Price Trend by Product

CHAPTER NO. 4: KEY INVESTMENT EPICENTER         

4.1 Regional Goldmines – High-Growth Geographies

4.2 Product Frontiers – Lucrative Product Categories

4.3 Application Sweet Spots – Emerging Demand Segments

CHAPTER NO. 5: REVENUE TRAJECTORY & WEALTH MAPPING

5.1 Momentum Metrics – Forecast & Growth Curves

5.2 Regional Revenue Footprint – Market Share Insights

5.3 Segmental Wealth Flow – Grade & Product Form Revenue

CHAPTER NO. 6: TRADE & COMMERCE ANALYSIS     

6.1.      Import Analysis by Region

6.1.1.    Global Ferrovanadium Import Revenue By Region

6.2.      Export Analysis by Region

6.2.1.    Global Ferrovanadium Export Revenue By Region

CHAPTER NO. 7: COMPETITION ANALYSIS       

7.1.      Company Market Share Analysis

7.1.1.    Global Ferrovanadium: Company Market Share

7.2.      Global Ferrovanadium Company Revenue Market Share

7.3.      Strategic Developments

7.3.1.    Acquisitions & Mergers

7.3.2.    New Product Launch

7.3.3.    Regional Expansion

7.4.    Competitive Dashboard

7.5.    Company Assessment Metrics, 2024

CHAPTER NO. 8: FERROVANADIUM MARKET – BY GRADE SEGMENT ANALYSIS

8.1.      Ferrovanadium Overview by Grade Segment

8.1.1.    Ferrovanadium Revenue Share By Grade

8.2.      FeV 40

8.3.      FeV 50

8.4.      FeV 60

8.5.      FeV 80

CHAPTER NO. 9: FERROVANADIUM MARKET – BY APPLICATION SEGMENT ANALYSIS

9.1.      Ferrovanadium Overview by Application Segment

9.1.1.    Ferrovanadium Revenue Share By Application

9.2.      Construction

9.3.      Automotive and Transportation

9.4.      Industrial Equipment

9.5.      Oil and Gas

9.6.      Others

CHAPTER NO. 10: FERROVANADIUM MARKET – BY PRODUCT FORM SEGMENT ANALYSIS

10.1.     Ferrovanadium Overview by Product Form Segment

10.1.1.  Ferrovanadium Revenue Share By Product Form

10.2.     Lumps

10.3.     Pellets

10.4.     Powder

CHAPTER NO. 11: FERROVANADIUM MARKET – REGIONAL ANALYSIS

11.1.     Ferrovanadium Overview by Region Segment

11.1.1.  Global Ferrovanadium Revenue Share By Region

11.1.2.  Region

11.1.3.  Global Ferrovanadium Revenue By Region

11.1.4. Grade

11.1.5.  Global Ferrovanadium Revenue By Grade

11.1.6.  Application

11.1.7. Global Ferrovanadium Revenue By Application

11.1.8. Product Form

11.1.9. Global Ferrovanadium Revenue By Product Form

CHAPTER NO. 12: NORTH AMERICA FERROVANADIUM MARKET – COUNTRY ANALYSIS

12.1.     North America Ferrovanadium Overview by Country Segment

12.1.1.  North America Ferrovanadium Revenue Share By Region

12.2.     North America

12.2.1.  North America Ferrovanadium Revenue By Country

12.2.2.  Grade

12.2.3.  North America Ferrovanadium Revenue By Grade

12.2.4.  Application

12.2.5.  North America Ferrovanadium Revenue By Application

12.2.6.  Product Form

12.2.7.  North America Ferrovanadium Revenue By Product Form

2.3.      U.S.

12.4.     Canada

12.5.     Mexico

CHAPTER NO. 13: EUROPE FERROVANADIUM MARKET – COUNTRY ANALYSIS

13.1.     Europe Ferrovanadium Overview by Country Segment

13.1.1.  Europe Ferrovanadium Revenue Share By Region

13.2.     Europe

13.2.1.  Europe Ferrovanadium Revenue By Country

13.2.2.  Grade

13.2.3.  Europe Ferrovanadium Revenue By Grade

13.2.4.  Application

13.2.5.  Europe Ferrovanadium Revenue By Application

13.2.6.  Product Form

13.2.7.  Europe Ferrovanadium Revenue By Product Form

13.3.     UK

13.4.     France

13.5.     Germany

13.6.     Italy

13.7.     Spain

13.8.     Russia

13.9.   Rest of Europe

CHAPTER NO. 14: ASIA PACIFIC FERROVANADIUM MARKET – COUNTRY ANALYSIS

14.1.     Asia Pacific Ferrovanadium Overview by Country Segment

14.1.1.  Asia Pacific Ferrovanadium Revenue Share By Region

14.2.     Asia Pacific

14.2.1.  Asia Pacific Ferrovanadium Revenue By Country

14.2.2.  Grade

14.2.3.  Asia Pacific Ferrovanadium Revenue By Grade

14.2.4.  Application

14.2.5.  Asia Pacific Ferrovanadium Revenue By Application

14.2.5.  Product Form

14.2.7.  Asia Pacific Ferrovanadium Revenue By Product Form

14.3.     China

14.4.     Japan

14.5.     South Korea

14.6.     India

14.7.     Australia

14.8.     Southeast Asia

14.9.     Rest of Asia Pacific

CHAPTER NO. 15: LATIN AMERICA FERROVANADIUM MARKET – COUNTRY ANALYSIS

15.1.     Latin America Ferrovanadium Overview by Country Segment

15.1.1.  Latin America Ferrovanadium Revenue Share By Region

15.2.     Latin America

15.2.1.  Latin America Ferrovanadium Revenue By Country

15.2.2.  Grade

15.2.3.  Latin America Ferrovanadium Revenue By Grade

15.2.4.  Application

15.2.5.  Latin America Ferrovanadium Revenue By Application

15.2.6.  Product Form

15.2.7.  Latin America Ferrovanadium Revenue By Product Form

15.3.     Brazil

15.4.     Argentina

15.5.     Rest of Latin America

CHAPTER NO. 16: MIDDLE EAST FERROVANADIUM MARKET – COUNTRY ANALYSIS

16.1.     Middle East Ferrovanadium Overview by Country Segment

16.1.1.  Middle East Ferrovanadium Revenue Share By Region

16.2.     Middle East

16.2.1.  Middle East Ferrovanadium Revenue By Country

16.2.2.  Grade

16.2.3.  Middle East Ferrovanadium Revenue By Grade

16.2.4.  Application

16.2.5.  Middle East Ferrovanadium Revenue By Application

16.2.6.  Product Form

16.2.7.  Middle East Ferrovanadium Revenue By Product Form

16.3.     GCC Countries

16.4.     Israel

16.5.     Turkey

16.6.     Rest of Middle East

CHAPTER NO. 17: AFRICA FERROVANADIUM MARKET – COUNTRY ANALYSIS

17.1.     Africa Ferrovanadium Overview by Country Segment

17.1.1.  Africa Ferrovanadium Revenue Share By Region

17.2.     Africa

17.2.1.  Africa Ferrovanadium Revenue By Country

17.2.2.  Grade

17.2.3.  Africa Ferrovanadium Revenue By Grade

17.2.4.  Application

17.2.5.  Africa Ferrovanadium Revenue By Application

17.2.6.  Product Form

17.2.7.  Africa Ferrovanadium Revenue By Product Form

17.3.     South Africa

17.4.     Egypt

17.5.     Rest of Africa

CHAPTER NO. 18: COMPANY PROFILES 

18.1.     Rio Tinto

18.1.1.  Company Overview

18.1.2.  Product Portfolio

18.1.3.  Financial Overview

18.1.4.  Recent Developments

18.1.5.  Growth Strategy

18.1.6.  SWOT Analysis

18.2.     Sibelco

18.3.     Glencore

18.4.     VANCO

18.5.     Baosteel Resources

18.6.     Shiva Metals Energy

18.7.     Eramet

18.8.     Molycorp

18.9.     Cronimet Alloys

18.10.   China Molybdenum

Request Free Sample

We prioritize the confidentiality and security of your data. Our promise: your information remains private.

Ready to Transform Data into Decisions?

Request Your Sample Report and Start Your Journey of Informed Choices


Providing the strategic compass for industry titans.

cr-clients-logos

Frequently Asked Questions

What is the current market size for the Global Fiber Splice Enclosures Market, and what is its projected size in 2032?

The market size was valued at USD 1,588.46 million in 2018, reached USD 2,405.18 million in 2024, and is anticipated to hit USD 4,006.73 million by 2032, reflecting sustained growth across infrastructure segments.

At what Compound Annual Growth Rate is the Global Fiber Splice Enclosures Market projected to grow between 2025 and 2032?

The market is forecast to expand at a CAGR of about 6.13% during the 2025-2032 period, supported by fibre-optic network roll-outs and broadband expansion.

Which market segment held the largest share in 2024?

While precise share data by segment is region- and report-dependent, dome-type enclosures and medium-capacity segments frequently dominate due to broad usage across FTTH and metro-access networks.

What are the primary factors fueling the growth of the Global Fiber Splice Enclosures Market?

Growth drivers include rapid deployment of fibre-optic networks, rising data demand from broadband and cloud services, government infrastructure programmes, and technological advances in enclosure design and materials.

Who are the leading companies in the Global Fiber Splice Enclosures Market?

Key players include Corning Incorporated, Fujikura Ltd., Prysmian Group, Sumitomo Electric Industries Ltd., TE Connectivity Ltd., AFL Global, CommScope, Optical Cable Corporation, Belden Inc., and Leoni Fiber Optics.

Which region commanded the largest share of the Global Fiber Splice Enclosures Market in 2024

North America led the market with a strong share, driven by advanced telecom infrastructure deployment, high-density fibre networks, and early adoption of next-generation splice-enclosure systems.

About Author

Rajdeep Kumar Deb

Rajdeep Kumar Deb

Lead Analyst – Consumer & Finance

Rajdeep brings a decade of consumer goods and financial services insight to strategic market analysis.

View Profile

Related Reports

Nylon Monofilament Market

The Global Nylon Monofilament Market size was valued at USD 1,100 million in 2018 to USD  1,285.96 million in 2024 and is anticipated to reach USD  1,932.36 million by 2032, at a CAGR of 5.29% during the forecast period.

Air Purifier Market

The Air Purifiers Market is projected to grow from USD 15,563.64 million in 2024 to an estimated USD 26,601.6 million by 2032, with a compound annual growth rate (CAGR) of 6.93% from 2024 to 2032.

Fleece Knitting Yarn Market

The Global Fleece Knitting Yarn Market size was valued at USD  1,120.00 million in 2018 to USD   1,305.43 million in 2024 and is anticipated to reach USD  1,967.98 million by 2032, at a CAGR of 5.34% during the forecast period.

Fiber Based Packaging Market

The Global Fiber Based Packaging Market size was valued at USD 259.14 billion in 2018, reaching USD 357.69 billion in 2024, and is anticipated to attain USD 525.38 million by 2032, expanding at a CAGR of 4.58% during the forecast period.

Dry Whole Milk Powder Market

Dry Whole Milk Powder Market size was valued USD 12.53 billion in 2024 and is anticipated to reach USD 16.76 billion by 2032, at a CAGR of 3.7% during the forecast period.

Salon Service Market

Salon Service Market size was valued at USD 240 billion in 2024 and is anticipated to reach USD 343.9 billion by 2032, at a CAGR of 4.6% during the forecast period.

Eye Cosmetic Packaging Market

The Global Eye Cosmetic Packaging Market size was valued at USD 9,648.97 million in 2018 to USD 15,093.44 million in 2024 and is anticipated to reach USD 26,343.62 million by 2032, at a CAGR of 6.71% during the forecast period.

Eyebrow Makeup Product Market

The Global Eyebrow Makeup Product Market size was valued at USD 1,577.02 million in 2018 to USD 2,573.07 million in 2024 and is anticipated to reach USD 4,780.93 million by 2032, at a CAGR of 7.50% during the forecast period.

Eyelid Scrub Market

The Global Eyelid Scrub Market size was valued at USD 2,238.36 million in 2018, reached USD 3,488.42 million in 2024, and is anticipated to attain USD 6,055.94 million by 2032, at a CAGR of 6.65% during the forecast period.

Ezekiel Bread Market

The Global Ezekiel Bread Market size was valued at USD 239.48 million in 2018 to USD 365.38 million in 2024 and is anticipated to reach USD 615.76 million by 2032, at a CAGR of 6.28% during the forecast period.

Liquid Laundry Detergent Market

The Liquid Laundry Detergent market size was valued at USD 48.17 billion in 2024 and is anticipated to reach USD 68.29 billion by 2032, at a CAGR of 4.46% during the forecast period.

Foot and Ankle Devices Market

The Global Foot and Ankle Devices Market size was valued at USD 3,577.44 million in 2018, increased to USD 5,318.39 million in 2024, and is anticipated to reach USD 8,990.36 million by 2032, at a CAGR of 6.31% during the forecast period.

Licence Option

The report comes as a view-only PDF document, optimized for individual clients. This version is recommended for personal digital use and does not allow printing. Use restricted to one purchaser only.
$4999

To meet the needs of modern corporate teams, our report comes in two formats: a printable PDF and a data-rich Excel sheet. This package is optimized for internal analysis. Unlimited users allowed within one corporate location (e.g., regional office).
$6999

The report will be delivered in printable PDF format along with the report’s data Excel sheet. This license offers 100 Free Analyst hours where the client can utilize Credence Research Inc. research team. Permitted for unlimited global use by all users within the purchasing corporation, such as all employees of a single company.
$12999

Report delivery within 24 to 48 hours

Credence Staff 3

WILLIAM, North America

Support Staff at Credence Research

KEITH PHILLIPS, Europe

Lee - CR Sales Staff

LEE VALLANCE, Asia Pacific

Kieran Jameson

KIERAN JAMESON, Australia

Smallform of Sample request
User Review

Thank you for the data! The numbers are exactly what we asked for and what we need to build our business case.

Materials Scientist
(privacy requested)

User Review

The report was an excellent overview of the Industrial Burners market. This report does a great job of breaking everything down into manageable chunks.

Imre Hof
Management Assistant, Bekaert

cr-clients-logos

Request Sample