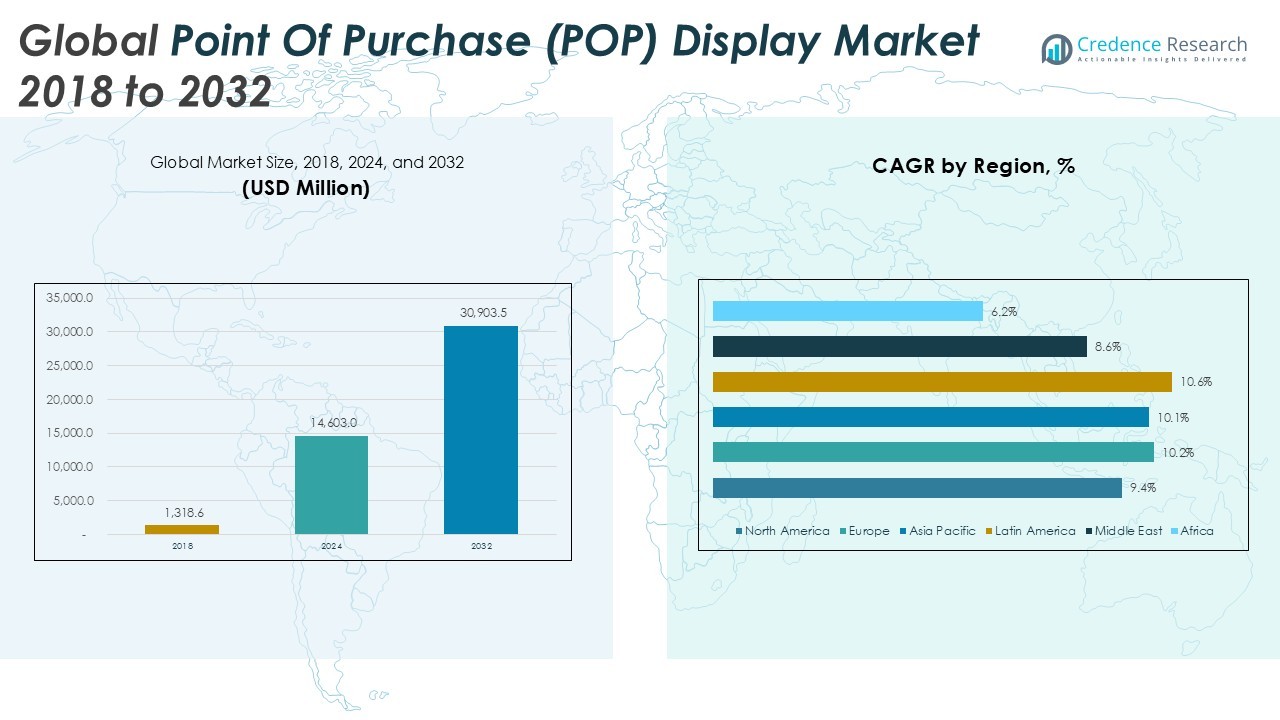
Home » Packaging » Point Of Purchase (POP) Display Market

Point Of Purchase (POP) Display Market By Type (Floor Displays, Countertop Displays, Pallet Displays, Sidekick Displays, Others); By Application (Food & Beverage, Pharmaceuticals, Cosmetics & Personal Care, Electronics, Others); By Style (Temporary POP Displays, Permanent POP Displays); By Material (Corrugated Board, Plastic, Metal, Wood, Others) – Growth, Share, Opportunities & Competitive Analysis, 2024 – 2032

Report ID: 9685 | Report Format : Excel, PDF
REPORT ATTRIBUTE DETAILS
Historical Period 2019-2022
Base Year 2023
Forecast Period 2024-2032
Point of Purchase (POP) Display Market Size 2024 USD 14,630 million
Point of Purchase (POP) Display Market, CAGR 9.61%
Point of Purchase (POP) Display Market Size 2032 USD 30,482.16 million

Market Overview:

The Point of Purchase (POP) Display Market is projected to grow significantly, from USD 14,630 million in 2024 to approximately USD 30,482.16 million by 2032, with a robust CAGR of 9.61% over the forecast period. This growth is driven by increasing retail competition and brands’ focus on attracting consumer attention at the point of sale. POP displays, which include floor displays, end caps, counter displays, and digital signage, are critical tools for enhancing product visibility and boosting sales. Their effectiveness in influencing consumer purchasing decisions has made them a staple in sectors such as food & beverage, cosmetics, electronics, and retail, where brands aim to stand out and engage consumers directly.

Key drivers for market growth include rising consumer preference for in-store shopping experiences and the expanding use of innovative, interactive display technologies. Digital displays, in particular, are gaining traction due to their ability to deliver dynamic, customized content that appeals to consumers and enhances brand recall. Moreover, brands and retailers are investing in eco-friendly materials for POP displays, aligning with sustainability goals and responding to consumer demand for environmentally conscious options. The shift toward experiential shopping has further spurred the adoption of creative POP displays that transform retail spaces and increase foot traffic.

Regionally, North America holds a substantial market share, driven by a well-established retail sector and the high adoption of advanced display technologies in the United States and Canada. Europe closely follows, with significant demand from the UK, Germany, and France, where high retail standards and increasing investments in in-store marketing fuel POP display adoption. The Asia-Pacific region is expected to witness the fastest growth, led by expanding retail sectors in China and India, rising disposable incomes, and a preference for in-store shopping experiences. Emerging economies in Latin America and the Middle East are also seeing increasing investments in retail infrastructure, positioning them as potential growth areas for the POP display market in the coming years.

Access crucial information at unmatched prices!

Request your sample report today & start making informed decisions powered by Credence Research Inc.!

Download Sample

Market Drivers:

Growing Emphasis on Brand Differentiation:

In a competitive retail environment, brands are increasingly investing in POP displays to stand out and capture consumer attention at the point of sale. These displays create brand visibility and provide a platform for communicating key product features. For instance, a 2023 report by the National Retail Federation found that 70% of consumers make purchase decisions in-store, highlighting the importance of POP displays in influencing purchasing behavior. This trend is particularly significant in sectors like cosmetics, electronics, and FMCG, where consumer choice is vast, and brand differentiation is crucial.

Rise of Digital and Interactive Technologies:

The integration of digital and interactive elements in POP displays is revolutionizing in-store marketing, allowing brands to engage customers through dynamic and personalized content. Digital signage, touchscreens, and augmented reality (AR) are transforming traditional displays, making them more engaging and adaptable to consumer preferences. For example, Coca-Cola implemented digital POP displays in select stores in 2022, using real-time data to deliver customized promotions based on time and customer demographics. This interactive approach not only boosts engagement but also enhances the overall shopping experience.

Increasing Focus on Sustainable Display Solutions:

Environmental consciousness is driving brands and retailers toward sustainable POP display solutions, as consumers increasingly expect eco-friendly practices. Many companies are shifting from traditional plastic and metal displays to recyclable or biodegradable materials. For instance, Walmart introduced eco-friendly POP displays in 2023, aligning with its sustainability goals to reduce waste and carbon footprint. As regulatory bodies like the European Union enforce stricter environmental standards, brands are motivated to adopt sustainable practices that resonate with eco-conscious consumers.

Growth in the Retail Sector in Emerging Markets:

The rapid expansion of the retail sector in emerging markets is creating substantial demand for POP displays. Countries like China, India, and Brazil are experiencing rising disposable incomes and urbanization, leading to increased consumer spending and retail activity. According to the World Bank, retail sales in emerging economies grew by an average of 8% annually from 2020 to 2023, indicating strong growth potential. This shift has encouraged brands to leverage POP displays to reach a broader customer base, maximizing visibility and enhancing in-store engagement in these high-growth regions.

Market Trends:

Shift Toward Digital and Smart POP Displays:

A major trend in the POP Display Market is the increasing adoption of digital and smart displays that enhance consumer engagement through dynamic and interactive content. Digital screens, LED displays, and even AI-driven content enable brands to display real-time promotions and tailor messages based on consumer behavior and preferences. For instance, Target implemented smart POP displays in select stores, using motion sensors to activate personalized messages as customers approached. These advancements align with the retail industry’s push toward creating immersive and adaptable in-store experiences.

Growing Popularity of Augmented Reality (AR) in Displays:

Augmented reality (AR) is becoming a popular feature in POP displays, as it enhances customer interaction by overlaying digital information on physical displays. Brands are using AR to allow customers to virtually try products or access additional product information on their smartphones. For example, L’Oréal integrated AR with POP displays in its stores, allowing shoppers to “try on” makeup virtually before purchasing. This trend reflects a focus on merging digital technology with physical retail to provide a unique shopping experience and support purchase decisions.

Adoption of Modular and Customizable POP Displays:

Modular and customizable POP displays are gaining traction as they offer brands flexibility to adapt displays based on store layouts and seasonal promotions. These modular systems can be easily reconfigured, allowing retailers to use the same displays for multiple campaigns, reducing costs and waste. IKEA, for instance, uses modular POP displays that can be adjusted according to seasonal sales or new product launches, maximizing display versatility. This trend caters to brands seeking cost-effective and sustainable solutions that also optimize in-store space utilization.

Emphasis on Eco-Friendly Materials and Designs:

In response to consumer and regulatory demand for sustainable practices, brands are prioritizing eco-friendly materials in their POP displays. Many companies are moving away from traditional plastics toward biodegradable or recycled materials to minimize environmental impact. For example, Unilever implemented POP displays made from recycled materials in 2022, aligning with its global sustainability goals. This trend supports the retail industry’s broader commitment to reducing waste and carbon footprint, catering to environmentally conscious consumers and reinforcing brand loyalty.

Market Challenges Analysis:

Rising Costs of Raw Materials and Production:

One of the primary challenges in the Point of Purchase (POP) Display Market is the rising cost of raw materials, particularly for sustainable options like recycled plastics and biodegradable materials. These materials often come at a premium, increasing production costs for eco-friendly POP displays. Additionally, fluctuations in raw material prices, such as metals and paper, add unpredictability to manufacturing costs, limiting flexibility for smaller companies with limited budgets. This challenge becomes more complex as brands prioritize sustainable practices, pushing the market toward higher-cost materials without fully offsetting these expenses.

Stringent Environmental Regulations:

Strict environmental regulations impact the POP Display Market, requiring companies to meet sustainability standards for materials and production processes. Government authorities, such as the Environmental Protection Agency (EPA) in the United States and the European Union’s regulatory bodies, mandate compliance with guidelines that reduce environmental impact and waste. These regulations, while encouraging eco-friendly practices, increase production costs and complexity for manufacturers. Compliance demands more sophisticated processes, including the use of biodegradable or recyclable materials, which can be costly and challenging to scale.

Rapid Technological Advancements and High Initial Investments:

The rise of digital and interactive displays, while creating new opportunities, requires significant initial investments in technology and training. Retailers adopting these advanced POP displays must invest in digital screens, motion sensors, and AI capabilities, which can be financially challenging for small and mid-sized businesses. Moreover, staying competitive requires frequent technological upgrades, adding to costs. For example, integrating digital elements may demand IT infrastructure, software updates, and employee training, which not all companies can afford, restricting the technology’s adoption to larger brands and retailers.

Limited Flexibility in Customization and Reusability:

While modular and customizable POP displays are on the rise, creating highly adaptable displays remains challenging. Retailers often need to change displays frequently due to seasonal promotions or product launches, and traditional POP displays are often single-use, creating waste and inefficiencies. The inability to reuse displays across multiple campaigns increases both costs and environmental impact, limiting options for companies seeking sustainable and cost-effective solutions. Addressing this challenge requires innovation in materials and design, which can be complex to achieve without sacrificing durability or aesthetic appeal.

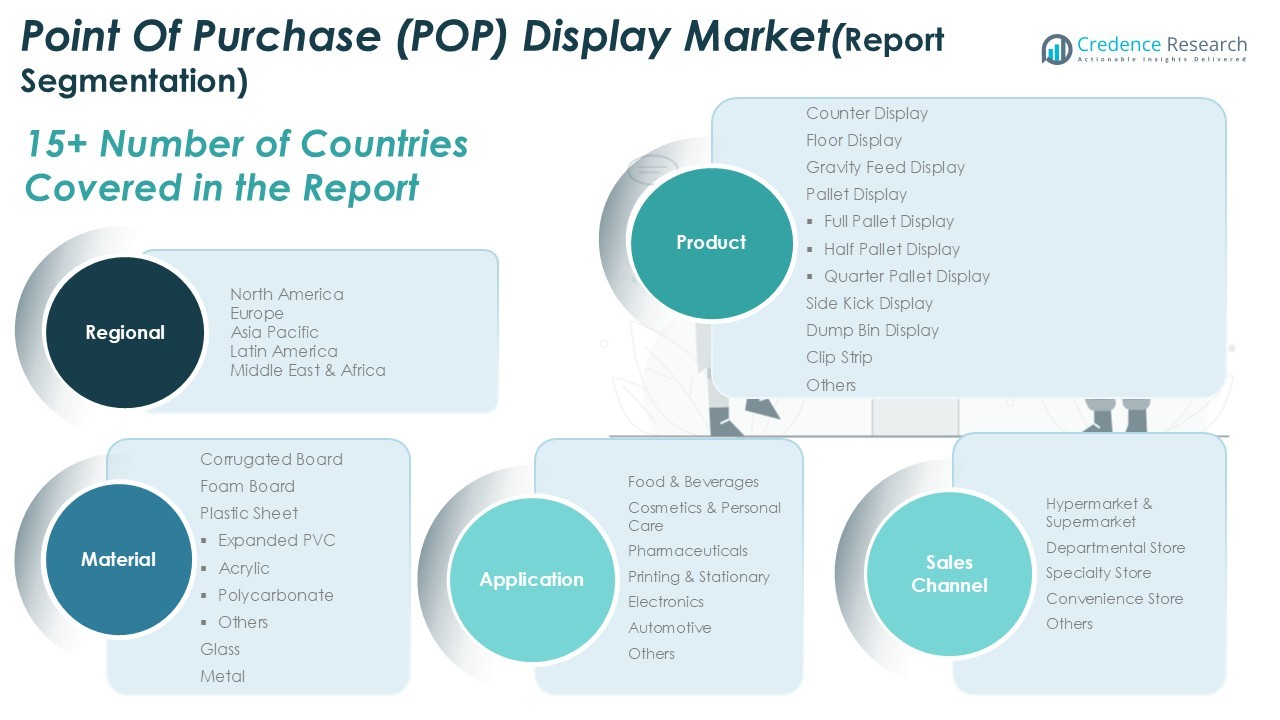
Market Segmentation Analysis: 

By Type

The Point of Purchase (POP) Display Market is segmented by type into floor displays, counter displays, end-cap displays, and digital displays. Floor displays hold a significant market share due to their visibility and effectiveness in high-traffic areas, allowing brands to showcase products prominently. Counter displays are popular in checkout areas where impulse purchases are common, particularly for smaller products. End-cap displays are highly effective for featured products, drawing attention at the ends of aisles in retail environments. Digital displays are rapidly gaining traction, providing dynamic content and enhancing customer engagement through interactive elements.

By Technology

By technology, the market is divided into traditional and digital displays. Traditional displays, which include static signage and product holders, are widely used due to their cost-effectiveness and versatility. However, digital POP displays are growing in demand, driven by their ability to deliver customized, real-time content and engage consumers more effectively. Digital displays, including LED screens and interactive kiosks, are increasingly used in high-end retail environments to provide a modern, immersive shopping experience.

By End User

End-user segmentation includes retail stores, supermarkets, hypermarkets, and convenience stores. Retail stores lead this segment as they frequently utilize POP displays to enhance in-store marketing for various products. Supermarkets and hypermarkets represent substantial market share, using POP displays to influence consumer purchasing decisions in large retail spaces. Convenience stores are also expanding their use of compact displays to maximize limited space and encourage impulse purchases, benefiting from POP displays’ ability to boost product visibility and drive sales.

Segmentations:

  • By Product Type
    • Counter Display
    • Floor Display
    • Gravity Feed Display
    • Pallet Display
      • Full Pallet Display
      • Half Pallet Display
      • Quarter Pallet Display
    • Side Kick Display
    • Dump Bin Display
    • Clip Strip
    • Others
  • By Material Type
    • Corrugated Board
    • Foam Board
    • Plastic Sheet
      • Expanded PVC
      • Acrylic
      • Polycarbonate
      • Others
    • Glass
    • Metal
  • By Sales Channel
    • Hypermarket & Supermarket
    • Departmental Store
    • Specialty Store
    • Convenience Store
    • Others
  • By Application
    • Food & Beverages
    • Cosmetics & Personal Care
    • Pharmaceuticals
    • Printing & Stationary
    • Electronics
    • Automotive
    • Others
  • By Regions
    • North America
      • U.S.
      • Canada
      • Mexico
    • Europe
      • Germany
      • France
      • U.K.
      • Italy
      • Spain
      • Rest of Europe
    • Asia Pacific
      • China
      • Japan
      • India
      • South Korea
      • South-east Asia
      • Rest of Asia Pacific
    • Latin America
      • Brazil
      • Argentina
      • Rest of Latin America
    • Middle East & Africa
      • GCC Countries
      • South Africa
      • Rest of the Middle East and Africa

Regional Analysis:

North America

North America holds the largest share in the global Point of Purchase (POP) Display Market, accounting for approximately 35% of the market. This dominance is driven by a mature retail sector, high consumer spending, and a strong preference for in-store shopping experiences. The United States leads the region, with brands and retailers heavily investing in POP displays to differentiate products and engage consumers at the point of sale. Digital displays are also gaining momentum, as retailers incorporate interactive and dynamic content to appeal to tech-savvy shoppers. Canada follows, contributing to regional growth with increasing adoption of sustainable display solutions, as regulatory bodies like the Environmental Protection Agency (EPA) and Canada’s Ministry of Environment advocate for eco-friendly practices in retail environments.

Europe

Europe represents about 28% of the global POP Display Market, with high demand driven by advanced retail infrastructure and stringent environmental standards. Germany, the United Kingdom, and France lead the region, as brands in these markets adopt innovative POP displays that align with their focus on sustainability and high-quality consumer experiences. The European Union’s regulatory focus on reducing waste and promoting recyclability has led many retailers to adopt eco-friendly materials in POP displays, with a significant emphasis on cardboard, biodegradable plastics, and recyclable components. Additionally, digital signage is becoming popular in high-end European retail stores, reflecting a shift toward personalized, technology-driven customer engagement.

Asia-Pacific

The Asia-Pacific region is anticipated to experience the fastest growth in the POP Display Market, accounting for roughly 22% of global market share. This rapid expansion is driven by the region’s growing retail sector, increasing urbanization, and rising disposable incomes, especially in China and India. As consumer spending power grows, so does demand for in-store shopping experiences, making POP displays a key tool for brands looking to capture attention. China leads in adoption, supported by a booming retail infrastructure and significant investments in advanced display technologies. Japan and South Korea also contribute to the market with a focus on digital displays and interactive technologies, as tech-savvy consumers expect modern, immersive shopping environments.

Latin America, Middle East, and Africa

LAMEA holds approximately 15% of the global POP Display Market, with Latin America, particularly Brazil and Mexico, driving growth as retail sectors expand and consumer spending rises. In the Middle East, the United Arab Emirates and Saudi Arabia lead in the adoption of POP displays, driven by the region’s high-end retail presence and increasing investment in interactive display solutions. Africa, while a smaller market, shows potential as retail infrastructure develops and consumer demand for branded products grows. However, cost-sensitive markets and limited access to advanced materials and technologies can pose challenges. International brands and local retailers in these regions are increasingly investing in POP displays to enhance brand visibility and drive sales, especially in high-traffic areas such as shopping malls and supermarkets.

Shape Your Report to Specific Countries or Regions & Enjoy 30% Off!

Key Player Analysis:

  • DS Smith Plc
  • Smurfit Kappa Group
  • International Paper Company
  • WestRock Company
  • Sonoco Products Company
  • Menasha Packaging Company, LLC
  • Pratt Industries, Inc.
  • Georgia-Pacific LLC
  • Mondi Group
  • Fujifilm Holdings Corporation

Competitive Analysis:

The Point of Purchase (POP) Display Market is highly competitive, with leading companies focusing on innovation, sustainability, and customizable solutions to capture market share. Key players like DS Smith, Smurfit Kappa, and WestRock leverage advanced manufacturing capabilities and eco-friendly materials to meet growing demand for sustainable displays, particularly in Europe and North America, where environmental standards are stringent. These firms benefit from extensive distribution networks, allowing them to serve global brands across various retail sectors. Meanwhile, companies such as Menasha Packaging and Georgia-Pacific are enhancing product design flexibility to cater to rising demand for modular and reusable POP displays. The competition is further intensified by the adoption of digital and interactive technologies in display units, driving major players to invest in R&D and strategic partnerships. As brands seek unique, impactful in-store marketing solutions, POP display manufacturers must continuously innovate to meet evolving client needs and differentiate in this dynamic market.

Recent Developments:

  • Smurfit Kappa completed its acquisition of WestRock in July 2024, forming one of the largest global sustainable packaging companies, named Smurfit WestRock. This merger expands their production and distribution capabilities across 40 countries, integrating advanced packaging solutions with an estimated 15 million tons of recycled fiber usage per year. The merger emphasizes their commitment to sustainable practices and positions Smurfit WestRock as a leader in renewable and recyclable POP displays.
  • DS Smith agreed to a strategic acquisition by International Paper in April 2024, aimed at expanding their presence in North America. This merger strengthens their capability to deliver eco-friendly and innovative POP displays to a broader market, responding to the increasing demand for sustainable packaging solutions across retail sectors.
  • Sonoco acquired Eviosys in 2024 for $3.9 billion, marking a significant shift toward metal-based and sustainable packaging. This acquisition aligns with Sonoco’s strategy to emphasize eco-friendly POP display solutions by diversifying into metal and other recyclable materials, appealing to environmentally conscious brands and consumers.
  • International Paper announced plans in 2023 to invest heavily in sustainable fiber-based packaging, aiming to reduce carbon emissions by 25% across its operations by 2030. This investment supports the development of sustainable POP displays, enhancing the company’s focus on eco-friendly materials that meet regulatory standards in North America and Europe.

Market Concentration & Characteristics:

The Point of Purchase (POP) Display Market is moderately concentrated, with a mix of well-established global players and smaller regional companies competing to meet diverse retail demands. Major players like DS Smith, Smurfit Kappa, and WestRock dominate through extensive production capabilities, innovative materials, and a strong focus on sustainability, catering to high demand for eco-friendly and customizable display solutions. High entry barriers, such as costly manufacturing requirements and stringent environmental regulations, favor established companies that can invest in advanced, sustainable production methods. Smaller firms and niche providers focus on customizable, modular designs to capture market share within specific retail segments. As consumer demand for interactive and digital displays grows, competition has intensified, with major players increasingly adopting digital and smart technologies to enhance customer engagement and drive sales. This competitive landscape requires continuous innovation, sustainability initiatives, and adaptability to evolving retail trends.

Report Coverage:

The research report offers an in-depth analysis based on Product Type, Material Type, Sales Channel, and Application. It details leading market players, providing an overview of their business, product offerings, investments, revenue streams, and key applications. Additionally, the report includes insights into the competitive environment, SWOT analysis, current market trends, as well as the primary drivers and constraints. Furthermore, it discusses various factors that have driven market expansion in recent years. The report also explores market dynamics, regulatory scenarios, and technological advancements that are shaping the industry. It assesses the impact of external factors and global economic changes on market growth. Lastly, it provides strategic recommendations for new entrants and established companies to navigate the complexities of the market.

Future Outlook:

  1. Demand for sustainable POP displays is expected to rise as brands and retailers prioritize eco-friendly materials to meet consumer and regulatory expectations.
  2. Digital and interactive POP displays will see increased adoption, allowing brands to engage customers through dynamic and customizable content.
  3. Growth in emerging markets will drive the market, with rising consumer spending and expanding retail infrastructure in Asia-Pacific, Latin America, and the Middle East.
  4. Modular and reusable POP displays will become more popular, providing flexibility for brands to adapt displays for different promotions and reducing overall costs.
  5. Advanced technologies like AI and augmented reality (AR) in POP displays will enhance personalized customer experiences and improve engagement rates.
  6. High-end retailers are likely to adopt smart displays with real-time data analytics, optimizing in-store marketing effectiveness.
  7. Retailers will increasingly use POP displays to promote exclusive, limited-time products, boosting foot traffic and encouraging impulse purchases.
  8. Continued focus on lightweight and recyclable materials will improve the market’s sustainability profile, aligning with global green initiatives.
  9. Investment in customizable and compact displays will grow, catering to convenience stores and small retail spaces.
  10. Strategic mergers and acquisitions will continue as companies expand their geographic reach and technological capabilities in the POP display sector.

CHAPTER NO. 1 : INTRODUCTION 21
1.1. Report Description 21
Purpose of the Report 21
USP & Key Offerings 21
1.2. Key Benefits for Stakeholders 21
1.3. Target Audience 22
1.4. Report Scope 22
CHAPTER NO. 2 : EXECUTIVE SUMMARY 23
2.1. Global PoP Display Market Snapshot 23
2.2. Global PoP Display Market, 2018 – 2032 (Units) (USD Million) 25
2.3. Insights from Primary Respondents 26
CHAPTER NO. 3 : GLOBAL POP DISPLAY MARKET – INDUSTRY ANALYSIS 27
3.1. Introduction 27
3.2. Market Drivers 28
3.3. Growing Retail Industry and Consumer Demand for Visual Merchandising 28
3.4. Rising Preference for Customization and Interactive Displays 29
3.5. Market Restraints 30
3.5.1. Rising Costs of Raw Materials and Production 30
3.6. Market Opportunities 31
3.7. Market Opportunity Analysis 31
3.8. Porter’s Five Forces Analysis 32
CHAPTER NO. 4 : ANALYSIS COMPETITIVE LANDSCAPE 33
4.1. Company Market Share Analysis – 2023 33
4.1.1. Global PoP Display Market: Company Market Share, by Volume, 2023 33
4.1.2. Global PoP Display Market: Company Market Share, by Revenue, 2023 34
4.1.3. Global PoP Display Market: Top 6 Company Market Share, by Revenue, 2023 34
4.1.4. Global PoP Display Market: Top 3 Company Market Share, by Revenue, 2023 35
4.2. Global PoP Display Market Company Volume Market Share, 2023 36
4.3. Global PoP Display Market Company Revenue Market Share, 2023 38
4.4. Strategic Developments 40
4.4.1. Acquisitions & Mergers 40
New Product Launch 40
Regional Expansion 40
4.5. Key Players Product Matrix 41
CHAPTER NO. 5 : PESTEL & ADJACENT MARKET ANALYSIS 42
5.1. PESTEL 42
5.1.1. Political Factors 42
5.1.2. Economic Factors 42
5.1.3. Social Factors 42
5.1.4. Technological Factors 42
5.1.5. Environmental Factors 42
5.1.6. Legal Factors 42
5.2. Adjacent Market Analysis 42
CHAPTER NO. 6 : GLOBAL POP DISPLAY MARKET – BY TYPE SEGMENT ANALYSIS 43
6.1. Global PoP Display Market Overview, by Type Segment 43
6.1.1. Global PoP Display Market Volume Share, By Type, 2023 & 2032 44
6.1.2. Global PoP Display Market Revenue Share, By Type, 2023 & 2032 44
6.1.3. Global PoP Display Market Attractiveness Analysis, By Type 45
6.1.4. Incremental Revenue Growth Opportunity, by Type, 2024 – 2032 45
6.1.5. Global PoP Display Market Revenue, By Type, 2018, 2023, 2027 & 2032 46
6.2. Floor Displays 47
6.3. Countertop Displays 48
6.4. Pallet Displays 49
6.5. Sidekick Displays 50
6.6. Others (Spinner Displays, Retail Signage, etc.) 51
CHAPTER NO. 7 : GLOBAL POP DISPLAY MARKET – BY APPLICATION SEGMENT ANALYSIS 52
7.1. Global PoP Display Market Overview, by Application Segment 52
7.1.1. Global PoP Display Market Volume Share, By Application, 2023 & 2032 53
7.1.2. Global PoP Display Market Revenue Share, By Application, 2023 & 2032 53
7.1.3. Global PoP Display Market Attractiveness Analysis, By Application 54
7.1.4. Incremental Revenue Growth Opportunity, by Application, 2024 – 2032 54
7.1.5. Global PoP Display Market Revenue, By Application, 2018, 2023, 2027 & 2032 55
7.2. Food & Beverage 56
7.3. Pharmaceuticals 57
7.4. Cosmetics & Personal Care 58
7.5. Electronics 59
7.6. Others 60
CHAPTER NO. 8 : GLOBAL POP DISPLAY MARKET – BY STYLE SEGMENT ANALYSIS 61
8.1. Global PoP Display Market Overview, by Style Segment 61
8.1.1. Global PoP Display Market Volume Share, By Style, 2023 & 2032 62
8.1.2. Global PoP Display Market Revenue Share, By Style, 2023 & 2032 62
8.1.3. Global PoP Display Market Attractiveness Analysis, By Style 63
8.1.4. Incremental Revenue Growth Opportunity, by Style, 2024 – 2032 63
8.1.5. Global PoP Display Market Revenue, By Style, 2018, 2023, 2027 & 2032 64
8.2. Temporary POP Displays 65
8.3. Permanent POP Displays 66
CHAPTER NO. 9 : GLOBAL POP DISPLAY MARKET – BY MATERIAL SEGMENT ANALYSIS 67
9.1. Global PoP Display Market Overview, by Material Segment 67
9.1.1. Global PoP Display Market Volume Share, By Material, 2023 & 2032 68
9.1.2. Global PoP Display Market Revenue Share, By Material, 2023 & 2032 68
9.1.3. Global PoP Display Market Attractiveness Analysis, By Material 69
9.1.4. Incremental Revenue Growth Opportunity, by Material, 2024 – 2032 69
9.1.5. Global PoP Display Market Revenue, By Material, 2018, 2023, 2027 & 2032 70
9.2. Corrugated Board 71
9.3. Plastic 72
9.4. Metal 73
9.5. Wood 74
9.6. Others 75
CHAPTER NO. 10 : POP DISPLAY MARKET – NORTH AMERICA 76
10.1. North America 76
10.1.1. Key Highlights 76
10.1.2. North America PoP Display Market Volume, By Country, 2018 – 2032 (Units) 77
10.1.3. North America PoP Display Market Revenue, By Country, 2018 – 2023 (USD Million) 78
10.1.4. North America PoP Display Market Volume, By Type, 2018 – 2023 (Units) 79
10.1.5. North America PoP Display Market Revenue, By Type, 2018 – 2023 (USD Million) 80
10.1.6. North America PoP Display Market Volume, By Application, 2018 – 2023 (Units) 81
10.1.7. North America PoP Display Market Revenue, By Application, 2018 – 2023 (USD Million) 82
10.1.8. North America PoP Display Market Volume, By Style, 2018 – 2023 (Units) 83
10.1.9. North America PoP Display Market Revenue, By Style, 2018 – 2023 (USD Million) 84
10.1.10. North America PoP Display Market Volume, By Material, 2018 – 2023 (Units) 85
10.1.11. North America PoP Display Market Revenue, By Material, 2018 – 2023 (USD Million) 86
10.2. U.S. 87
10.3. Canada 87
10.4. Mexico 87
CHAPTER NO. 11 : POP DISPLAY MARKET – ASIA PACIFIC 88
11.1. Asia Pacific 88
11.1.1. Key Highlights 88
11.1.2. Asia Pacific PoP Display Market Volume, By Country, 2018 – 2032 (Units) 89
11.1.3. Asia Pacific PoP Display Market Revenue, By Country, 2018 – 2023 (USD Million) 90
11.1.5. Asia Pacific PoP Display Market Revenue, By Type, 2018 – 2023 (USD Million) 91
11.1.6. Asia Pacific PoP Display Market Volume, By Application, 2018 – 2023 (Units) 92
11.1.7. Asia Pacific PoP Display Market Revenue, By Application, 2018 – 2023 (USD Million) 93
11.1.8. Asia Pacific PoP Display Market Volume, By Style, 2018 – 2023 (Units) 94
11.1.9. Asia Pacific PoP Display Market Revenue, By Style, 2018 – 2023 (USD Million) 95
11.1.10. Asia Pacific PoP Display Market Volume, By Material, 2018 – 2023 (Units) 96
11.1.11. Asia Pacific PoP Display Market Revenue, By Material, 2018 – 2023 (USD Million) 97
11.1. China 98
11.2. Japan 98
11.3. South Korea 98
11.4. India 98
11.5. Australia 98
11.6. Thailand 98
11.7. Indonesia 98
11.8. Vietnam 98
11.9. Malaysia 98
11.10. Philippines 98
11.11. Taiwan 98
11.12. Rest of Asia Pacific 98
CHAPTER NO. 12 : POP DISPLAY MARKET – LATIN AMERICA 99
12.1. Latin America 99
12.1.1. Key Highlights 99
12.1.2. Latin America PoP Display Market Volume, By Country, 2018 – 2032 (Units) 100
12.1.3. Latin America PoP Display Market Revenue, By Country, 2018 – 2023 (USD Million) 101
12.1.5. Latin America PoP Display Market Revenue, By Type, 2018 – 2023 (USD Million) 102
12.1.6. Latin America PoP Display Market Volume, By Application, 2018 – 2023 (Units) 103
12.1.7. Latin America PoP Display Market Revenue, By Application, 2018 – 2023 (USD Million) 104
12.1.8. Latin America PoP Display Market Volume, By Style, 2018 – 2023 (Units) 105
12.1.9. Latin America PoP Display Market Revenue, By Style, 2018 – 2023 (USD Million) 106
12.1.10. Latin America PoP Display Market Volume, By Material, 2018 – 2023 (Units) 107
12.1.11. Latin America PoP Display Market Revenue, By Material, 2018 – 2023 (USD Million) 108
12.2. Brazil 109
12.3. Argentina 109
12.4. Peru 109
12.5. Chile 109
12.6. Colombia 109
12.7. Rest of Latin America 109
CHAPTER NO. 13 : COMPANY PROFILES 110
13.1. International Paper Company 110
13.1.1. Company Overview 110
13.1.2. Product Portfolio 110
13.1.3. Swot Analysis 110
13.2. Business Strategy 110
13.3. Financial Overview 111
13.4. DS Smith Plc 112
13.5. Smurfit Kappa Group Plc 112
13.6. Menasha Packaging Company, LLC. 112
13.7. Menasha Packaging Company, LLC. Sonoco Product Company 112
13.8. Georgia-Pacific LLC. 112
13.9. WestRock Company 112
13.10. Pratt Industries Inc. 112
13.11. Marketing Alliance Group 112
13.12. FFR Merchandising Company 112
13.13. HH Global 112
13.14. RR Donnelley 112
13.15. Quad/Graphics 112
13.16. LSC Communications 112
13.17. Taylor Corporation 112
13.18. Transcontinental Inc. 112
13.19. CJK Group 112
13.20. Canon Managed Print Services 112
13.21. Ricoh Managed Print Services 112
13.22. Xerox Managed Print Services 112
13.23. Brand Addition 112
13.24. Williams Lea Tag 112
13.25. St. Ives Group 112
13.26. Innerworkings 112
13.27. DS Smith 112

List of Figures
FIG NO. 1. Global PoP Display Market Volume & Revenue, 2018 – 2032 (Units) (USD Million) 25
FIG NO. 2. Porter’s Five Forces Analysis for Global PoP Display Market 32
FIG NO. 3. Company Share Analysis, 2023 33
FIG NO. 4. Company Share Analysis, 2023 34
FIG NO. 5. Company Share Analysis, 2023 34
FIG NO. 6. Company Share Analysis, 2023 35
FIG NO. 7. Global PoP Display Market – Company Volume Market Share, 2023 36
FIG NO. 8. Global PoP Display Market – Company Revenue Market Share, 2023 38
FIG NO. 9. Global PoP Display Market Volume Share, By Type, 2023 & 2032 44
FIG NO. 10. Global PoP Display Market Revenue Share, By Type, 2023 & 2032 44
FIG NO. 11. Market Attractiveness Analysis, By Type 45
FIG NO. 12. Incremental Revenue Growth Opportunity by Type, 2024 – 2032 45
FIG NO. 13. Global PoP Display Market Revenue, By Type, 2018, 2023, 2027 & 2032 46
FIG NO. 14. Global PoP Display Market for Floor Displays, Volume & Revenue (Units) (USD Million) 2018 – 2032 47
FIG NO. 15. Global PoP Display Market for Countertop Displays, Volume & Revenue (Units) (USD Million) 2018 – 2032 48
FIG NO. 16. Global PoP Display Market for Pallet Displays, Volume & Revenue (Units) (USD Million) 2018 – 2032 49
FIG NO. 17. Global PoP Display Market for Sidekick Displays, Volume & Revenue (Units) (USD Million) 2018 – 2032 50
FIG NO. 18. Global PoP Display Market for Others (Spinner Displays, Retail Signage, etc.), Volume & Revenue (Units) (USD Million) 2018 – 2032 51
FIG NO. 19. Global PoP Display Market Volume Share, By Application, 2023 & 2032 53
FIG NO. 20. Global PoP Display Market Revenue Share, By Application, 2023 & 2032 53
FIG NO. 21. Market Attractiveness Analysis, By Application 54
FIG NO. 22. Incremental Revenue Growth Opportunity by Application, 2024 – 2032 54
FIG NO. 23. Global PoP Display Market Revenue, By Application, 2018, 2023, 2027 & 2032 55
FIG NO. 24. Global PoP Display Market for Food & Beverage, Volume & Revenue (Units) (USD Million) 2018 – 2032 56
FIG NO. 25. Global PoP Display Market for Pharmaceuticals, Volume & Revenue (Units) (USD Million) 2018 – 2032 57
FIG NO. 26. Global PoP Display Market for Cosmetics & Personal Care, Volume & Revenue (Units) (USD Million) 2018 – 2032 58
FIG NO. 27. Global PoP Display Market for Electronics, Volume & Revenue (Units) (USD Million) 2018 – 2032 59
FIG NO. 28. Global PoP Display Market for Others, Volume & Revenue (Units) (USD Million) 2018 – 2032 60
FIG NO. 29. Global PoP Display Market Volume Share, By Style, 2023 & 2032 62
FIG NO. 30. Global PoP Display Market Revenue Share, By Style, 2023 & 2032 62
FIG NO. 31. Market Attractiveness Analysis, By Style 63
FIG NO. 32. Incremental Revenue Growth Opportunity by Style, 2024 – 2032 63
FIG NO. 33. Global PoP Display Market Revenue, By Style, 2018, 2023, 2027 & 2032 64
FIG NO. 34. Global PoP Display Market for Temporary POP Displays, Volume & Revenue (Units) (USD Million) 2018 – 2032 65
FIG NO. 35. Global PoP Display Market for Permanent POP Displays, Volume & Revenue (Units) (USD Million) 2018 – 2032 66
FIG NO. 36. Global PoP Display Market Volume Share, By Material, 2023 & 2032 68
FIG NO. 37. Global PoP Display Market Revenue Share, By Material, 2023 & 2032 68
FIG NO. 38. Market Attractiveness Analysis, By Material 69
FIG NO. 39. Incremental Revenue Growth Opportunity by Material, 2024 – 2032 69
FIG NO. 40. Global PoP Display Market Revenue, By Material, 2018, 2023, 2027 & 2032 70
FIG NO. 41. Global PoP Display Market for Corrugated Board, Volume & Revenue (Units) (USD Million) 2018 – 2032 71
FIG NO. 42. Global PoP Display Market for Plastic, Volume & Revenue (Units) (USD Million) 2018 – 2032 72
FIG NO. 43. Global PoP Display Market for Metal, Volume & Revenue (Units) (USD Million) 2018 – 2032 73
FIG NO. 44. Global PoP Display Market for Wood, Volume & Revenue (Units) (USD Million) 2018 – 2032 74
FIG NO. 45. Global PoP Display Market for Others, Volume & Revenue (Units) (USD Million) 2018 – 2032 75
FIG NO. 46. North America PoP Display Market Volume & Revenue, 2018 – 2032 (Units) (USD Million) 76
FIG NO. 47. Asia Pacific PoP Display Market Volume & Revenue, 2018 – 2032 (Units) (USD Million) 88
FIG NO. 48. Latin America PoP Display Market Volume & Revenue, 2018 – 2032 (Units) (USD Million) 99

List of Tables
TABLE NO. 1. : Global PoP Display Market: Snapshot 23
TABLE NO. 2. : Drivers for the Global PoP Display Market: Impact Analysis 28
TABLE NO. 3. : Restraints for the Global PoP Display Market: Impact Analysis 30
TABLE NO. 4. : North America PoP Display Market Volume, By Country, 2018 – 2023 (Units) 77
TABLE NO. 5. : North America PoP Display Market Volume, By Country, 2024 – 2032 (Units) 77
TABLE NO. 6. : North America PoP Display Market Revenue, By Country, 2018 – 2023 (USD Million) 78
TABLE NO. 7. : North America PoP Display Market Revenue, By Country, 2024 – 2032 (USD Million) 78
TABLE NO. 8. : North America PoP Display Market Volume, By Type, 2018 – 2023 (Units) 79
TABLE NO. 9. : North America PoP Display Market Volume, By Type, 2024 – 2032 (Units) 79
TABLE NO. 10. : North America PoP Display Market Revenue, By Type, 2018 – 2023 (USD Million) 80
TABLE NO. 11. : North America PoP Display Market Revenue, By Type, 2024 – 2032 (USD Million) 80
TABLE NO. 12. : North America PoP Display Market Volume, By Application, 2018 – 2023 (Units) 81
TABLE NO. 13. : North America PoP Display Market Volume, By Application, 2024 – 2032 (Units) 81
TABLE NO. 14. : North America PoP Display Market Revenue, By Application, 2018 – 2023 (USD Million) 82
TABLE NO. 15. : North America PoP Display Market Revenue, By Application, 2024 – 2032 (USD Million) 82
TABLE NO. 16. : North America PoP Display Market Volume, By Style, 2018 – 2023 (Units) 83
TABLE NO. 17. : North America PoP Display Market Volume, By Style, 2024 – 2032 (Units) 83
TABLE NO. 18. : North America PoP Display Market Revenue, By Style, 2018 – 2023 (USD Million) 84
TABLE NO. 19. : North America PoP Display Market Revenue, By Style, 2024 – 2032 (USD Million) 84
TABLE NO. 20. : North America PoP Display Market Volume, By Material, 2018 – 2023 (Units) 85
TABLE NO. 21. : North America PoP Display Market Volume, By Material, 2024 – 2032 (Units) 85
TABLE NO. 22. : North America PoP Display Market Revenue, By Material, 2018 – 2023 (USD Million) 86
TABLE NO. 23. : North America PoP Display Market Revenue, By Material, 2024 – 2032 (USD Million) 86
TABLE NO. 24. : Asia Pacific PoP Display Market Volume, By Country, 2018 – 2023 (Units) 89
TABLE NO. 25. : Asia Pacific PoP Display Market Volume, By Country, 2024 – 2032 (Units) 89
TABLE NO. 26. : Asia Pacific PoP Display Market Revenue, By Country, 2018 – 2023 (USD Million) 90
TABLE NO. 27. : Asia Pacific PoP Display Market Revenue, By Country, 2024 – 2032 (USD Million) 90
TABLE NO. 28. : Asia Pacific PoP Display Market Revenue, By Type, 2018 – 2023 (USD Million) 91
TABLE NO. 29. : Asia Pacific PoP Display Market Revenue, By Type, 2024 – 2032 (USD Million) 91
TABLE NO. 30. : Asia Pacific PoP Display Market Volume, By Application, 2018 – 2023 (Units) 92
TABLE NO. 31. : Asia Pacific PoP Display Market Volume, By Application, 2024 – 2032 (Units) 92
TABLE NO. 32. : Asia Pacific PoP Display Market Revenue, By Application, 2018 – 2023 (USD Million) 93
TABLE NO. 33. : Asia Pacific PoP Display Market Revenue, By Application, 2024 – 2032 (USD Million) 93
TABLE NO. 34. : Asia Pacific PoP Display Market Volume, By Style, 2018 – 2023 (Units) 94
TABLE NO. 35. : Asia Pacific PoP Display Market Volume, By Style, 2024 – 2032 (Units) 94
TABLE NO. 36. : Asia Pacific PoP Display Market Revenue, By Style, 2018 – 2023 (USD Million) 95
TABLE NO. 37. : Asia Pacific PoP Display Market Revenue, By Style, 2024 – 2032 (USD Million) 95
TABLE NO. 38. : Asia Pacific PoP Display Market Volume, By Material, 2018 – 2023 (Units) 96
TABLE NO. 39. : Asia Pacific PoP Display Market Volume, By Material, 2024 – 2032 (Units) 96
TABLE NO. 40. : Asia Pacific PoP Display Market Revenue, By Material, 2018 – 2023 (USD Million) 97
TABLE NO. 41. : Asia Pacific PoP Display Market Revenue, By Material, 2024 – 2032 (USD Million) 97
TABLE NO. 42. : Latin America PoP Display Market Volume, By Country, 2018 – 2023 (Units) 100
TABLE NO. 43. : Latin America PoP Display Market Volume, By Country, 2024 – 2032 (Units) 100
TABLE NO. 44. : Latin America PoP Display Market Revenue, By Country, 2018 – 2023 (USD Million) 101
TABLE NO. 45. : Latin America PoP Display Market Revenue, By Country, 2024 – 2032 (USD Million) 101
TABLE NO. 46. : Latin America PoP Display Market Revenue, By Type, 2018 – 2023 (USD Million) 102
TABLE NO. 47. : Latin America PoP Display Market Revenue, By Type, 2024 – 2032 (USD Million) 102
TABLE NO. 48. : Latin America PoP Display Market Volume, By Application, 2018 – 2023 (Units) 103
TABLE NO. 49. : Latin America PoP Display Market Volume, By Application, 2024 – 2032 (Units) 103
TABLE NO. 50. : Latin America PoP Display Market Revenue, By Application, 2018 – 2023 (USD Million) 104
TABLE NO. 51. : Latin America PoP Display Market Revenue, By Application, 2024 – 2032 (USD Million) 104
TABLE NO. 52. : Latin America PoP Display Market Volume, By Style, 2018 – 2023 (Units) 105
TABLE NO. 53. : Latin America PoP Display Market Volume, By Style, 2024 – 2032 (Units) 105
TABLE NO. 54. : Latin America PoP Display Market Revenue, By Style, 2018 – 2023 (USD Million) 106
TABLE NO. 55. : Latin America PoP Display Market Revenue, By Style, 2024 – 2032 (USD Million) 106
TABLE NO. 56. : Latin America PoP Display Market Volume, By Material, 2018 – 2023 (Units) 107
TABLE NO. 57. : Latin America PoP Display Market Volume, By Material, 2024 – 2032 (Units) 107
TABLE NO. 58. : Latin America PoP Display Market Revenue, By Material, 2018 – 2023 (USD Million) 108
TABLE NO. 59. : Latin America PoP Display Market Revenue, By Material, 2024 – 2032 (USD Million) 108


Request Free Sample

Ready to Transform Data into Decisions?

Request Your Sample Report and Start Your Journey of Informed Choices


Providing the strategic compass for industry titans.

cr-clients-logos

Frequently Asked Questions:

What is the current size of the Global PoP Display Market?

The Point of Purchase (POP) Display Market is valued at approximately USD 14,630 million in 2024, with strong growth projected over the coming years.

What factors are driving the growth of the Global PoP Display Market?

Key drivers include increased retail spending, rising demand for personalized shopping experiences, and technological advancements such as digital and interactive displays.

Which regions are showing the most growth in the PoP Display Market?

North America and Europe lead in market share due to mature retail markets, while the Asia-Pacific region is expected to experience the highest growth rate due to rapid urbanization and increasing disposable incomes.

What are some challenges faced by the Global PoP Display Market?

Major challenges include the high cost of advanced technologies and difficulties in ensuring environmental sustainability while maintaining display performance and cost-effectiveness.

Who are the major players in the Global PoP Display Market?

Major players in the Global PoP Display Market include Sonoco Products Company, DS Smith Plc, International Paper Company, Smurfit Kappa Group Plc, Menasha Packaging Company, LLC., WestRock Company, Georgia-Pacific LLC, Pratt Industries Inc., Felbro, Inc., Marketing Alliance Group, Bling Packaging & Displays, TPH North America Solutions, FFR Merchandising Company, Creative Displays Now, U.S. Corrugated, Inc, Array, Rapid, and Outform.

About Author

Rajdeep Kumar Deb

Rajdeep Kumar Deb

Lead Analyst – Consumer & Finance

Rajdeep brings a decade of consumer goods and financial services insight to strategic market analysis.

View Profile

Related Reports By Keyword

Biometric Point Of Sale Terminals Market

The biometric point of sale terminals market is projected to grow from USD 9,180 million in 2024 to USD 26,113.3 million by 2032, registering a CAGR of 13.96% during the forecast period.

Unified Endpoint Management Market

The Unified endpoint management market    size was valued at USD 6604 million in 2024 and is anticipated to reach USD 32623.6 million by 2032, at a CAGR of 22.1 % during the forecast period (2024-2032).

Digital Point and Shoot Camera Market

Digital Point and Shoot Camera Market size was valued at USD 7,550 million in 2024 and is anticipated to reach USD 10,333 million by 2032, at a CAGR of 4% during the forecast period (2024-2032).

3D Point Cloud Processing Software Market

The 3D Point Cloud Processing Software Market is projected to grow from USD 1,200 million in 2024 to USD 3,035.42 million by 2032, at a compound annual growth rate (CAGR) of 12.3% during the forecast period.

Endpoint Security Market

Endpoint Security Market size was valued at USD 14808.21 million in 2024 and is anticipated to reach USD 28231.69 million by 2032, at a CAGR of 8.4% during the forecast period (2024-2032).

Wireless Access Point Market

The global Wireless Access Point Market is projected to grow from USD 5,619.00 million in 2024 to an estimated USD 9,091.90 million by 2032, with a compound annual growth rate (CAGR) of 6.20% from 2025 to 2032.

Point of Sale (POS) Printers Market

The Point of Sale (POS) Printers Market is projected to grow from USD 14,337.2 million in 2024 to USD 39,484.91 million by 2032, at a compound annual growth rate (CAGR) of 13.5%.

Point of Care Breathalyzer Market

The Point of Care Breathalyzer Market is expected to grow from USD 730 million in 2024 to USD 1,154.75 million by 2032, at a compound annual growth rate (CAGR) of 5.9%.

Point of Care Opioid Testing Market

The Point of Care Opioid Testing Market is projected to grow from USD 475.9 million in 2024 to USD 719.35 million by 2032, with a compound annual growth rate (CAGR) of 5.3%.

Purchase Options

The report comes as a view-only PDF document, optimized for individual clients. This version is recommended for personal digital use and does not allow printing. Use restricted to one purchaser only.
$4999

To meet the needs of modern corporate teams, our report comes in two formats: a printable PDF and a data-rich Excel sheet. This package is optimized for internal analysis. Unlimited users allowed within one corporate location (e.g., regional office).
$6999

The report will be delivered in printable PDF format along with the report’s data Excel sheet. This license offers 100 Free Analyst hours where the client can utilize Credence Research Inc. research team. Permitted for unlimited global use by all users within the purchasing corporation, such as all employees of a single company.
$12999

Credence Staff 3

WILLIAM, North America

Support Staff at Credence Research

KEITH PHILLIPS, Europe

Lee - CR Sales Staff

LEE VALLANCE, Asia Pacific

Kieran Jameson

KIERAN JAMESON, Australia

Report delivery within 24 to 48 hours

User Review

Thank you for the data! The numbers are exactly what we asked for and what we need to build our business case.

Materials Scientist
(privacy requested)

User Review

The report was an excellent overview of the Industrial Burners market. This report does a great job of breaking everything down into manageable chunks.

Imre Hof
Management Assistant, Bekaert

cr-clients-logos

Request Sample