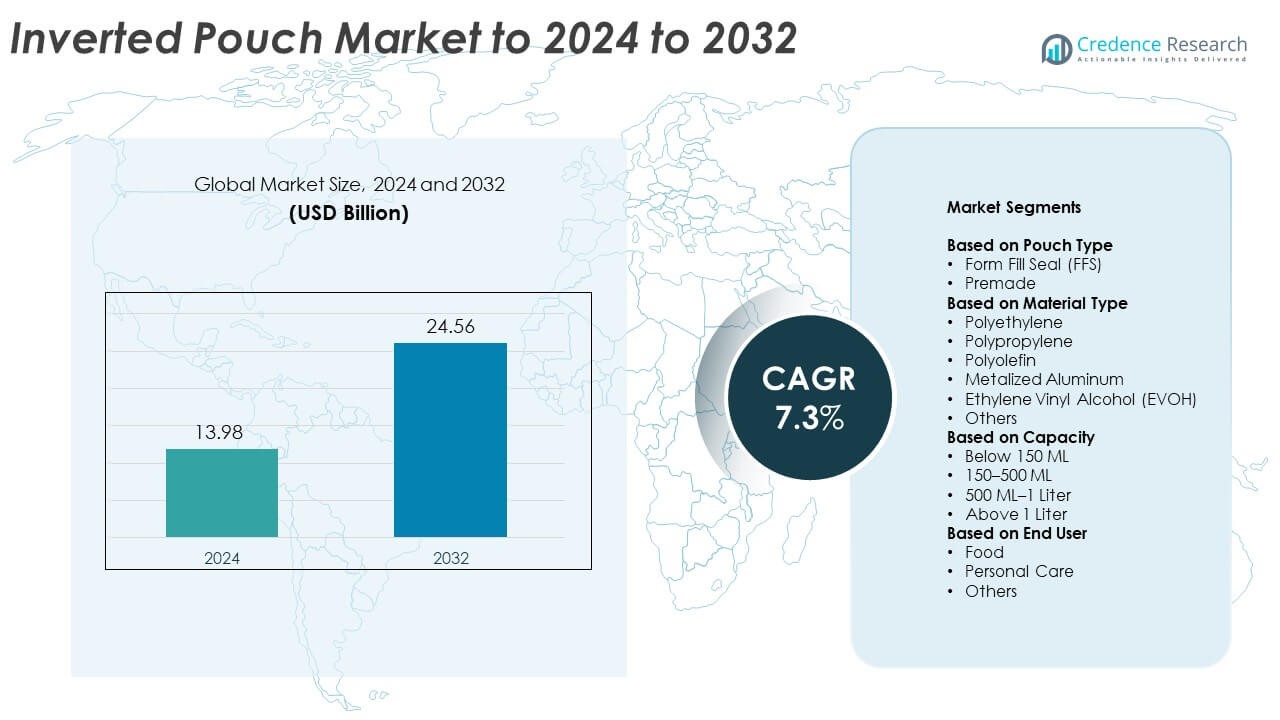
Home » Packaging » Inverted Pouch Market

Inverted Pouch Market By Pouch Type (Form Fill Seal (FFS), Premade), By Material Type (Polyethylene, Polypropylene, Polyolefin, Metalized Aluminum, Ethylene Vinyl Alcohol (EVOH), Others), By Capacity (Below 150 ML, 150-500 ML, 500ml -1 Liter, Above 1 Liter), By End User (Food, Personal Care, Others), By Region – Global Growth, Future Prospects & Competitive Analysis, 2022 – 2030

Price: $4999

Published: | Report ID: 27027 | Report Format : PDF

Inverted Pouch Market Overview

The market for inverted pouches, a flexible packaging solution, was valued at USD 11,448.91 million in 2022. It is projected to expand to USD 18,352.98 million by 2030, progressing at a compound annual growth rate (CAGR) of 6.97% from 2023 to 2030. These pouches, commonly utilized for packaging food products like condiments and sauces, as well as personal care items, are gaining traction due to their ease and flexibility.

There is an escalating demand for secure and cost-efficient transport methods for potentially hazardous food and beverage products and petroleum substances. This need is propelling the demand for robust packaging solutions. Concurrently, increased public awareness regarding the environmental impact of packaging and a growing preference for reducing packaging-related greenhouse gas emissions are fostering a shift towards environmentally friendly packaging options. As a result, there is a heightened demand for inverted pouches crafted from eco-friendly materials, significantly contributing to the growth of the inverted pouch market.

An “inverted pouch”  refers to a pouch or bag turned inside out, so the interior is exposed. In a medical or surgical setting, it could describe a bodily organ that is folded onto itself in a pouch-like manner, either as a condition or a surgical technique. In design and manufacturing, it denotes a bag or container with an “inside-out” design feature, perhaps for functionality or aesthetic purposes. In outdoor or camping gear, this term might indicate a storage pouch designed for easy access, cleaning, or conversion into another form of equipment.

Inverted Pouch Market

Design Element 2

Access crucial information at unmatched prices!

Request your free sample report today & start making informed decisions powered by Credence Research!

Download Free Sample
CTA Design Element 3

Inverted Pouch Market Trends and Drivers

Inverted pouches are becoming a popular choice in product packaging due to their distinctive design and user-friendly features. The eye-catching design of inverted pouches helps manufacturers’ products stand out on retail shelves, offering a visual appeal that differentiates them from competitors. This aesthetic advantage is complemented by the practicality of the inverted design, which facilitates easy dispensing of the product, enhancing the overall user experience. Such design innovations not only attract consumer attention but also improve functionality, making these pouches a preferred packaging option in various industries.

Moreover, the growth of the inverted pouch market is significantly influenced by the shift towards eco-friendly materials. The increasing number of retail industries, coupled with substantial investments by key players in the development of recyclable and environmentally friendly packaging materials, has propelled this market forward. Additionally, manufacturers are focusing on leveraging the unique design of inverted pouches to establish strong business relations with food manufacturers, thereby enhancing product visibility in retail stores. This strategy aligns with changing consumer lifestyles, where the demand for ready-to-eat meals, packaged food, and instant drinks is escalating, further boosting the demand for inverted pouches. This trend reflects a growing consumer preference for convenience, sustainability, and innovative packaging solutions.

Inverted Pouch Market Restraints

The inverted pouch market faces several challenges that hinder its growth, primarily due to the fluctuating prices of raw materials. The uncertainty in raw material costs has led to increased prices for the pouches, limiting the market’s expansion. Additionally, the market has been significantly impacted by disruptions in manufacturing during lockdown periods, attributed to shortages in raw materials and manpower. This halt in production has not only affected the global supply of inverted pouches but also anticipates a slow recovery throughout the forecast period. Compounding these issues is the decline in the manufacture and demand for various types of equipment, further restraining the market’s growth potential and posing challenges to its long-term sustainability.

Competitive Analysis

The Inverted Pouch market is witnessing substantial growth and is characterized by the presence of several major market players. The key players profiled in the inverted pouch market analysis include,

  • Amcor Plc
  • APTAR
  • Cheer Pack
  • Constantia
  • Coveris
  • Glenroy Inc.
  • Goglio SpA
  • Mattpack Inc.
  • Mondi
  • Polymer Packaging Inc.
  • Pouches Inc.
  • ProAmpac
  • Sealed Air
  • Semco S.A.M.
  • Universal plastics bag co.
  • Viking Masek
  • VOLPAK

These companies are focusing on implementing strategies such as product innovations, mergers, acquisitions, joint ventures, alliances, and partnerships to improve their market position.

Regional Insights

The global inverted pouch market is characterized by diverse regional contributions, each with its own unique impact and growth dynamics. In North America, the United States and Canada are significant players, primarily due to their advanced industrial and retail sectors. These countries have well-established consumer markets and manufacturing industries, which contribute substantially to the demand and innovation in inverted pouch packaging. The European market, with key contributors like the United Kingdom and Germany, mirrors this trend. These nations are known for their robust manufacturing capabilities and consumer goods industries, which drive the demand for innovative and practical packaging solutions such as inverted pouches.

In the Asia Pacific region, China, Japan, and India are pivotal to the inverted pouch market. This region’s importance is underscored by its large population, rapidly growing retail sector, and expanding consumer base, all of which demand innovative packaging solutions. Latin America, with Brazil and Mexico leading the way, also shows a growing interest in the inverted pouch market, fueled by its expanding retail and consumer industries. Lastly, the Middle East and Africa region, though less detailed in specific country contributions, is also a part of the global market landscape. This region’s market dynamics are influenced by its evolving consumer markets and industrial growth, contributing to the overall demand for inverted pouches

Interesting Facts about the Inverted Pouch Market

  1. F&B Industry Preference: Inverted pouches are increasingly popular in the F&B industry for gluten-free and GMO-free sauces.
  2. Eco-Friendly Development: Companies are focusing on creating eco-friendly inverted pouches.
  3. Growth in Personal Care Market: Inverted pouches are becoming a new norm in personal care packaging.
  4. Innovative Design Features: Customizable valves and dispensing spouts are enhancing user experience.
  5. Appeal to Millennials: Inverted pouches attract millennials with their ease of use and extended product shelf life.
  6. Functional and Aesthetic Advantage: These pouches offer functionality and aesthetics, being more compact and cost-effective than traditional packaging.
  7. Driven by Consumer Lifestyles: The demand is influenced by the increase in consumption of fast foods and packaged products.
Design Element 2

Access crucial information at unmatched prices!

Request your free sample report today & start making informed decisions powered by Credence Research!

Download Free Sample
CTA Design Element 3

Market Segmentations

By Pouch Type

  • Form Fill Seal (FFS)
  • Premade

By Material Type

  • Polyethylene
  • Polypropylene
  • Polyolefin
  • Metalized Aluminum
  • Ethylene Vinyl Alcohol (EVOH)
  • Others

By Capacity

  • Below 150 ML
  • 150-500 ML
  • 500ml -1 Liter
  • Above 1 Liter

By End User

  • Food
  • Personal Care
  • Others

By Region

Table of Content

Chapter No. 1 : Introduction 27

1.1. Report Description 27

1.1.1. Purpose of the Report 27

1.1.2. USP & Key Offerings 27

1.2. Key Benefits for Stakeholders 27

1.3. Target Audience 28

1.4. Report Scope 29


Chapter No. 2 : Executive Summary 31

2.1. Inverted Pouch Market Snapshot 31

2.2. Global Inverted Pouch Market, 2017 – 2022 (Kilo Tons) (USD Million) 32


Chapter No. 3 : Impact Analysis of COVID 19 & Russia-Ukraine War on Inverted Pouch Market 34

3.1. Impact Assessment of COVID-19 Pandemic, By Region 34

3.1.1. Supply chain disruptions 34

3.1.2. Demand fluctuations 34

3.1.3. Shift in product mix 34

3.1.4. Reduced industrial activity 34

3.1.5. Temporary disruptions and delays 34

3.1.6. Shift in focus towards essential services 34

3.2. Russia-Ukraine War Impacts 35

3.2.1. Uncertainty and economic instability 35

3.2.2. Supply chain disruptions 35

3.2.3. Regional market shifts 35

3.2.4. Shift in government priorities 35


Chapter No. 4 : Inverted Pouch Market – Industry Analysis 36

4.1. Introduction 36

4.2. Market Drivers 37

4.2.1. Driving Factor 1 Analysis 37

4.2.2. Driving Factor 2 Analysis 38

4.3. Market Restraints 39

4.3.1. Restraining Factor Analysis 39

4.4. Market Opportunities 40

4.4.1. Market Opportunity Analysis 40

4.5. Porter’s Five Forces Analysis 41

4.6. Value Chain Analysis 42

4.7. Buying Criteria 43


Chapter No. 5 : Import Export Analysis 44

5.1. Import Analysis by Region 44

5.1.1. Global Inverted Pouch Market Import Volume/Revenue, By Region, 2017 – 2022 44

5.2. Export Analysis by Region 45

5.2.1. Global Inverted Pouch Market Export Volume/Revenue, By Region, 2017 – 2022 45


Chapter No. 6 : Demand Supply Analysis 46

6.1. Demand Analysis by Region 46

6.1.1. Global Inverted Pouch Market Demand Volume/Revenue, By Region, 2017 – 2022 46

6.2. Supply Analysis by Region 47

6.2.1. Global Inverted Pouch Market Supply Volume/Revenue, By Region, 2017 – 2022 47


Chapter No. 7 : Production Analysis 48

7.1. Production Analysis by Region 48

7.1.1. Global Inverted Pouch Market Production, By Region, 2017 – 2022 48

7.1.2. Global Inverted Pouch Market Production Volume, By Region, 2017 – 2022 (Kilo Tons) 48


Chapter No. 8 : Price Analysis 49

8.1. Price Analysis by Region 49

8.1.1. Global Inverted Pouch Market Price, By Region, 2017 – 2022 49

8.1.2. Global Material Market Price, By Region, 2017 – 2022 49

8.2. Price Analysis by Material 50

8.2.1. Global Inverted Pouch Market Price, By Material, 2017 – 2022 50

8.2.2. Global Material Market Price, By Material, 2017 – 2022 50


Chapter No. 9 : Raw Materials Analysis 51

9.1. Key Raw Materials and Suppliers 51

9.2. Key Raw Materials Price Trend 51


Chapter No. 10 : Manufacturing Cost Analysis 52

10.1. Manufacturing Cost Analysis 52

10.1.1. Manufacturing Cost Analysis 52

10.2. Manufacturing Process 52

10.2.1. Manufacturing Process 52


Chapter No. 11 : Analysis Competitive Landscape 53

11.1. Company Market Share Analysis – 2022 53

11.1.1. Global Inverted Pouch Market: Company Market Share, by Volume, 2022 53

11.1.2. Global Inverted Pouch Market: Company Market Share, by Revenue2022 53

11.1.3. Global Inverted Pouch Market: Top 6 Company Market Share, by Revenue2022 54

11.1.4. Global Inverted Pouch Market: Top 3 Company Market Share, by Revenue2022 54

11.1. Global Inverted Pouch Market Company Volume Market Share, 2022 55

11.2. Global Inverted Pouch Market Company Revenue Market Share, 2022 56

11.3. Company Assessment Metrics, 2022 57

11.3.1. Stars 57

11.3.2. Emerging Leaders 57

11.3.3. Pervasive Players 57

11.3.4. Participants 57

11.4. Start-ups /SMEs Assessment Metrics, 2022 57

11.4.1. Progressive Companies 57

11.4.2. Responsive Companies 57

11.4.3. Dynamic Companies 57

11.4.4. Starting Blocks 57

11.5. Strategic Developments 58

11.5.1. Acquisitions & Mergers 58

11.5.2. New Product Launch 58

11.5.3. Regional Expansion 58

11.6. Key Players Product Matrix 59


Chapter No. 12 : PESTEL & Adjacent Market Analysis 60

12.1. PESTEL 60

12.1.1. Political Factors 60

12.1.2. Economic Factors 60

12.1.3. Social Factors 60

12.1.4. Technological Factors 60

12.1.5. Environmental Factors 60

12.1.6. Legal Factors 60

12.2. Adjacent Market Analysis 60


Chapter No. 13 : Inverted Pouch Market – By Material Segment Analysis 61

13.1. Inverted Pouch Market Overview, by Material Segment 61

13.1.1. Inverted Pouch Market Volume Share, By Material, 2022 & 2030 62

13.1.2. Inverted Pouch Market Revenue Share, By Material, 2022 & 2030 62

13.1.3. Inverted Pouch Market Attractiveness Analysis, By Material 63

13.1.4. Incremental Revenue Growth Opportunity, by Material, 2023 – 2030 63

13.1.5. Inverted Pouch Market Revenue, By Material, 2017, 2022, 2026 & 2030 64

13.2. Polyolefin 65

13.2.1. Global Polyolefin Inverted Pouch Market Volume & Revenue, By Region, 2017 – 2022 (Kilo Tons) (USD Million) 66

13.2.2. Global Polyolefin Inverted Pouch Market Volume & Revenue, By Region, 2017 – 2022 (Kilo Tons) (USD Million) 66

13.3. Metalized Aluminum 67

13.3.1. Global Metalized Aluminum Inverted Pouch Market Volume & Revenue, By Region, 2017 – 2022 (Kilo Tons) (USD Million) 68

13.3.2. Global Metalized Aluminum Inverted Pouch Market Volume & Revenue, By Region, 2017 – 2022 (Kilo Tons) (USD Million) 68

13.4. Ethylene Vinyl Alcohol 69

13.4.1. Global Ethylene Vinyl Alcohol Inverted Pouch Market Volume & Revenue, By Region, 2017 – 2022 (Kilo Tons) (USD Million) 70

13.4.2. Global Ethylene Vinyl Alcohol Inverted Pouch Market Volume & Revenue, By Region, 2017 – 2022 (Kilo Tons) (USD Million) 70


Chapter No. 14 : Inverted Pouch Market – By Capacity Segment Analysis 71

14.1. Inverted Pouch Market Overview, by Capacity Segment 71

14.1.1. Inverted Pouch Market Volume Share, By Capacity, 2022 & 2030 72

14.1.2. Inverted Pouch Market Revenue Share, By Capacity, 2022 & 2030 72

14.1.3. Inverted Pouch Market Attractiveness Analysis, By Capacity 73

14.1.4. Incremental Revenue Growth Opportunity, by Capacity, 2023 – 2030 73

14.1.5. Inverted Pouch Market Revenue, By Capacity, 2017, 2022, 2026 & 2030 74

14.2. Below 150 ml 75

14.2.1. Global Below 150 ml Inverted Pouch Market Volume & Revenue, By Region, 2017 – 2022 (Kilo Tons) (USD Million) 76

14.2.2. Global Below 150 ml Inverted Pouch Market Volume & Revenue, By Region, 2017 – 2022 (Kilo Tons) (USD Million) 76

14.3. 150-500 ml 77

14.3.1. Global 150-500 ml Inverted Pouch Market Volume & Revenue, By Region, 2017 – 2022 (Kilo Tons) (USD Million) 78

14.3.2. Global 150-500 ml Inverted Pouch Market Volume & Revenue, By Region, 2017 – 2022 (Kilo Tons) (USD Million) 78

14.4. 500 ml -1 Liter 79

14.4.1. Global 500 ml -1 Liter Inverted Pouch Market Volume & Revenue, By Region, 2017 – 2022 (Kilo Tons) (USD Million) 80

14.4.2. Global 500 ml -1 Liter Inverted Pouch Market Volume & Revenue, By Region, 2017 – 2022 (Kilo Tons) (USD Million) 80

14.5. Above 1 Liter 81

14.5.1. Global Above 1 Liter Inverted Pouch Market Volume & Revenue, By Region, 2017 – 2022 (Kilo Tons) (USD Million) 82

14.5.2. Global Above 1 Liter Inverted Pouch Market Volume & Revenue, By Region, 2017 – 2022 (Kilo Tons) (USD Million) 82

14.6. Others 83

14.6.1. Global Others Inverted Pouch Market Volume & Revenue, By Region, 2017 – 2022 (Kilo Tons) (USD Million) 84

14.6.2. Global Others Inverted Pouch Market Volume & Revenue, By Region, 2017 – 2022 (Kilo Tons) (USD Million) 84


Chapter No. 15 : Inverted Pouch Market – By End-user Segment Analysis 85

15.1. Inverted Pouch Market Overview, by End-user Segment 85

15.1.1. Inverted Pouch Market Volume Share, By End-user, 2022 & 2030 86

15.1.2. Inverted Pouch Market Revenue Share, By End-user, 2022 & 2030 86

15.1.3. Inverted Pouch Market Attractiveness Analysis, By End-user 87

15.1.4. Incremental Revenue Growth Opportunity, by End-user, 2023 – 2030 87

15.1.5. Inverted Pouch Market Revenue, By End-user, 2017, 2022, 2026 & 2030 88

15.2. Food 89

15.2.1. Global Food Inverted Pouch Market Volume & Revenue, By Region, 2017 – 2022 (Kilo Tons) (USD Million) 90

15.2.2. Global Food Inverted Pouch Market Volume & Revenue, By Region, 2023 – 2030 (Kilo Tons) (USD Million) 90

15.3. Personal Care 91

15.3.1. Global Personal Care Inverted Pouch Market Volume & Revenue, By Region, 2017 – 2022 (Kilo Tons) (USD Million) 92

15.3.2. Global Personal Care Inverted Pouch Market Volume & Revenue, By Region, 2023 – 2030 (Kilo Tons) (USD Million) 92

15.4. Others 93

15.4.1. Global End-user 3 Inverted Pouch Market Volume & Revenue, By Region, 2017 – 2022 (Kilo Tons) (USD Million) 94

15.4.2. Global End-user 3 Inverted Pouch Market Volume & Revenue, By Region, 2023 – 2030 (Kilo Tons) (USD Million) 94


Chapter No. 16 : Inverted Pouch Market – Regional Analysis 95

16.1. Inverted Pouch Market Overview, by Regional Segments 95

16.2. Region 96

16.2.1. Global Inverted Pouch Market Volume Share, By Region, 2022 & 2030 96

16.2.2. Global Inverted Pouch Market Revenue Share, By Region, 2022 & 2030 96

16.2.3. Inverted Pouch Market Attractiveness Analysis, By Region 97

16.2.4. Incremental Revenue Growth Opportunity, by Region, 2023 – 2030 97

16.2.5. Inverted Pouch Market Revenue, By Region, 2017, 2022, 2026 & 2030 98

16.2.6. Global Inverted Pouch Market Volume & Revenue, By Region, 2017 – 2022 (Kilo Tons) (USD Million) 99

16.2.7. Global Inverted Pouch Market Volume & Revenue, By Region, 2023 – 2030 (Kilo Tons) (USD Million) 99

16.3. Material 100

16.3.1. Global Inverted Pouch Market Volume & Revenue, By Material, 2017 – 2022 (Kilo Tons) (USD Million) 100

16.3.2. Global Inverted Pouch Market Volume & Revenue, By Material, 2023 – 2030 (Kilo Tons) (USD Million) 100

16.4. Capacity 101

16.4.1. Global Inverted Pouch Market Volume & Revenue, By Capacity, 2017 – 2022 (Kilo Tons) (USD Million) 101

16.4.2. Global Inverted Pouch Market Volume & Revenue, By Capacity, 2023 – 2030 (Kilo Tons) (USD Million) 101

16.5. End-user 102

16.5.1. Global Inverted Pouch Market Volume & Revenue, By End-user, 2017 – 2022 (Kilo Tons) (USD Million) 102

16.5.2. Global Inverted Pouch Market Volume & Revenue, By End-user, 2023 – 2030 (Kilo Tons) (USD Million) 102


Chapter No. 17 : Inverted Pouch Market – North America 103

17.1. North America 103

17.1. Key Highlights 103

17.1.1. North America Inverted Pouch Market Volume, By Country, 2017 – 2022 (Kilo Tons) 104

17.1.2. North America Inverted Pouch Market Revenue, By Country, 2017 – 2022 (USD Million) 105

17.1.2.1. North America Inverted Pouch Market Volume, By Material, 2017 – 2022 (Kilo Tons) 106

17.1.3. North America Inverted Pouch Market Revenue, By Material, 2017 – 2022 (USD Million) 107

17.1.4. North America Inverted Pouch Market Volume, By Capacity, 2017 – 2022 (Kilo Tons) 108

17.1.5. North America Inverted Pouch Market Revenue, By Capacity, 2017 – 2022 (USD Million) 109

17.1.6. North America Inverted Pouch Market Volume, By End-user, 2017 – 2022 (Kilo Tons) 110

17.1.7. North America Inverted Pouch Market Revenue, By End-user, 2017 – 2022 (USD Million) 111

17.1.8. U.S. 112

17.1.9. Canada 112

17.1.10. Mexico 112

Chapter No. 18 : Inverted Pouch Market – Europe 113

18.1. Europe 113

18.2. Key Highlights 113

18.2.1. Europe Inverted Pouch Market Volume, By Country, 2017 – 2022 (Kilo Tons) 114

18.2.2. Europe Inverted Pouch Market Revenue, By Country, 2017 – 2022 (USD Million) 115

18.2.3. Europe Inverted Pouch Market Volume, By Material, 2017 – 2022 (Kilo Tons) 116

18.2.4. Europe Inverted Pouch Market Revenue, By Material, 2017 – 2022 (USD Million) 117

18.2.5. Europe Inverted Pouch Market Volume, By Capacity, 2017 – 2022 (Kilo Tons) 118

18.2.6. Europe Inverted Pouch Market Revenue, By Capacity, 2017 – 2022 (USD Million) 119

18.2.7. Europe Inverted Pouch Market Volume, By End-user, 2017 – 2022 (Kilo Tons) 120

18.2.8. Europe Inverted Pouch Market Revenue, By End-user, 2017 – 2022 (USD Million) 121

18.2.9. UK 122

18.2.10. France 122

18.2.11. Germany 122

18.2.12. Italy 122

18.2.13. Spain 122

18.2.14. Russia 122

18.2.15. BENELUX 122

18.2.16. Sweden 122

18.2.17. Denmark 122

18.2.18. Poland 122

18.2.19. Austria 122

18.2.20. Rest of Europe 122


Chapter No. 19 : Inverted Pouch Market – Asia Pacific 123

19.1. Asia Pacific 123

19.2. Key Highlights 123

19.2.1. Asia Pacific Inverted Pouch Market Volume, By Country, 2017 – 2022 (Kilo Tons) 124

19.2.2. Asia Pacific Inverted Pouch Market Revenue, By Country, 2017 – 2022 (USD Million) 125

19.2.3. Asia Pacific Inverted Pouch Market Volume, By Material, 2017 – 2022 (Kilo Tons) 126

19.2.4. Asia Pacific Inverted Pouch Market Revenue, By Material, 2017 – 2022 (USD Million) 127

19.2.5. Asia Pacific Inverted Pouch Market Volume, By Capacity, 2017 – 2022 (Kilo Tons) 128

19.2.6. Asia Pacific Inverted Pouch Market Revenue, By Capacity, 2017 – 2022 (USD Million) 129

19.2.7. Asia Pacific Inverted Pouch Market Volume, By End-user, 2017 – 2022 (Kilo Tons) 130

19.2.8. Asia Pacific Inverted Pouch Market Revenue, By End-user, 2017 – 2022 (USD Million) 131

19.2.9. China 132

19.2.10. Japan 132

19.2.11. South Korea 132

19.2.12. India 132

19.2.13. Thailand 132

19.2.14. Indonesia 132

19.2.15. Vietnam 132

19.2.16. Malaysia 132

19.2.17. Philippines 132

19.2.18. Taiwan 132

19.2.19. Rest of Asia Pacific 132


Chapter No. 20 : Inverted Pouch Market – Latin America 133

20.1. Latin America 133

20.2. Key Highlights 133

20.2.1. Latin America Inverted Pouch Market Volume, By Country, 2017 – 2022 (Kilo Tons) 134

20.2.2. Latin America Inverted Pouch Market Revenue, By Country, 2017 – 2022 (USD Million) 135

20.2.3. Latin America Inverted Pouch Market Volume, By Material, 2017 – 2022 (Kilo Tons) 136

20.2.4. Latin America Inverted Pouch Market Revenue, By Material, 2017 – 2022 (USD Million) 137

20.2.5. Latin America Inverted Pouch Market Volume, By Capacity, 2017 – 2022 (Kilo Tons) 138

20.2.6. Latin America Inverted Pouch Market Revenue, By Capacity, 2017 – 2022 (USD Million) 139

20.2.7. Latin America Inverted Pouch Market Volume, By End-user, 2017 – 2022 (Kilo Tons) 140

20.2.8. Latin America Inverted Pouch Market Revenue, By End-user, 2017 – 2022 (USD Million) 141

20.2.9. Brazil 142

20.2.10. Argentina 142

20.2.11. Colombia 142

20.2.12. Chile 142

20.2.13. Peru 142

20.2.14. Rest of Latin America 142

Chapter No. 21 : Inverted Pouch Market – Middle East 143

21.1. The Middle-East 143

21.2. Key Highlights 143

21.2.1. Middle East Inverted Pouch Market Volume, By Country, 2017 – 2022 (Kilo Tons) 144

21.2.2. Middle East Inverted Pouch Market Revenue, By Country, 2017 – 2022 (USD Million) 145

21.2.3. Middle East Inverted Pouch Market Volume, By Material, 2017 – 2022 (Kilo Tons) 146

21.2.4. Middle East Inverted Pouch Market Revenue, By Material, 2017 – 2022 (USD Million) 147

21.2.5. Middle East Inverted Pouch Market Volume, By Capacity, 2017 – 2022 (Kilo Tons) 148

21.2.6. Middle East Inverted Pouch Market Revenue, By Capacity, 2017 – 2022 (USD Million) 149

21.2.7. Middle East Inverted Pouch Market Volume, By End-user, 2017 – 2022 (Kilo Tons) 150

21.2.8. Middle East Inverted Pouch Market Revenue, By End-user, 2017 – 2022 (USD Million) 151

21.2.9. GCC Countries 152

21.2.10. Israel 152

21.2.11. Turkey 152

21.2.12. Iran 152

21.2.13. Rest of Middle East & Africa 152


Chapter No. 22 : Inverted Pouch Market – Africa 153

22.1. Africa 153

22.2. Key Highlights 153

22.2.1. Africa Inverted Pouch Market Volume, By Country, 2017 – 2022 (Kilo Tons) 154

22.2.2. Africa Inverted Pouch Market Revenue, By Country, 2017 – 2022 (USD Million) 155

22.2.3. Africa Inverted Pouch Market Volume, By Material, 2017 – 2022 (Kilo Tons) 156

22.2.4. Africa Inverted Pouch Market Revenue, By Material, 2017 – 2022 (USD Million) 157

22.2.5. Africa Inverted Pouch Market Volume, By Capacity, 2017 – 2022 (Kilo Tons) 158

22.2.6. Africa Inverted Pouch Market Revenue, By Capacity, 2017 – 2022 (USD Million) 159

22.2.7. Africa Inverted Pouch Market Volume, By End-user, 2017 – 2022 (Kilo Tons) 160

22.2.8. Africa Inverted Pouch Market Revenue, By End-user, 2017 – 2022 (USD Million) 161

22.2.9. South Africa 162

22.2.10. Egypt 162

22.2.11. Nigeria 162

22.2.12. Algeria 162

22.2.13. Morocco 162

22.2.14. Rest of Africa 162


Chapter No. 23 : Company Profiles 163

23.1. Amcor Plc 163

23.1.1. Company Overview 163

23.1.2. Product Portfolio 163

23.1.3. Swot Analysis 163

23.1.4. Business Strategy 164

23.1.5. Financial Overview 164

23.2. APTAR 165

23.3. Cheer Pack 165

23.4. Constantia 165

23.5. Coveris 165

23.6. Glenroy Inc. 165

23.7. Goglio SpA 165

23.8. Mattpack Inc. 165

23.9. Mondi plc 165

23.10. Polymer Packaging Inc. 165

23.11. Pouches Inc 165

23.12. ProAmpac 165

23.13. Sealed Air Corporation 165

23.14. Semco S.A.M. 165

23.15. Universal plastics bag co. 165

23.16. Viking Masek 165

23.17. VOLPAK industries 165


Chapter No. 24 : Research Methodology 166

24.1. Research Methodology 166

24.2. Phase I – Secondary Research 167

24.3. Phase II – Data Modeling 167

24.3.1. Company Share Analysis Model 168

24.3.2. Revenue Based Modeling 168

24.4. Phase III – Primary Research 169

24.5. Research Limitations 170

24.5.1. Assumptions 170


List of Figures

FIG NO. 1. Global Inverted Pouch Market Volume & Revenue, 2017 – 2022 (Kilo Tons) (USD Million) 32

FIG NO. 2. Porter’s Five Forces Analysis for Global Inverted Pouch Market 41

FIG NO. 3. Value Chain Analysis for Global Inverted Pouch Market 42

FIG NO. 4. Global Inverted Pouch Market Import Volume/Revenue, By Region, 2017 – 2022 44

FIG NO. 5. Global Inverted Pouch Market Export Volume/Revenue, By Region, 2017 – 2022 45

FIG NO. 6. Global Inverted Pouch Market Demand Volume/Revenue, By Region, 2017 – 2022 46

FIG NO. 7. Global Inverted Pouch Market Supply Volume/Revenue, By Region, 2017 – 2022 47

FIG NO. 8. Global Inverted Pouch Market Production, By Region, 2017 – 2022 48

FIG NO. 9. Global Inverted Pouch Market Price, By Region, 2017 – 2022 49

FIG NO. 10. Global Inverted Pouch Market Price, By Material, 2017 – 2022 50

FIG NO. 11. Raw Materials Price Trend Analysis, 2017 – 2022 51

FIG NO. 12. Manufacturing Cost Analysis 52

FIG NO. 13. Manufacturing Process 52

FIG NO. 14. Company Share Analysis, 2022 53

FIG NO. 15. Company Share Analysis, 2022 53

FIG NO. 16. Company Share Analysis, 2022 54

FIG NO. 17. Company Share Analysis, 2022 54

FIG NO. 18. Inverted Pouch Market – Company Volume Market Share, 2022 55

FIG NO. 19. Inverted Pouch Market – Company Revenue Market Share, 2022 56

FIG NO. 20. Inverted Pouch Market Volume Share, By Material, 2022 & 2030 62

FIG NO. 21. Inverted Pouch Market Revenue Share, By Material, 2022 & 2030 62

FIG NO. 22. Market Attractiveness Analysis, By Material 63

FIG NO. 23. Incremental Revenue Growth Opportunity by Material 63

FIG NO. 24. Inverted Pouch Market Revenue, By Material, 2017, 2022, 2026 & 2030 64

FIG NO. 25. Global Inverted Pouch Market for Polyolefin, Volume & Revenue (Kilo Tons) (USD Million) 2017 – 2030 65

FIG NO. 26. Global Inverted Pouch Market for Metalized Aluminum, Volume & Revenue (Kilo Tons) (USD Million) 2017 – 2030 67

FIG NO. 27. Global Inverted Pouch Market for Ethylene Vinyl Alcohol, Volume & Revenue (Kilo Tons) (USD Million) 2017 – 2030 69

FIG NO. 28. Inverted Pouch Market Volume Share, By Capacity, 2022 & 2030 72

FIG NO. 29. Inverted Pouch Market Revenue Share, By Capacity, 2022 & 2030 72

FIG NO. 30. Market Attractiveness Analysis, By Capacity 73

FIG NO. 31. Incremental Revenue Growth Opportunity by Capacity 73

FIG NO. 32. Inverted Pouch Market Revenue, By Capacity, 2017, 2022, 2026 & 2030 74

FIG NO. 33. Global Inverted Pouch Market for Below 150 ml, Volume & Revenue (Kilo Tons) (USD Million) 2017 – 2030 75

FIG NO. 34. Global Inverted Pouch Market for 150-500 ml, Volume & Revenue (Kilo Tons) (USD Million) 2017 – 2030 77

FIG NO. 35. Global Inverted Pouch Market for 500 ml -1 Liter, Volume & Revenue (Kilo Tons) (USD Million) 2017 – 2030 79

FIG NO. 36. Global Inverted Pouch Market for Above 1 Liter, Volume & Revenue (Kilo Tons) (USD Million) 2017 – 2030 81

FIG NO. 37. Global Inverted Pouch Market for Others, Volume & Revenue (Kilo Tons) (USD Million) 2017 – 2030 83

FIG NO. 38. Inverted Pouch Market Volume Share, By End-user, 2022 & 2030 86

FIG NO. 39. Inverted Pouch Market Revenue Share, By End-user, 2022 & 2030 86

FIG NO. 40. Market Attractiveness Analysis, By End-user 87

FIG NO. 41. Incremental Revenue Growth Opportunity by End-user 87

FIG NO. 42. Inverted Pouch Market Revenue, By End-user, 2017, 2022, 2026 & 2030 88

FIG NO. 43. Global Inverted Pouch Market for Food, Volume & Revenue (Kilo Tons) (USD Million) 2017 – 2030 89

FIG NO. 44. Global Inverted Pouch Market for Personal Care, Volume & Revenue (Kilo Tons) (USD Million) 2017 – 2030 91

FIG NO. 45. Global Inverted Pouch Market for End-user 3, Volume & Revenue (Kilo Tons) (USD Million) 2017 – 2030 93

FIG NO. 46. Global Inverted Pouch Market Volume Share, By Region, 2022 & 2030 96

FIG NO. 47. Global Inverted Pouch Market Revenue Share, By Region, 2022 & 2030 96

FIG NO. 48. Market Attractiveness Analysis, By Region 97

FIG NO. 49. Incremental Revenue Growth Opportunity by Region 97

FIG NO. 50. Inverted Pouch Market Revenue, By Region, 2017, 2022, 2026 & 2030 98

FIG NO. 51. North America Inverted Pouch Market Volume & Revenue, 2017 – 2022 (Kilo Tons) (USD Million) 103

FIG NO. 52. Europe Inverted Pouch Market Volume & Revenue, 2017 – 2022 (Kilo Tons) (USD Million) 113

FIG NO. 53. Asia Pacific Inverted Pouch Market Volume & Revenue, 2017 – 2022 (Kilo Tons) (USD Million) 123

FIG NO. 54. Latin America Inverted Pouch Market Volume & Revenue, 2017 – 2022 (Kilo Tons) (USD Million) 133

FIG NO. 55. The Middle-East Inverted Pouch Market Volume & Revenue, 2017 – 2022 (Kilo Tons) (USD Million) 143

FIG NO. 56. Africa Inverted Pouch Market Volume & Revenue, 2017 – 2022 (Kilo Tons) (USD Million) 153

FIG NO. 57. Research Methodology – Detailed View 166

FIG NO. 58. Research Methodology 167

List of Tables

l

TABLE NO. 1. : Global Inverted Pouch Market: Snapshot 30

TABLE NO. 2. : Drivers for the Inverted Pouch Market: Impact Analysis 36

TABLE NO. 3. : Restraints for the Inverted Pouch Market: Impact Analysis 38

TABLE NO. 4. : Global Inverted Pouch Market Volume & Revenue, By Region, 2017 – 2022 (Kilo Tons) 47

TABLE NO. 5. : Global Inverted Pouch Market Volume & Revenue, By Region, 2017 – 2022 48

TABLE NO. 6. : Global Inverted Pouch Market Volume & Revenue, By Material, 2017 – 2022 49

TABLE NO. 7. : Key Raw Materials & Suppliers 50

TABLE NO. 8. : Global Polyolefin Inverted Pouch Market Volume & Revenue, By Region, 2017 – 2022 (Kilo Tons) (USD Million) 65

TABLE NO. 9. : Global Polyolefin Inverted Pouch Market Volume & Revenue, By Region, 2023– 2030 (Kilo Tons) (USD Million) 65

TABLE NO. 10. : Global Metalized Aluminum Inverted Pouch Market Volume & Revenue, By Region, 2017 – 2022 (Kilo Tons) (USD Million) 67

TABLE NO. 11. : Global Metalized Aluminum Inverted Pouch Market Volume & Revenue, By Region, 2023– 2030 (Kilo Tons) (USD Million) 67

TABLE NO. 12. : Global Ethylene Vinyl Alcohol Inverted Pouch Market Volume & Revenue, By Region, 2017 – 2022 (Kilo Tons) (USD Million) 69

TABLE NO. 13. : Global Ethylene Vinyl Alcohol Inverted Pouch Market Volume & Revenue, By Region, 2023– 2030 (Kilo Tons) (USD Million) 69

TABLE NO. 14. : Global Below 150 ml Inverted Pouch Market Volume & Revenue, By Region, 2017 – 2022 (Kilo Tons) (USD Million) 75

TABLE NO. 15. : Global Below 150 ml Inverted Pouch Market Volume & Revenue, By Region, 2023– 2030 (Kilo Tons) (USD Million) 75

TABLE NO. 16. : Global 150-500 ml Inverted Pouch Market Volume & Revenue, By Region, 2017 – 2022 (Kilo Tons) (USD Million) 77

TABLE NO. 17. : Global 150-500 ml Inverted Pouch Market Volume & Revenue, By Region, 2023– 2030 (Kilo Tons) (USD Million) 77

TABLE NO. 18. : Global 500 ml -1 Liter Inverted Pouch Market Volume & Revenue, By Region, 2017 – 2022 (Kilo Tons) (USD Million) 79

TABLE NO. 19. : Global 500 ml -1 Liter Inverted Pouch Market Volume & Revenue, By Region, 2023– 2030 (Kilo Tons) (USD Million) 79

TABLE NO. 20. : Global Above 1 Liter Inverted Pouch Market Volume & Revenue, By Region, 2017 – 2022 (Kilo Tons) (USD Million) 81

TABLE NO. 21. : Global Above 1 Liter Inverted Pouch Market Volume & Revenue, By Region, 2023– 2030 (Kilo Tons) (USD Million) 81

TABLE NO. 22. : Global Others Inverted Pouch Market Volume & Revenue, By Region, 2017 – 2022 (Kilo Tons) (USD Million) 83

TABLE NO. 23. : Global Others Inverted Pouch Market Volume & Revenue, By Region, 2023– 2030 (Kilo Tons) (USD Million) 83

TABLE NO. 24. : Global Food Inverted Pouch Market Volume & Revenue, By Region, 2017 – 2022 (Kilo Tons) (USD Million) 89

TABLE NO. 25. : Global Food Inverted Pouch Market Volume & Revenue, By Region, 2023– 2030 (Kilo Tons) (USD Million) 89

TABLE NO. 26. : Global Personal Care Inverted Pouch Market Volume & Revenue, By Region, 2017 – 2022 (Kilo Tons) (USD Million) 91

TABLE NO. 27. : Global Personal Care Inverted Pouch Market Volume & Revenue, By Region, 2023– 2030 (Kilo Tons) (USD Million) 91

TABLE NO. 28. : Global End-user 3 Inverted Pouch Market Volume & Revenue, By Region, 2017 – 2022 (Kilo Tons) (USD Million) 93

TABLE NO. 29. : Global End-user 3 Inverted Pouch Market Volume & Revenue, By Region, 2023– 2030 (Kilo Tons) (USD Million) 93

TABLE NO. 30. : Global Inverted Pouch Market Volume & Revenue, By Region, 2017 – 2022 (Kilo Tons) (USD Million) 98

TABLE NO. 31. : Global Inverted Pouch Market Volume & Revenue, By Region, 2023– 2030 (Kilo Tons) (USD Million) 98

TABLE NO. 32. : Global Inverted Pouch Market Volume & Revenue, By Material, 2017 – 2022 (Kilo Tons) (USD Million) 99

TABLE NO. 33. : Global Inverted Pouch Market Volume & Revenue, By Material, 2023– 2030 (Kilo Tons) (USD Million) 99

TABLE NO. 34. : Global Inverted Pouch Market Volume & Revenue, By Capacity, 2017 – 2022 (Kilo Tons) (USD Million) 100

TABLE NO. 35. : Global Inverted Pouch Market Volume & Revenue, By Capacity, 2023– 2030 (Kilo Tons) (USD Million) 100

TABLE NO. 36. : Global Inverted Pouch Market Volume & Revenue, By End-user, 2017 – 2022 (Kilo Tons) (USD Million) 101

TABLE NO. 37. : Global Inverted Pouch Market Volume & Revenue, By End-user, 2023– 2030 (Kilo Tons) (USD Million) 101

TABLE NO. 38. : North America Inverted Pouch Market Volume, By Country, 2017 – 2022 (Kilo Tons) 103

TABLE NO. 39. : North America Inverted Pouch Market Volume, By Country, 2023– 2030 (Kilo Tons) 103

TABLE NO. 40. : North America Inverted Pouch Market Revenue, By Country, 2017 – 2022 (USD Million) 104

TABLE NO. 41. : North America Inverted Pouch Market Revenue, By Country, 2023– 2030 (USD Million) 104

TABLE NO. 42. : North America Inverted Pouch Market Volume, By Material, 2017 – 2022 (Kilo Tons) 105

TABLE NO. 43. : North America Inverted Pouch Market Volume, By Material, 2023– 2030 (Kilo Tons) 105

TABLE NO. 44. : North America Inverted Pouch Market Revenue, By Material, 2017 – 2022 (USD Million) 106

TABLE NO. 45. : North America Inverted Pouch Market Revenue, By Material, 2023– 2030 (USD Million) 106

TABLE NO. 46. : North America Inverted Pouch Market Volume, By Capacity, 2017 – 2022 (Kilo Tons) 107

TABLE NO. 47. : North America Inverted Pouch Market Volume, By Capacity, 2023– 2030 (Kilo Tons) 107

TABLE NO. 48. : North America Inverted Pouch Market Revenue, By Capacity, 2017 – 2022 (USD Million) 108

TABLE NO. 49. : North America Inverted Pouch Market Revenue, By Capacity, 2023– 2030 (USD Million) 108

TABLE NO. 50. : North America Inverted Pouch Market Volume, By End-user, 2017 – 2022 (Kilo Tons) 109

TABLE NO. 51. : North America Inverted Pouch Market Volume, By End-user, 2023– 2030 (Kilo Tons) 109

TABLE NO. 52. : North America Inverted Pouch Market Revenue, By End-user, 2017 – 2022 (USD Million) 110

TABLE NO. 53. : North America Inverted Pouch Market Revenue, By End-user, 2023– 2030 (USD Million) 110

TABLE NO. 54. : Europe Inverted Pouch Market Volume, By Country, 2017 – 2022 (Kilo Tons) 113

TABLE NO. 55. : Europe Inverted Pouch Market Volume, By Country, 2023– 2030 (Kilo Tons) 113

TABLE NO. 56. : Europe Inverted Pouch Market Revenue, By Country, 2017 – 2022 (USD Million) 114

TABLE NO. 57. : Europe Inverted Pouch Market Revenue, By Country, 2023– 2030 (USD Million) 114

TABLE NO. 58. : Europe Inverted Pouch Market Volume, By Material, 2017 – 2022 (Kilo Tons) 115

TABLE NO. 59. : Europe Inverted Pouch Market Volume, By Material, 2023– 2030 (Kilo Tons) 115

TABLE NO. 60. : Europe Inverted Pouch Market Revenue, By Material, 2017 – 2022 (USD Million) 116

TABLE NO. 61. : Europe Inverted Pouch Market Revenue, By Material, 2023– 2030 (USD Million) 116

TABLE NO. 62. : Europe Inverted Pouch Market Volume, By Capacity, 2017 – 2022 (Kilo Tons) 117

TABLE NO. 63. : Europe Inverted Pouch Market Volume, By Capacity, 2023– 2030 (Kilo Tons) 117

TABLE NO. 64. : Europe Inverted Pouch Market Revenue, By Capacity, 2017 – 2022 (USD Million) 118

TABLE NO. 65. : Europe Inverted Pouch Market Revenue, By Capacity, 2023– 2030 (USD Million) 118

TABLE NO. 66. : Europe Inverted Pouch Market Volume, By End-user, 2017 – 2022 (Kilo Tons) 119

TABLE NO. 67. : Europe Inverted Pouch Market Volume, By End-user, 2023– 2030 (Kilo Tons) 119

TABLE NO. 68. : Europe Inverted Pouch Market Revenue, By End-user, 2017 – 2022 (USD Million) 120

TABLE NO. 69. : Europe Inverted Pouch Market Revenue, By End-user, 2023– 2030 (USD Million) 120

TABLE NO. 70. : Asia Pacific Inverted Pouch Market Volume, By Country, 2017 – 2022 (Kilo Tons) 123

TABLE NO. 71. : Asia Pacific Inverted Pouch Market Volume, By Country, 2023– 2030 (Kilo Tons) 123

TABLE NO. 72. : Asia Pacific Inverted Pouch Market Revenue, By Country, 2017 – 2022 (USD Million) 124

TABLE NO. 73. : Asia Pacific Inverted Pouch Market Revenue, By Country, 2023– 2030 (USD Million) 124

TABLE NO. 74. : Asia Pacific Inverted Pouch Market Volume, By Material, 2017 – 2022 (Kilo Tons) 125

TABLE NO. 75. : Asia Pacific Inverted Pouch Market Volume, By Material, 2023– 2030 (Kilo Tons) 125

TABLE NO. 76. : Asia Pacific Inverted Pouch Market Revenue, By Material, 2017 – 2022 (USD Million) 126

TABLE NO. 77. : Asia Pacific Inverted Pouch Market Revenue, By Material, 2023– 2030 (USD Million) 126

TABLE NO. 78. : Asia Pacific Inverted Pouch Market Volume, By Capacity, 2017 – 2022 (Kilo Tons) 127

TABLE NO. 79. : Asia Pacific Inverted Pouch Market Volume, By Capacity, 2023– 2030 (Kilo Tons) 127

TABLE NO. 80. : Asia Pacific Inverted Pouch Market Revenue, By Capacity, 2017 – 2022 (USD Million) 128

TABLE NO. 81. : Asia Pacific Inverted Pouch Market Revenue, By Capacity, 2023– 2030 (USD Million) 128

TABLE NO. 82. : Asia Pacific Inverted Pouch Market Volume, By End-user, 2017 – 2022 (Kilo Tons) 129

TABLE NO. 83. : Asia Pacific Inverted Pouch Market Volume, By End-user, 2023– 2030 (Kilo Tons) 129

TABLE NO. 84. : Asia Pacific Inverted Pouch Market Revenue, By End-user, 2017 – 2022 (USD Million) 130

TABLE NO. 85. : Asia Pacific Inverted Pouch Market Revenue, By End-user, 2023– 2030 (USD Million) 130

TABLE NO. 86. : Latin America Inverted Pouch Market Volume, By Country, 2017 – 2022 (Kilo Tons) 133

TABLE NO. 87. : Latin America Inverted Pouch Market Volume, By Country, 2023– 2030 (Kilo Tons) 133

TABLE NO. 88. : Latin America Inverted Pouch Market Revenue, By Country, 2017 – 2022 (USD Million) 134

TABLE NO. 89. : Latin America Inverted Pouch Market Revenue, By Country, 2023– 2030 (USD Million) 134

TABLE NO. 90. : Latin America Inverted Pouch Market Volume, By Material, 2017 – 2022 (Kilo Tons) 135

TABLE NO. 91. : Latin America Inverted Pouch Market Volume, By Material, 2023– 2030 (Kilo Tons) 135

TABLE NO. 92. : Latin America Inverted Pouch Market Revenue, By Material, 2017 – 2022 (USD Million) 136

TABLE NO. 93. : Latin America Inverted Pouch Market Revenue, By Material, 2023– 2030 (USD Million) 136

TABLE NO. 94. : Latin America Inverted Pouch Market Volume, By Capacity, 2017 – 2022 (Kilo Tons) 137

TABLE NO. 95. : Latin America Inverted Pouch Market Volume, By Capacity, 2023– 2030 (Kilo Tons) 137

TABLE NO. 96. : Latin America Inverted Pouch Market Revenue, By Capacity, 2017 – 2022 (USD Million) 138

TABLE NO. 97. : Latin America Inverted Pouch Market Revenue, By Capacity, 2023– 2030 (USD Million) 138

TABLE NO. 98. : Latin America Inverted Pouch Market Volume, By End-user, 2017 – 2022 (Kilo Tons) 139

TABLE NO. 99. : Latin America Inverted Pouch Market Volume, By End-user, 2023– 2030 (Kilo Tons) 139

TABLE NO. 100. : Latin America Inverted Pouch Market Revenue, By End-user, 2017 – 2022 (USD Million) 140

TABLE NO. 101. : Latin America Inverted Pouch Market Revenue, By End-user, 2023– 2030 (USD Million) 140

TABLE NO. 102. : Middle East Inverted Pouch Market Volume, By Country, 2017 – 2022 (Kilo Tons) 143

TABLE NO. 103. : Middle East Inverted Pouch Market Volume, By Country, 2023– 2030 (Kilo Tons) 143

TABLE NO. 104. : Middle East Inverted Pouch Market Revenue, By Country, 2017 – 2022 (USD Million) 144

TABLE NO. 105. : Middle East Inverted Pouch Market Revenue, By Country, 2023– 2030 (USD Million) 144

TABLE NO. 106. : Middle East Inverted Pouch Market Volume, By Material, 2017 – 2022 (Kilo Tons) 145

TABLE NO. 107. : Middle East Inverted Pouch Market Volume, By Material, 2023– 2030 (Kilo Tons) 145

TABLE NO. 108. : Middle East Inverted Pouch Market Revenue, By Material, 2017 – 2022 (USD Million) 146

TABLE NO. 109. : Middle East Inverted Pouch Market Revenue, By Material, 2023– 2030 (USD Million) 146

TABLE NO. 110. : Middle East Inverted Pouch Market Volume, By Capacity, 2017 – 2022 (Kilo Tons) 147

TABLE NO. 111. : Middle East Inverted Pouch Market Volume, By Capacity, 2023– 2030 (Kilo Tons) 147

TABLE NO. 112. : Middle East Inverted Pouch Market Revenue, By Capacity, 2017 – 2022 (USD Million) 148

TABLE NO. 113. : Middle East Inverted Pouch Market Revenue, By Capacity, 2023– 2030 (USD Million) 148

TABLE NO. 114. : Middle East Inverted Pouch Market Volume, By End-user, 2017 – 2022 (Kilo Tons) 149

TABLE NO. 115. : Middle East Inverted Pouch Market Volume, By End-user, 2023– 2030 (Kilo Tons) 149

TABLE NO. 116. : Middle East Inverted Pouch Market Revenue, By End-user, 2017 – 2022 (USD Million) 150

TABLE NO. 117. : Middle East Inverted Pouch Market Revenue, By End-user, 2023– 2030 (USD Million) 150

TABLE NO. 118. : Africa Inverted Pouch Market Volume, By Country, 2017 – 2022 (Kilo Tons) 153

TABLE NO. 119. : Africa Inverted Pouch Market Volume, By Country, 2023– 2030 (Kilo Tons) 153

TABLE NO. 120. : Africa Inverted Pouch Market Revenue, By Country, 2017 – 2022 (USD Million) 154

TABLE NO. 121. : Africa Inverted Pouch Market Revenue, By Country, 2023– 2030 (USD Million) 154

TABLE NO. 122. : Africa Inverted Pouch Market Volume, By Material, 2017 – 2022 (Kilo Tons) 155

TABLE NO. 123. : Africa Inverted Pouch Market Volume, By Material, 2023– 2030 (Kilo Tons) 155

TABLE NO. 124. : Africa Inverted Pouch Market Revenue, By Material, 2017 – 2022 (USD Million) 156

TABLE NO. 125. : Africa Inverted Pouch Market Revenue, By Material, 2023– 2030 (USD Million) 156

TABLE NO. 126. : Africa Inverted Pouch Market Volume, By Capacity, 2017 – 2022 (Kilo Tons) 157

TABLE NO. 127. : Africa Inverted Pouch Market Volume, By Capacity, 2023– 2030 (Kilo Tons) 157

TABLE NO. 128. : Africa Inverted Pouch Market Revenue, By Capacity, 2017 – 2022 (USD Million) 158

TABLE NO. 129. : Africa Inverted Pouch Market Revenue, By Capacity, 2023– 2030 (USD Million) 158

TABLE NO. 130. : Africa Inverted Pouch Market Volume, By End-user, 2017 – 2022 (Kilo Tons) 159

TABLE NO. 131. : Africa Inverted Pouch Market Volume, By End-user, 2023– 2030 (Kilo Tons) 159

TABLE NO. 132. : Africa Inverted Pouch Market Revenue, By End-user, 2017 – 2022 (USD Million) 160

TABLE NO. 133. : Africa Inverted Pouch Market Revenue, By End-user, 2023– 2030 (USD Million) 160

What is the projected market value of inverted pouches by 2030?

The inverted pouch market is expected to grow from USD 11,448.91 million in 2022 to USD 18,352.98 million by 2030, with a CAGR of 6.97% from 2023 to 2030.

Why are inverted pouches becoming increasingly popular?

Inverted pouches are gaining popularity due to their ease of use, flexibility, and eco-friendly material options. Their distinctive design and convenience in dispensing products make them a preferred choice in the food and personal care industries.

How are environmental concerns influencing the inverted pouch market?

Increased public awareness of environmental impacts and the need to reduce packaging-related emissions are driving the market towards eco-friendly materials, contributing to the growth of the inverted pouch market.

What strategies are major players in the inverted pouch market adopting?

Key market players, such as Amcor Plc, APTAR, and Glenroy Inc., are focusing on product innovations, mergers, acquisitions, and partnerships to enhance their market position.

Pressure Sensitive Labels Market

Published:
Report ID: 36547

Baby Food Packaging Products Market

Published:
Report ID: 1910

Africa Flexible Packaging Market

Published:
Report ID: 35879

Africa Rigid Plastic Packaging Market

Published:
Report ID: 35876

Africa cold chain packaging Market

Published:
Report ID: 35872

Meat Packaging Market

Published:
Report ID: 8505

Rigid Packaging Market

Published:
Report ID: 9959

Glass Bottle Packaging Market

Published:
Report ID: 6638

Returnable Transport Packaging (RTP) Market

Published:
Report ID: 31723

Retail Ready Packaging Market

Published:
Report ID: 23508

Medication Pouch Inspection Market

Published:
Report ID: 22972

Seaweed Coated Carton Market

Published:
Report ID: 19373

Purchase Options

$2999
Delivery Format: Excel.
$4999
Designed for the individual purchaser.
$6999
Users located at a single corporate site or regional office.
$7999
Allowed for unlimited sharing globally within one company.
Smallform of Sample request

Have a question?

User Profile

Don’t settle for less – trust Mitul to help you find the best solution.

Report delivery within 24 to 48 hours

– Other Info –

What people say?-

User Review

I am very impressed with the information in this report. The author clearly did their research when they came up with this product and it has already given me a lot of ideas.

Jana Schmidt
CEDAR CX Technologies

– Connect with us –

Phone

+91 6232 49 3207


support

24/7 Research Support


sales@credenceresearch.com

– Research Methodology –

Going beyond the basics: advanced techniques in research methodology

– Trusted By –

Pepshi, LG, Nestle
Motorola, Honeywell, Johnson and johnson
LG Chem, SIEMENS, Pfizer
Unilever, Samsonite, QIAGEN