
Market Overview:
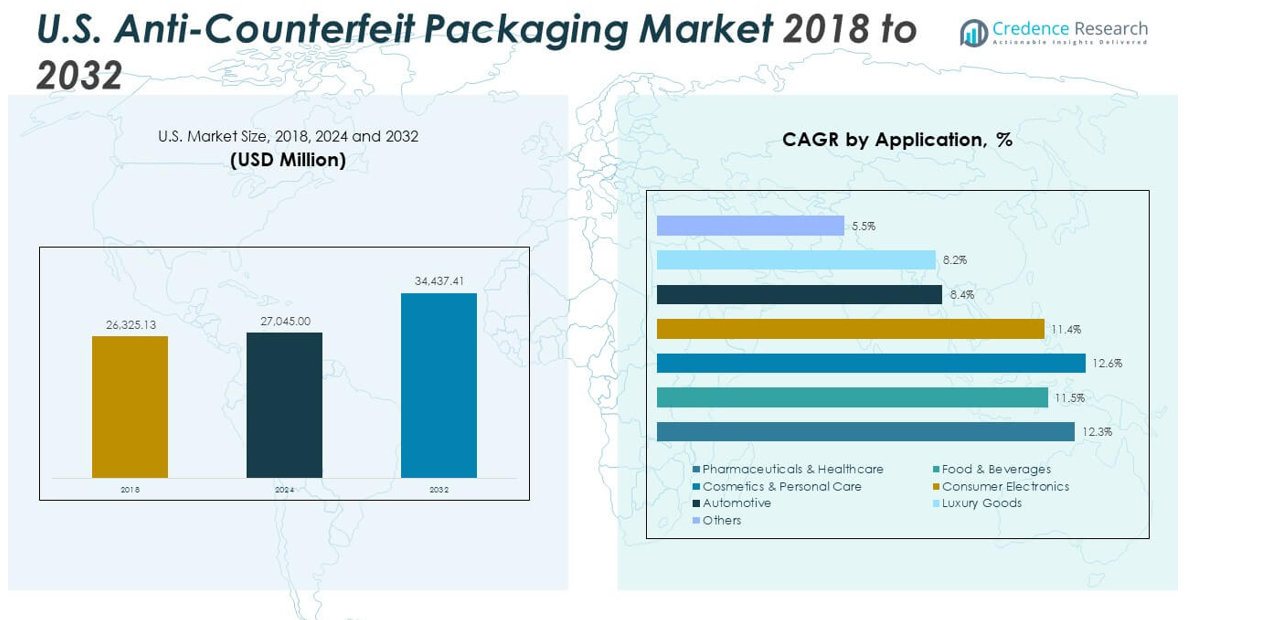
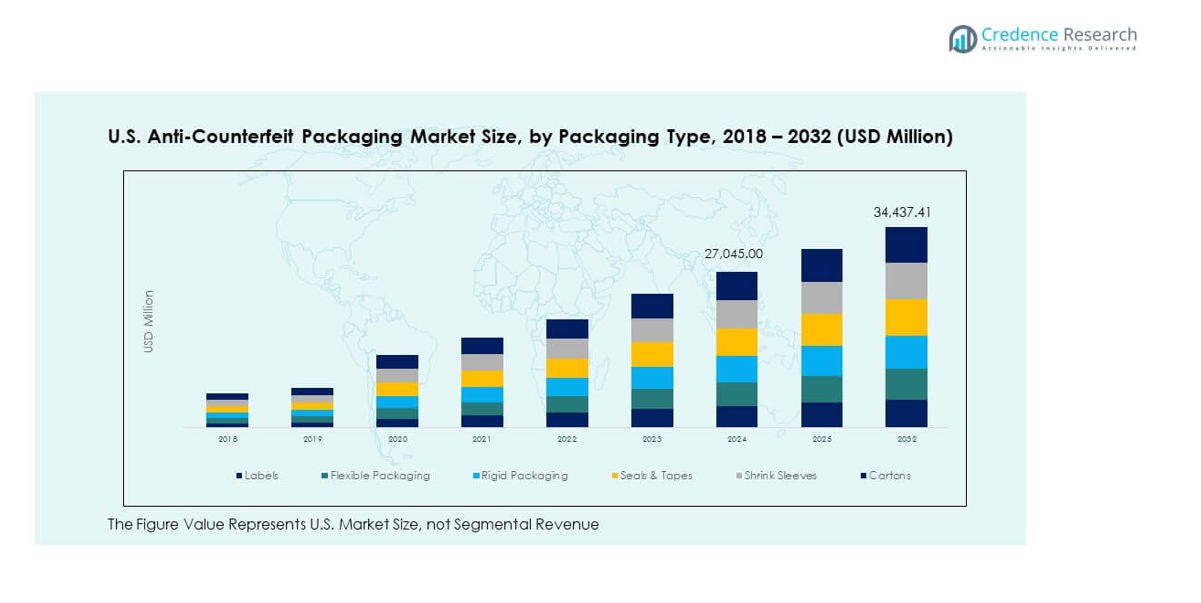
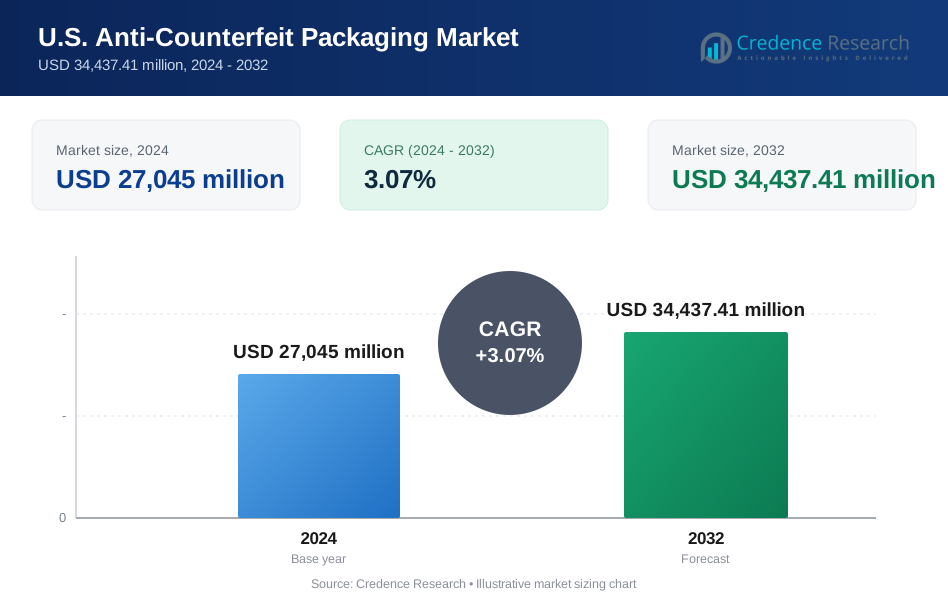
The U.S. Anti-Counterfeit Packaging Market size was valued at USD 26,325.13 million in 2018, increased to USD 27,045.00 million in 2024, and is anticipated to reach USD 34,437.41 million by 2032, growing at a CAGR of 3.07% during the forecast period.
| REPORT ATTRIBUTE | DETAILS |
|---|---|
| Historical Period | 2020-2023 |
| Base Year | 2024 |
| Forecast Period | 2025-2032 |
| U.S. Anti-Counterfeit Packaging Market Size 2024 | USD 27,045.00 million |
| U.S. Anti-Counterfeit Packaging Market, CAGR | 3.07% |
| U.S. Anti-Counterfeit Packaging Market Size 2032 | USD 34,437.41 million |
Growing brand protection needs, rising counterfeit risks, and digital transformation drive the market expansion. Companies invest heavily in advanced labeling, holograms, and RFID-based tracking systems to secure product authenticity. The demand for traceable packaging rises in pharmaceuticals, food, beverages, and consumer electronics. Strengthened federal mandates on serialization and labeling encourage broader adoption of secure packaging practices. Increasing consumer awareness and e-commerce expansion also push producers to ensure verified product delivery, reinforcing steady growth across the U.S.
Regionally, the Northeast and Midwest lead due to their strong pharmaceutical and industrial manufacturing bases. These areas integrate serialized tracking and tamper-evident seals across regulated products. The South follows with fast adoption in logistics and consumer goods hubs such as Texas and Florida, driven by port trade and online retail networks. Western states, including California and Washington, gain traction through high technology adoption and eco-secure packaging materials. Together, these regions define a diverse yet robust market structure supported by strict compliance and ongoing innovation.
Market Insights
- The U.S. Anti-Counterfeit Packaging Market was valued at USD 26,325.13 million in 2018, reached USD 27,045.00 million in 2024, and is projected to hit USD 34,437.41 million by 2032, growing at a CAGR of 3.07% during the forecast period.
- The Northeast and Midwest together dominate with around 38% share due to the concentration of pharmaceutical, healthcare, and industrial hubs that prioritize serialization and regulated packaging systems.
- The South follows with nearly 33% share, supported by expanding logistics networks, large manufacturing zones, and increasing e-commerce activities driving anti-counterfeit labeling adoption.
- The West represents about 29% and is the fastest-growing region, driven by California’s technology innovation, sustainability-focused materials, and strong digital authentication ecosystem.
- In segment share, Labels hold the largest portion of the market followed by Flexible and Rigid Packaging, reflecting demand for traceable, durable, and secure solutions integrated across pharmaceuticals, electronics, and consumer goods.
Market Drivers
Growing Need for Product Authentication Across Critical Sectors
The U.S. Anti-Counterfeit Packaging Market expands as industries face stronger pressure to verify authenticity. Pharmaceutical, cosmetic, and food brands deploy multi-layered security systems that confirm product legitimacy across supply chains. It benefits from rapid implementation of serialization and digital tracking technologies that reduce recall risks. Brand owners focus on trust restoration following counterfeit-related losses. Consumers show preference for products with visible security labels. The government enforces tighter rules to protect patient and consumer safety. Cloud-linked traceability solutions reinforce accountability. This consistent demand sustains the sector’s steady development nationwide.
- For example, Johnson & Johnson implemented a DSCSA-compliant serialization and traceability system embedding unique identifiers on drug packages. The company successfully verified over 16,000 serialized products in pilot tests, improving supply-chain transparency and patient safety across the U.S. pharmaceutical market.
Expansion of E-Commerce and Omnichannel Distribution Platforms
E-commerce growth drives companies to secure packaging for goods shipped through long and complex routes. Online transactions create greater exposure to counterfeiting attempts that exploit weak links in supply networks. Brands use tamper-evident seals and smart labeling to confirm authenticity before delivery. It supports retailers aiming to safeguard consumer confidence during doorstep delivery. Logistics providers implement scanning solutions to validate shipments in real time. The U.S. Postal and Customs agencies enhance data tracking systems to detect suspicious consignments. Digital integration strengthens transparency between seller and buyer. Such advancements push broader packaging modernization across industries.
Stricter Regulatory Standards and Industry Compliance Mandates
Government agencies reinforce anti-counterfeit measures through clear labeling and serialization laws. The FDA mandates traceability across drug manufacturing and distribution to curb illegal substitution. It compels manufacturers to adopt data-rich identifiers that meet compliance standards. High-value electronics and automotive suppliers follow similar mandates to ensure supply-chain visibility. Third-party verifiers perform random audits to confirm compliance accuracy. Packaging companies redesign workflows to integrate legal codes without slowing production. End users view compliance as a competitive differentiator. The rise in oversight continues to promote investments in verified packaging technologies.
Technological Integration and Smart Packaging Transformation
Adoption of advanced technologies accelerates, merging artificial intelligence, blockchain, and IoT into packaging solutions. It helps detect tampering patterns and creates immutable transaction records for authenticity checks. RFID and NFC chips are embedded for real-time location and verification updates. Predictive analytics platforms monitor supply-chain data to identify risk exposure. Machine-readable codes allow consumers to verify products instantly via mobile devices. Packaging automation tools reduce manual verification delays. Leading companies adopt machine learning for anomaly detection in labeling lines. This technological convergence enhances reliability and trust in high-risk product categories.
- For example, Sproxil employs blockchain, AI-powered anomaly detection, and NFC chips across over 150 million product packages worldwide. Its real-time verification system enables consumers to confirm authenticity instantly and helps manufacturers monitor suspicious activity continuously.
Market Trends
Rising Adoption of Connected Packaging and Cloud-Based Tracking
The U.S. Anti-Counterfeit Packaging Market experiences a shift toward intelligent, networked verification systems. Connected packaging integrates product identity with digital twins hosted on cloud platforms. Companies create real-time visibility across distribution networks using track-and-trace dashboards. QR-enabled smart labels offer direct engagement with end users. It encourages transparent brand-consumer relationships through accessible authentication data. Startups collaborate with packaging manufacturers to scale digital trust solutions. Cloud-based security strengthens interoperability among supply-chain partners. These connected solutions build resilience against counterfeit infiltration and inventory loss.
- For example, AWS IoT TwinMaker enables industrial digital twins by integrating IoT data, 3D visuals, and operational systems. INVISTA uses this solution with Matterport integration to visualize plant assets, detect anomalies faster, and enhance predictive maintenance efficiency.
Growth of Sustainable and Recyclable Anti-Counterfeit Materials
Eco-friendly design merges with security innovation, driving sustainable solutions in the packaging domain. Firms develop biodegradable holograms, recyclable seals, and water-based inks that resist duplication. It supports corporate environmental goals while preserving brand integrity. Manufacturers test plant-derived films that maintain tamper resistance under stress. Regulatory incentives motivate green packaging upgrades in compliance with recycling policies. Supply chains integrate low-carbon materials with embedded verification codes. Adoption of circular packaging models enhances sustainability credentials. The balance between ecological and security performance defines next-generation packaging strategies.
Increased Role of Artificial Intelligence in Fraud Detection
AI-driven analytics transform counterfeit detection accuracy and efficiency in production workflows. Machine vision systems inspect thousands of units per minute for irregularities. Deep learning algorithms identify subtle printing or coating inconsistencies that human inspectors miss. It enables early intervention, lowering waste and recall rates. Predictive models analyze shipment anomalies to prevent diversion. Companies deploy automated validation systems in fulfillment centers for risk control. AI improves both speed and reliability of quality assurance. Such automation makes anti-counterfeit packaging more scalable and precise across industries.
Rising Demand for Customizable and Brand-Specific Security Features
Brand owners prioritize tailor-made features that blend identity with protection. Customized holographic logos, invisible inks, and embedded signatures enhance differentiation in competitive markets. It allows enterprises to convey authenticity through unique visual markers. Security suppliers design modular systems that adapt to varied product lifecycles. Digital watermarking aligns with marketing campaigns for interactive engagement. Luxury brands expand partnerships with advanced security firms to preserve exclusivity. Mid-size companies adopt hybrid features combining overt and covert cues. Personalization strengthens both aesthetics and counterfeit resistance in product packaging.
- For example, SICPA, a global leader in security inks and authentication technologies, provides overt and covert solutions including holographic markings, digital watermarks, and invisible inks. Its patented systems are widely used in currency printing, pharmaceuticals, and luxury goods to ensure product authenticity and brand protection.
Market Challenges Analysis
High Implementation Costs and Integration Barriers Across Supply Chains
The U.S. Anti-Counterfeit Packaging Market faces cost constraints linked to advanced technology deployment. High-end holographic films, smart chips, and digital tracking platforms raise capital spending for small and medium enterprises. Integration into legacy packaging lines creates operational friction and downtime. It requires specialized staff training and software alignment with production systems. Supply-chain fragmentation complicates consistent application of security features. Vendors struggle to justify ROI when counterfeit threats appear sporadic. Limited interoperability between vendor systems slows traceability efficiency. These factors limit rapid expansion among cost-sensitive manufacturers.
Evolving Counterfeit Techniques and Technological Imitation Risks
Counterfeiters continuously refine techniques that mimic legitimate security features. They exploit gaps in inspection standards and duplicate common visual identifiers. It pressures packaging innovators to invest in newer, harder-to-replicate solutions. Cybersecurity threats rise as digital verification platforms expand. Malware infiltration risks compromise cloud authentication systems. Companies must implement regular encryption updates and digital audits to preserve trust. Limited public awareness reduces reporting of counterfeit activity. These ongoing imitation challenges demand constant innovation and coordination across the ecosystem.
Market Opportunities
Rising Penetration of Smart and Interactive Packaging Solutions
Brands explore digital engagement features that merge security with consumer experience. Smart labels enable users to access verification data, rewards, or educational content through smartphones. It enhances transparency while building loyalty. Integration with augmented reality offers immersive authentication experiences. Startups innovate lightweight RFID and NFC systems suitable for mass-market products. E-commerce retailers adopt real-time scanning solutions that ensure verified deliveries. Growing digital familiarity among consumers widens adoption potential across sectors. The move toward interactive packaging boosts future innovation investment.
Expansion of Pharmaceutical Serialization and Global Traceability Programs
The pharmaceutical sector remains a critical growth driver through national and cross-border serialization mandates. Companies adopt advanced identifiers that comply with DSCSA and GS1 standards. It promotes consistent traceability across every stage of the drug supply chain. Manufacturers integrate AI-supported inspection to reduce labeling errors. Cloud-based registries connect distributors and healthcare institutions under unified verification platforms. Compliance initiatives expand collaboration among regulators, producers, and retailers. Continued federal support for serialization modernization opens long-term revenue opportunities.
Market Segmentation Analysis
By Packaging Type
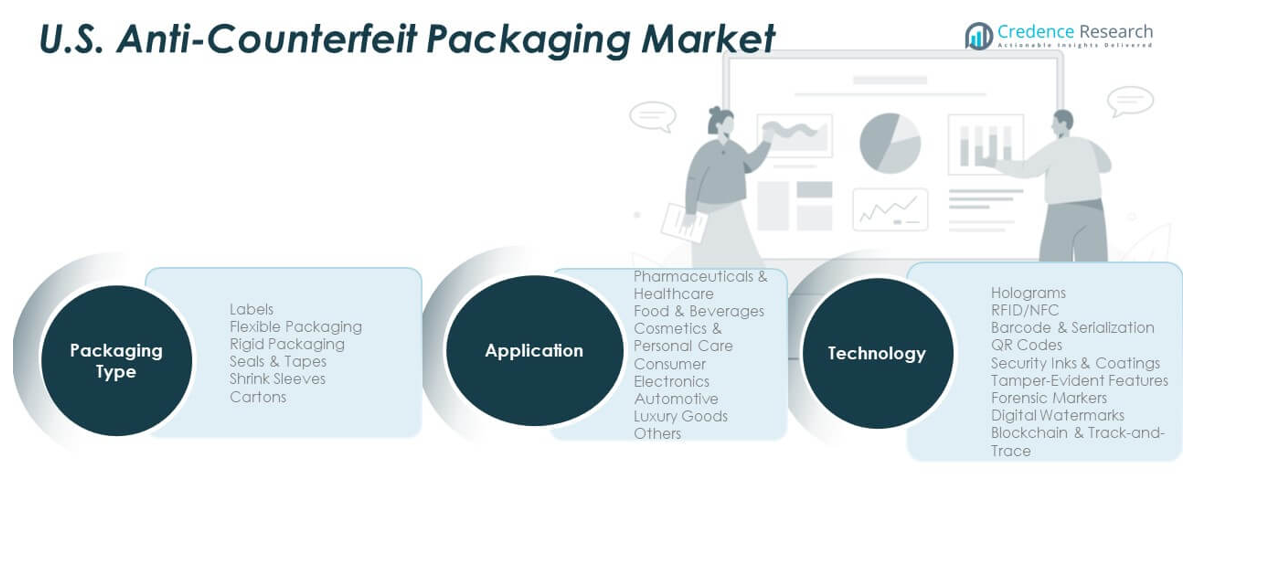
Labels dominate the market due to their adaptability for embedding serial codes and holographic features. Flexible packaging gains traction across food and personal care products requiring lightweight solutions. Rigid packaging serves high-value electronics and medical devices needing durable protection. Seals and tapes secure shipment integrity and detect tampering instantly. Shrink sleeves support visual branding while adding anti-replication layers. Cartons provide physical stability and layered coding for retail verification. The U.S. Anti-Counterfeit Packaging Market benefits from increasing alignment of materials with advanced digital traceability systems.
- For example, Avery Dennison’s RFID case labeling solution improved inventory count time by about 90%, achieved 100% delivery confirmation, and reduced truck turnaround time by 25% for a major fast-food chain, demonstrating measurable efficiency gains in supply-chain visibility and logistics performance.
By Application
Pharmaceuticals and healthcare applications lead demand due to strict safety and distribution standards. Food and beverages adopt security coding to prevent contamination and mislabeling. Cosmetics and personal care brands emphasize brand protection against counterfeit imports. Consumer electronics integrate smart authentication for warranty validation. Automotive and luxury goods segments use tamper-resistant identifiers to deter theft. Other industries experiment with covert codes for industrial products. Each vertical focuses on combining visual and digital protection to enhance credibility and ensure compliance.
By Technology
Holograms remain a widely accepted feature offering instant visual authentication. RFID and NFC support advanced tracking and interactive engagement. Barcode and serialization systems ensure regulatory adherence in bulk packaging. QR codes facilitate quick mobile verification across retail platforms. Security inks and coatings deliver covert protection for niche applications. Tamper-evident features enable quick detection of interference. Forensic markers and digital watermarks add deeper traceability through chemical or digital identifiers. These technologies jointly drive the evolution of secure packaging ecosystems.
- For example, Holograms, RFID, barcodes, QR codes, and security inks all provide layered authentication. Avery Dennison’s Smartrac RFID tags used by Audi enabled over 99.8% accuracy in vehicle tracking in manufacturing logistics, demonstrating reliable real-time data and enhanced production efficiency.
Segmentation
By Packaging Type
- Labels
- Flexible Packaging
- Rigid Packaging
- Seals & Tapes
- Shrink Sleeves
- Cartons
By Application
- Pharmaceuticals & Healthcare
- Food & Beverages
- Cosmetics & Personal Care
- Consumer Electronics
- Automotive
- Luxury Goods
- Others
By Technology
- Holograms
- RFID/NFC
- Barcode & Serialization
- QR Codes
- Security Inks & Coatings
- Tamper-Evident Features
- Forensic Markers
- Digital Watermarks
Regional Analysis
Northeast and Midwest – Strong Industrial and Healthcare Adoption
The U.S. Anti-Counterfeit Packaging Market records dominant performance across the Northeast and Midwest, accounting for nearly 38% of the total share. Pharmaceutical and healthcare manufacturing clusters in states such as New York, New Jersey, and Illinois drive steady demand for serialization and track-and-trace technologies. It benefits from the region’s concentration of biotechnology and life sciences firms that rely on high-integrity labeling. Food processing industries also adopt coded seals and holographic features to safeguard authenticity. Federal oversight and supply-chain compliance programs further elevate investments. Strong infrastructure and established R&D hubs continue to strengthen these regional markets.
South – Expanding Logistics and Consumer Goods Networks
Southern states capture approximately 33% of the national market share, supported by expanding logistics and consumer goods production zones. Texas, Florida, and Georgia emerge as prime markets where packaging innovation aligns with high-volume trade flows. It gains traction from regional distribution centers that prioritize tamper-proof packaging for food, beverages, and electronics. Growing e-commerce penetration boosts usage of smart labeling and authentication tags across online supply routes. Local authorities encourage the deployment of verified tracking systems to reduce counterfeit inflow through ports. Favorable investment climate and industrial diversification make the South a growing contributor to market expansion.
West – Technology Leadership and Sustainability Focus
The western subregion contributes roughly 29% of total market share, led by California and Washington’s advanced packaging technology base. Companies emphasize digital watermarking, cloud-enabled labeling, and eco-secure materials for brand protection. It benefits from strong collaboration between software innovators and packaging suppliers developing integrated security ecosystems. Tech-driven industries use blockchain authentication to protect high-value goods. Sustainability policies drive adoption of recyclable anti-counterfeit packaging solutions. Silicon Valley startups contribute new digital verification models that strengthen the competitive edge of western suppliers.
Key Player Analysis
- Avery Dennison Corporation
- 3M Company
- DuPont de Nemours
- Zebra Technologies Corporation
- Applied DNA Sciences
- Authentix
- PharmaSecure
- Impinj, Inc.
- Systech International
- Checkpoint Systems
- Ampacet Corporation
- TruTag Technologies
- Alien Technology
Competitive Analysis
The U.S. Anti-Counterfeit Packaging Market features strong competition driven by technological innovation and product differentiation. Leading participants such as Avery Dennison Corporation, CCL Industries, 3M Company, Amcor plc, and Avery Dennison emphasize advanced printing and digital traceability solutions. It encourages new entrants to adopt hybrid systems combining holograms, smart chips, and invisible inks. Established players expand partnerships with pharmaceutical, FMCG, and electronics companies to secure long-term contracts. Continuous R&D investment supports development of cloud-linked security codes and AI-based verification systems. Firms compete on integration capabilities, compliance assurance, and sustainability performance. Mergers and acquisitions remain common strategies to broaden technology portfolios and strengthen geographic presence across major industrial states.
Recent Developments
- In September 2025, Avery Dennison further collaborated with Impinj, Inc. by integrating Impinj's Gen2X RFID chips into its leading RFID inlay portfolio, enhancing inventory control, item tracking, and anti-counterfeiting measures globally. This partnership marked a significant development in RFID technology relevant to anti-counterfeit packaging solutions.
- In November 2024, Ennoventure, a leader in AI brand protection, secured $8.9 million in funding to expand its AI-powered anti-counterfeiting technology, marking a significant advancement in the anti-counterfeit packaging market.
- In April 2024, 3M launched the 3M Verify app, an advanced technology designed to combat counterfeit personal protective equipment (PPE) by verifying product authenticity. This launch illustrates the increasing adoption of digital verification tools in the anti-counterfeit packaging sector, enhancing safety and brand protection efforts.
Report Coverage
The research report offers an in-depth analysis based on packaging type, application, and technology segments. It details leading market players, providing an overview of their business, product offerings, investments, revenue streams, and key applications. Additionally, the report includes insights into the competitive environment, SWOT analysis, current market trends, as well as the primary drivers and constraints. Furthermore, it discusses various factors that have driven market expansion in recent years. The report also explores market dynamics, regulatory scenarios, and technological advancements that are shaping the industry. It assesses the impact of external factors and global economic changes on market growth. Lastly, it provides strategic recommendations for new entrants and established companies to navigate the complexities of the market.
Future Outlook
- Rising focus on brand integrity and consumer safety will keep demand for secure packaging high across industries.
- Integration of AI, blockchain, and IoT into packaging systems will enable real-time authentication and visibility.
- Adoption of cloud-based traceability platforms will expand, enhancing transparency from factory to end user.
- Demand from pharmaceuticals and healthcare sectors will strengthen due to strict serialization mandates.
- Sustainability will drive development of recyclable and eco-friendly anti-counterfeit packaging materials.
- E-commerce growth will increase adoption of tamper-evident and trackable labeling solutions.
- Expansion of connected packaging will improve engagement between brands and consumers through smart identifiers.
- Collaboration between packaging manufacturers and technology firms will accelerate system innovation.
- Regional investments in automation and compliance will improve scalability for small and mid-size enterprises.
- Ongoing regulatory upgrades will sustain steady innovation cycles, reinforcing market stability and trust.
Request a Free Sample
Fill in your details and we'll send you a free sample report.
- Sample data tables & charts
- Research methodology
Need a Custom Version of This Report?
Tailor the scope, geography, or segments to your exact requirements.
- Custom geography or segment scope
- Direct access to our analyst team
Frequently Asked Questions
What is the current market size for U.S. Anti-Counterfeit Packaging Market, and what is its projected size in 2032?
At what Compound Annual Growth Rate is the U.S. Anti-Counterfeit Packaging Market projected to grow between 2024 and 2032?
Which U.S. Anti-Counterfeit Packaging Market segment held the largest share in 2024?
What are the primary factors fueling the growth of the U.S. Anti-Counterfeit Packaging Market?
Who are the leading companies in the U.S. Anti-Counterfeit Packaging Market?
Table of Content
Chapter 1. Report Introduction
- 1.1 Report Description & Purpose
- 1.1.1 Report Title & Market Definition
- 1.1.2 Unique Selling Propositions (USP) & Key Differentiators
- 1.1.3 Value Proposition for Stakeholders
- 1.2 Research Objectives
- 1.2.1 Market Sizing Objectives (Volume & Revenue)
- 1.2.2 Segmentation Objectives
- 1.2.3 Competitive Intelligence Objectives
- 1.2.4 Forecast & Scenario Objectives
- 1.3 Report Scope
- 1.3.1 U.S. Anti-Counterfeit Packaging Scope – Types & Subtypes Covered
- 1.3.2 Geographic Scope – Regions & Countries Covered
- 1.3.3 Historical Period, Base Year & Forecast Period (2024; forecast to 2032)
- 1.3.4 Inclusions & Exclusions
- 1.4 HS Code & Classification Framework
- 1.5 Currency, Units & Pricing Basis
- 1.6 Target Stakeholders
- 1.7 Limitations & Assumptions
Chapter 2. Executive Summary
- 2.1 Global U.S. Anti-Counterfeit Packaging Market Snapshot
- 2.1.1 Market Size – Historical (2024) & Forecast (2024-2032) (2024: USD 27,045 million → 2032: USD 34,437.41 million)
- 2.1.2 Volume & Revenue – Global Totals
- 2.1.3 Key Market Highlights – Top Five Facts
- 2.2 U.S. Anti-Counterfeit Packaging Market Segmentation Snapshot
- 2.2.1 Market Split by Region – 2024 vs. 2032
- 2.3 Competitive Snapshot
- 2.3.1 Top 10 Players by Revenue Share – 2024
- 2.3.2 Top 10 Players by Volume Share – 2024
- 2.3.3 Recent Strategic Developments (18-Month Summary)
- 2.4 Key Investment Highlights & Strategic Conclusions
Chapter 3. U.S. Anti-Counterfeit Packaging Market Dynamics & Industry Analysis
- 3.1 Market Overview & Context
- 3.1.1 U.S. Anti-Counterfeit Packaging Market Position in the Broader Automotive Value Chain
- 3.1.2 OEM vs. Replacement Market Dynamics
- 3.1.3 Market Maturity & Development Stage by Region
- 3.2 U.S. Anti-Counterfeit Packaging Market Drivers
- 3.3 U.S. Anti-Counterfeit Packaging Market Restraints & Challenges
- 3.4 U.S. Anti-Counterfeit Packaging Market Opportunities
- 3.5 Porter's Five Forces Analysis
- 3.5.1 Threat of New Entrants
- 3.5.2 Bargaining Power of Suppliers
- 3.5.3 Bargaining Power of Buyers
- 3.5.4 Threat of Substitutes
- 3.5.5 Competitive Rivalry – Intensity Assessment
- 3.6 U.S. Anti-Counterfeit Packaging Value Chain Analysis
- 3.6.1 Upstream – Raw Material/Input Suppliers
- 3.6.1.1 Raw Material/Input 1
- 3.6.1.2 Raw Material/Input 2
- 3.6.1.3 Raw Material/Input 3
- 3.6.2 Midstream – Production/Manufacturing/Service Delivery
- 3.6.2.1 Production/Process Overview
- 3.6.2.2 Key Facility Locations & Capacity by Manufacturer
- 3.6.3 Downstream – Distribution & End Consumer
- 3.6.3.1 Primary Channel – B2B/OEM
- 3.6.3.2 Secondary Channels – Dealer, Retail, Online, Direct
- 3.6.4 Value Chain Profitability Analysis
- 3.6.1 Upstream – Raw Material/Input Suppliers
- 3.7 PESTEL Analysis
- 3.7.1 Political Factors
- 3.7.2 Economic Factors
- 3.7.3 Social Factors
- 3.7.4 Technological Factors
- 3.7.5 Environmental Factors
- 3.7.6 Legal Factors
- 3.8 U.S. Anti-Counterfeit Packaging Supply Chain Analysis
- 3.8.1 Raw Material/Input Supply Risk Assessment
- 3.8.2 Manufacturing Concentration Risk (Geographic Exposure)
- 3.8.3 Trade Disruption Impact Analysis
- 3.9 Regulatory & Policy Landscape
Note: The regulatory and policy landscape section covers regulations based on their applicability to the market, U.S. Anti-Counterfeit Packaging category, geography, and scope of the study. Only regulatory frameworks with a material impact on operations, compliance, trade, sustainability, or market access are analyzed in detail.
Chapter 4. Key Investment Pockets & Opportunity Analysis
- 4.1 U.S. Anti-Counterfeit Packaging Market Attractiveness Analysis
- 4.1.1 By Region – Investment Attractiveness Matrix (Volume × CAGR)
- 4.2 Absolute Revenue Growth Opportunity
- 4.2.1 By Region – Absolute USD Growth Through 2032
- 4.3 Incremental Volume Opportunity
- 4.3.1 By Region – Incremental Volume Through 2032
- 4.3.2 Segment – Incremental Volume
- 4.4 Emerging Submarket Opportunity Deep Dive (Subject to Applicability)
- 4.5 Emerging Market Opportunity Scorecards
- 4.5.1 United States
- 4.5.2 Europe
- 4.5.3 Asia
- 4.5.4 Middle East & Africa
Note: Emerging Market Opportunity Scorecards will be included based on relevance and strategic importance. Regions listed are indicative and may vary depending on data availability and market dynamics.
Chapter 5. U.S. Anti-Counterfeit Packaging Import-Export Analysis & Trade Flows
- 5.1 Global Trade Overview
- 5.1.1 Global Export Value by Country (2024)
- 5.1.2 Global Export Volume by Country (2024)
- 5.1.3 Global Import Value by Country (2024)
- 5.1.4 Global Import Volume by Country (2024)
- 5.1.5 Net Trade Balance by Country (2024)
- 5.2 Export Analysis – Segment
- 5.2.1 Type 1 (HS Code)
- 5.2.2 Type 2 (HS Code)
- 5.2.3 Type 3 (HS Code)
- 5.2.4 Type 4 (HS Code)
- 5.2.5 Type 5 (HS Code)
- 5.3 Import Analysis – Segment
- 5.3.1 Type 1 (HS Code)
- 5.3.2 Type 2 (HS Code)
- 5.3.3 Type 3 (HS Code)
- 5.3.4 Type 4 (HS Code)
- 5.3.5 Type 5 (HS Code)
- 5.4 Average Unit Trade Prices
- 5.4.1 Average Export Price – Segment & Country
- 5.4.2 Average Import Price – Segment & Source Country
- 5.4.3 Price Trends (2024)
- 5.5 Key Trade Route Analysis
- 5.5.1 Trade Route 1
- 5.5.2 Trade Route 2
- 5.5.3 Trade Route 3
- 5.5.4 Trade Route 4
- 5.5.5 Trade Route 5
- 5.6 Trade Policy Impact Assessment
- 5.6.1 US Anti-Dumping & Section 301 Tariffs
- 5.6.2 EU Customs Union Impact
- 5.6.3 Major Free Trade Agreements
- 5.6.4 USMCA Rules of Origin
Note: Trade policy analysis will be included only where relevant to the U.S. Anti-Counterfeit Packaging market.
Chapter 6. Competitive Landscape & Company Benchmarking
- 6.1 U.S. Anti-Counterfeit Packaging Market Concentration & Structure
- 6.1.1 Herfindahl-Hirschman Index (HHI) – vs. 2024
- 6.1.2 Tier 1, Tier 2 & Tier 3 Market Structure
- 6.1.3 Global, Regional & Local Player Dynamics
- 6.2 U.S. Anti-Counterfeit Packaging Market Share Analysis – 2024
- 6.2.1 Global Revenue Share by Company
- 6.2.2 Global Volume Share by Company
- 6.2.3 Regional Revenue Share
- 6.2.4 Market Share Evolution ( vs. 2024)
- 6.2.5 OEM Segment Share by Company
- 6.2.6 Replacement Segment Share by Company
- 6.3 Production/Delivery Capacity & Facility Analysis
- 6.3.1 Global Installed Capacity
- 6.3.2 Capacity Utilization Rates
- 6.3.3 Production/Output Volume
- 6.3.4 Facility Locations & Capacity Map
- 6.3.5 Planned Capacity Additions
- 6.4 U.S. Anti-Counterfeit Packaging Competitive Benchmarking Matrix
- 6.4.1 Revenue, Volume, CAGR & Profitability Comparison
- 6.4.2 Channel Revenue Mix
- 6.4.3 Geographic Revenue Exposure
- 6.4.4 R&D Intensity
- 6.4.5 Sustainability Maturity
- 6.5 Strategic Developments in U.S. Anti-Counterfeit Packaging (Last 24 Months)
- 6.5.1 Mergers, Acquisitions & Divestments
- 6.5.2 New U.S. Anti-Counterfeit Packaging Launches
- 6.5.3 Facility Expansions
- 6.5.4 Strategic Alliances, Joint Ventures & Partnerships
- 6.5.5 Distribution Expansion & Market Entry
- 6.5.6 Sustainability & ESG Initiatives
- 6.6 Competitive Strategy Mapping
- 6.6.1 Leader, Challenger, Follower & Niche Classification
- 6.6.2 Pricing Strategy Comparison
- 6.6.3 Channel Strategy Matrix
Note: Strategic developments are included based on their materiality and the availability of reliable information.
Chapter 7. Global U.S. Anti-Counterfeit Packaging Market – By Distribution Channel
- 7.1 Segment Overview
- 7.1.1 Volume & Revenue Split by Channel (2024 & 2032)
- 7.1.2 Channel Mix Evolution (2024-2032)
Chapter 8. Regional Market Analysis – Global Overview
- 8.1 Global Regional Overview
- 8.1.1 Regional Volume Share
- 8.1.2 Regional Revenue Share
- 8.1.3 Regional Volume by Region
- 8.1.4 Regional Revenue by Region
- 8.1.5 Regional Forecast Through 2032
- 8.2 Cross-Regional Segment Analysis
- 8.2.1 By Distribution Channel
- 8.2.2 By Brand/Price Tier
Chapter 9. North America U.S. Anti-Counterfeit Packaging Market
- 9.1 United States
- 9.2 Canada
- 9.3 Mexico
Chapter 10. Europe U.S. Anti-Counterfeit Packaging Market
- 10.1 Germany
- 10.2 France
- 10.3 Italy
- 10.4 United Kingdom
- 10.5 Spain
- 10.6 Poland
- 10.7 Russia
- 10.8 Netherlands
- 10.9 Belgium
- 10.10 Sweden
- 10.11 Denmark
- 10.12 Norway
- 10.13 Rest of Europe
Chapter 11. Asia Pacific U.S. Anti-Counterfeit Packaging Market
- 11.1 China
- 11.2 India
- 11.3 Japan
- 11.4 South Korea
- 11.5 Thailand
- 11.6 Indonesia
- 11.7 Vietnam
- 11.8 Malaysia
- 11.9 Australia
- 11.10 Rest of Asia Pacific
Chapter 12. Latin America U.S. Anti-Counterfeit Packaging Market
- 12.1 Brazil
- 12.2 Argentina
- 12.3 Colombia
- 12.4 Chile
- 12.5 Rest of Latin America
Chapter 13. Middle East U.S. Anti-Counterfeit Packaging Market
- 13.1 Saudi Arabia
- 13.2 United Arab Emirates
- 13.3 Turkey
- 13.4 Israel
- 13.5 Iran
- 13.6 Rest of the Middle East
Chapter 14. Africa U.S. Anti-Counterfeit Packaging Market
- 14.1 South Africa
- 14.2 Egypt
- 14.3 Nigeria
- 14.4 Morocco
- 14.5 Rest of Africa
Chapter 15. U.S. Anti-Counterfeit Packaging Company Profiles
- 15.1 [Company 01]
- 15.1.1 Company Overview
- 15.1.2 Key Management Personnel
- 15.1.3 Products & Services Portfolio
- 15.1.4 Financial Performance
- 15.1.5 Key Market Focus & Geographic Presence
- 15.1.6 Recent Developments & Strategic Initiatives
Note: The company profile list is preliminary and may change based on research findings, market developments, data availability, and client requirements.
Chapter 16. Appendices
- Appendix A – List of Abbreviations & Acronyms
- Appendix B – Industry Classification Code Reference – Full Series
- Appendix C – Production & Capacity Data Tables
- Appendix D – End-Use & Demand Base Tables
- Appendix E – Consumption & Replacement Rate Assumptions
- Appendix F – ASP Reference Tables
- Appendix G – Manufacturing & Facility Database
- Appendix H – Import-Export Data Tables
- Appendix I – Regulatory Summary Tables
- Appendix J – Primary Research Participant List (Anonymized)
- Appendix K – Primary Research Questionnaire Framework
- Appendix L – Data Sources & Bibliography
- Appendix M – Market Size Divergence & Source Comparison
Chapter 17. Research Methodology
- 17.1 Research Framework & Philosophy
- 17.2 Secondary Research – Sources, Hierarchy & Data Extraction
- 17.3 Data Modeling – Bottom-Up & Top-Down Market Sizing
- 17.4 Primary Research – Stakeholder Framework, LOI & Sample Sizes
- 17.5 Forecast Methodology – Regression, Scenario & Sensitivity Analysis
- 17.6 Quality Control – Four-Layer Validation Framework
- 17.7 Limitations & Standard Assumptions
- 17.8 Disclaimer
